Global Patent Landscape of Induced Pluripotent Stem Cells
ABSTRACT
The global intellectual property landscape for induced pluripotent stem cell patents was analyzed. Patent filing trends were reviewed for geographic filing preferences, ownership differences, inventorship distribution, and citation strengths. The United States was found to be the leading iPSC patenting jurisdiction, with the University of California as the leading assignee. Although significant growth in this field has been made since 2006, Shinya Yamanaka is still the leading inventor for iPSC patents, and his patent has the most forward citations. Academic and non-profit institutions hold more iPSC patents than for-profit organizations by a ratio of 2:1.
INTRODUCTION.
Induced pluripotent stem cells (iPSCs) have become essential to regenerative medicine since they were first developed in 2006. iPSCs were developed by administering different mixes of embryonic transcription factors within somatic cells, allowing researchers to effectively create pluripotent cells that resemble embryonic stem cells (1). This discovery broke through an ethics barrier, as the usage of the multifunctional embryonic stem cells had caused an uproar among ethicists and within society as a whole (2). Today, iPSCs are used in regenerative medicine to create organoid structures that help model diseases and create effective therapeutics (3).
Because of the usage of iPSCs in the creation of drug treatments, they are frequently listed in patents regarding medicinal drug therapies. Analyzing patent filing data provides a high-level overview of research, business, and legal trends in a particular technical area, called a “patent landscape analysis”. Regenerative medicine is rapidly evolving as new technologies emerge, so it is crucial that patent landscape analyses stay up-to-date. Despite this rapid development, the number of comprehensive patent landscapes regarding iPSCs is low. The analyses that exist are either limited in scope or are not current.
One of the more recent landscapes is that by Morita, et al. Although it was published in 2019, this landscape chose to analyze only iPSC patents in Europe, Japan, and the United States (4). This means that patents filed in China, Korea, Australia, India, and other major nations were not included. Furthermore, as stated in their methodology, the only databases searched were those stored by the European Patent Office (EPO), the Japan Patent Office, and the U.S. Patent and Trademark Office, which again limits the scope of the landscape (4).
Conversely, another patent landscape about iPSCs by Roberts, et al., is very comprehensive in scope, analyzing over one thousand patent families from around the world (5). However, this study was published in 2014. Therefore, it is reasonable to assume from their own data, which shows an overall increase in iPSC patents over time, that a substantial number of new patents have been filed since this paper was published.
A few other patent landscapes were found, but all, including Georgieva,et al.; Simon,et al.; and Triller Vrtovec, et al., were conducted prior to 2010 (6)(7)(8). iPSCs would have only been in existence for four years by 2010, which means that an entire decade of data has now been omitted from these landscapes.
Because of these scope-related and time-related limitations, it was imperative for an updated, global, patent landscape on iPSCs to be performed. This study aimed to search an international database of filed patents that listed iPSCs as part of the claims section, in order to landscape trends.
MATERIALS AND METHODS.
2.1 Materials:
Worldwide patent publications were searched using Orbit Intelligence by Questel, a patent database capable of performing broad searches and analytics (9). The Orbit Intelligence database contains around 120 million patent records from one hundred different patenting authorities. Orbit search results are reported as “Patent Families”, which combine all versions of a single invention (versions at different stages of prosecution and in different countries) into a single record. This database is specific to patent research, so no mentions of iPSCs in scientific papers were included in searches.
2.2 Pre-Search:
An initial pre-search was conducted to find the broadest possible number of patent families with a connection to iPSCs. This pre-search was conducted using the following query:
(induced pluripotent stem cells OR IPSC OR IPS)/TI/AB/CLMS/DESC/ODES/OBJ/ADB/ICLM/KEYW/TX.
This pre-search yielded a total of 96,856 patent families. This pre-search searched through many parts of patents, including titles, abstracts, claims, descriptions, and the full text.
2.3 Query Refinement:
This pre-search picked up all mentions of iPSCs, including parenthetical citations and tangential mentions, so we determined that only mentions of iPSCs in the claims sections of patents should be analyzed. Because the claims sections are the most directly relevant to the substance of the patents, searching only these would eliminate a substantial number of tangential mentions of induced pluripotency.
Afterwards, it was determined that the query “IPS” could be a possible confounding variable, as this acronym can stand for much more than just “induced pluripotent stem”. The Orbit Intelligence operators were reviewed, and it was determined that the query “induced pluripotent stem cells” could be refined by shortening it to “induced pluripotent stem cell+”, in order to include both singular and plural forms (10).
Afterwards, the query was specialized for dates. iPSCs were first developed by Shinya Yamanaka and Kazutoshi Takahashi in August of 2006, so the query was truncated to include relevant patents filed after September 1, 2006 (11). Similarly, a final date of August 31, 2020 was set for this query. This effectively ensured that all relevant iPSC patents within the full fourteen-year period would be included. With all of these modifications, the final query was as follows:
(induced pluripotent stem cell+)/CLMS
This final query narrowed down the search from the initial 96,856 patent families to the most relevant 3,370 patents. These were the patent families analyzed for trends.
2.4 Data Verification:
The 3,370 patents were further examined to verify relevancy. As described by the supplemental methods of Roberts et al., cross-searches were conducted to discern any irrelevant patents (5).
2.5 Analysis:
Patents were reviewed manually to determine patterns with regards to data for assignees by organization types, assignees by organization type by year, top inventors, and most cited patent families. Additionally, Orbit’s auto-analyzer was used to analyze data regarding legal status, filings by year, filings by country, and top assignees. These data were sorted into graphs and plotted via Microsoft Excel.
2.5.1 ‘Legal Status of iPSC Patents’ Data Analysis:
For the purposes of this review, legal status was classified as either “granted”, “pending”, or “inactive”. All “expired”, “revoked”, or “lapsed” patents were grouped as inactive patents and were included in the search due to their potential significance regarding assignee data, inventor data, and patent citation data.
2.5.2 ‘iPSC Patents by Assignee Organization Type’ Data Analysis:
The two organization types for assignees were designated as either “Non-Profit/Academic” or “For-Profit/Industrial”. To sort between the two, unique iPSC patent assignee was first assessed. A total of 1,270 unique assignees were found. “Non-Profit/Academic” assignees were identified using multiple search-strings. For example, the search-string “universi” was used to sort out international universities that were listed in different languages (e.g., “UNIVERSITAET WIEN”). All universities, non-profit institutes, governmental laboratories and governmental agencies were categorized as “Non-Profit/Academic”.
After “Non-Profit/Academic” assignees were designated, the remaining assignees were reviewed individually to identify any other assignees that fell under the “Non-Profit/Academic” subtype. In cases of unfamiliarity, the assignee was researched to determine the correct categorization. The remaining assignees were all categorized as “For-Profit/Industry”. For the purposes of this analysis, individual persons listed as assignees were considered to be “For-Profit/Industry”.
2.5.3 ‘Top Inventors of iPSC Patents’ Data Analysis:
After an initial survey of the Orbit data, it was determined that some inventors were being listed as multiple unique inventors, each with a different variation of the singular inventor’s name. The list was sorted from greatest to least amounts of patents per inventor, and the top twenty inventors were manually searched by last name. Only 100% matches between first and last names were considered to be the same inventor, and Orbit was used to group repeat inventors as one. The top twenty inventors were then resorted from greatest to least.
RESULTS.
3.1 Legal Status of iPSC Patents Results:
Due to the relative novelty of iPSC technologies, it was hypothesized that a substantial number of patent families would still be in the patent-pending stage. Conversely, due to the fact that patents are valid for twenty years, it was hypothesized that there would not be very many inactive patent families (12). Of the 3,370 total iPSC patent families, 1,399 (41.5%) had been granted, 1,392 (41.3%) were patent pending, and 579 (17.2%) were inactive.
3.2 iPSC Patents by First Application Date Results:
Patents for iPSC technologies have grown steadily since the first filing in 2006. As shown in Figure 1A, 2018 saw the most new iPSC patent applications, with 431 new applications. There was a drop in new iPSC patent applications between 2011 and 2012, which saw only 193 new filings. Similarly, a drop-off can be seen between 2018 and 2020, although this is likely due to the 18 month lag caused between filing and publication date, as expressed by Morita et al (4). The period of 2011-2012 was the only one that yielded a decrease in new iPSC patent filings.
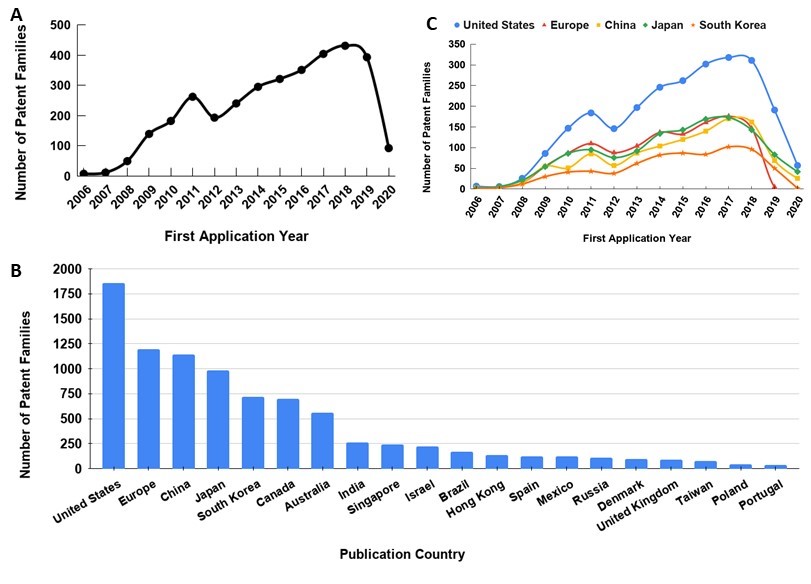
Figure 1 A. iPSCs related patent families graphed by year of first application (n = 3,370), B. Searched patent families graphed by distribution of patent filing geographic locations. Top twenty countries by publication are shown in the figure. n > 3,370 due to multinational validity for individual patent families. C. iPSC related patent families plotted by year and country of first application. The top five countries are shown in the figure.
iPSC technologies were shown to be patented worldwide, with filings in fifty-eight unique nations (plus the EPO). Further analysis details regional differences in the distribution of patent filings. Figure 1B shows the breakdown of iPSC-related patents by country of publication, with the top twenty nations shown. Due to the inclusion of the EPO patents and the fact that patents can be published in multiple countries, the total number of patent families for this dataset was 9,306 patent families.
Among these 9,306 patent families, most patents filings were made in the United States, with a total of 1,856, which makes up around 19.9% of all iPSC patents. Other leading filing jurisdictions include the EPO (12.9% with 1,197), the People’s Republic of China (12.2% with 1,142), Japan (10.6% with 985), and the Republic of Korea (7.7% with 721). Rounding out the top ten filing patent jurisdictions are Canada (703 iPSC patent publications), Australia (559), India (262), Singapore (244), and Israel (225). These five countries represent an additional 21.4% of iPSC-related patent filings.
The EPO is an international organization established on the basis of the European Patent Convention, and it serves as the overarching authority of patent law within Europe. Once a patent has been issued by the EPO, it can then be validated in individual EPO member countries (13). With regards to iPSC data, Figure 1B demonstrates that five EPO member states (United Kingdom, Spain, Denmark, Poland, and Portugal) are represented in the top twenty publishing countries.
When iPSC filing data for the top five iPSC patenting jurisdictions (the United States, the EPO, China, Japan, and the Republic of Korea) is plotted by year of first application, similar trends emerge to those shown in Figure 1A. As shown in Figure 1C, all five patenting locations had a concurrent drop in new iPSC patent filings in 2012. However, unlike the world at-large, which showed an increase in new iPSC patent filings in 2018, all top five patenting jurisdictions saw a slight decrease in the numbers of new filings. Apart from the common 2012 and 2018 drops, the United States saw a slight decrease in new filings between 2006 to 2007 (from 7 to 6). The EPO (between 2014 and 2015), China (between 2009 and 2010), and the Republic of Korea (between 2015 and 2016) also saw slight reductions in new iPSC patent filings, with a -4, -4, and -3 change, respectively. Of the top five countries, Japan was the only one to not see a slight drop in new patent filings outside of the common 2012 and 2018 drops.
3.3 iPSC Assignee Results:
Orbit Intelligence’s data generator was used to find data on the assignees of iPSC patents. Table 1 shows the twenty assignees that held the most iPSC patents. The University of California system held the most, with a total of 99. Kyoto University in Japan held a total of 93 iPSC technology patents, followed by Harvard College with 55, and the Agency for Science, Technology and Research (A*STAR), a Singaporean government agency, with 49. In total, 1,270 unique assignees hold patents regarding iPSC technologies. The twenty assignees shown in Table 1 hold a total of 758 of these patents, making up a combined 59.7% of iPSC patent-holders.
Table 1. Top assignees of iPSC patents. Plotted by legal status; top twenty assignees
| Assignee | Granted | Pending | Inactive | Total |
| UNIVERSITY OF CALIFORNIA | 30 | 46 | 23 | 99 |
| KYOTO UNIVERSITY | 56 | 26 | 11 | 93 |
| HARVARD COLLEGE | 18 | 20 | 17 | 55 |
| AGENCY FOR SCIENCE TECH. & RESEARCH ASTAR | 19 | 28 | 2 | 49 |
| MEMORIAL SLOAN KETTERING CANCER CENTER | 11 | 30 | 0 | 41 |
| WISCONSIN ALUMNI RESEARCH FOUNDATION | 24 | 14 | 3 | 41 |
| MASSACHUSETTS GENERAL HOSPITAL | 14 | 7 | 15 | 36 |
| FUJIFILM CELLULAR DYNAMICS | 21 | 10 | 2 | 33 |
| JOHNS HOPKINS UNIVERSITY | 11 | 13 | 6 | 30 |
| CEDARS SINAI MEDICAL CENTER | 6 | 19 | 4 | 29 |
| INSERM – INSTITUT NATIONAL DE LA SANTE ET DE LA RECHERCHE MEDICALE | 7 | 17 | 5 | 29 |
| YONSEI UNIVERSITY INDUSTRY ACAD COOPERATIO FOUNDATION | 18 | 10 | 1 | 29 |
| KOREA RESEARCH INSTITUTE OF BIOSCIENCE & BIOTECHNOLOGY | 24 | 2 | 1 | 27 |
| CRISPR THERAPEUTICS | 2 | 21 | 3 | 26 |
| CHILDRENS MEDICAL CENTER | 7 | 15 | 3 | 25 |
| LELAND STANFORD JUNIOR UNIVERSITY | 13 | 6 | 5 | 24 |
| UNIVERSITY OF MINNESOTA | 8 | 15 | 1 | 24 |
| UNIVERSITY OF TEXAS | 13 | 9 | 2 | 24 |
| GUANGZHOU INSTITUTE OF BIOMEDICINE & HEALTH CHINESE ACADEMY OF SC | 14 | 5 | 3 | 22 |
| SEOUL NATIONAL UNIVERSITY R&DB FOUNDATION (SNU) | 11 | 8 | 3 | 22 |
Table 1 also separates patents per assignee by the legal status. Although the University of California holds the most total patents, Kyoto University holds the most active patents, with 82, compared to the University of California’s 76. Kyoto University also has more granted patents, with 55, than the University of California, which has 30. Conversely, the University of California (46) has more patents-pending than any other assignee.
Of the 1,270 unique assignees, 678 were classified as “Non-Profit/Academic”, which comprised 53.4% of all iPSC assignees (Figure 2A). Conversely, 592 assignees were categorized as “For-Profit/Industry”, which comprised the remaining 46.6% of iPSC assignees.
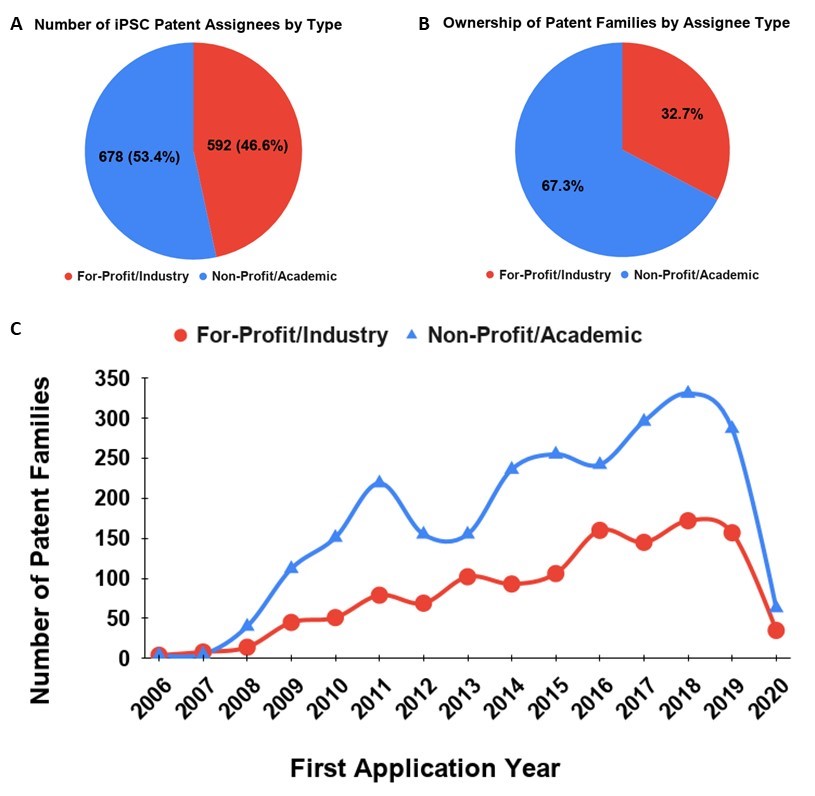
Figure 2. A) Unique iPSC patent assignees categorized by institution type as either “Non-Profit/Academic” or “For-Profit/Industry”. 100% = 1,270 unique assignees. B) IPSC patent families sorted by assignee institution type. 100% = 3,791 total patent families. n > 3,370 due to jointly-held patent families. C) IPSC patent families plotted by first application date, categorized by assignee institution type.
Figure 2B groups patent families based on the categorization of their assignees. The 678 combined “Non-Profit/Academic” institutions held a total of 2,551 iPSC patents (67.3%). The “For-Profit/Industry” assignees held 1,240 iPSC patents (32.7%).
The trends of assignees over time are shown in Figure 2C. While the number of iPSC patents held by for-profit companies has grown steadily since 2006, with gradual rises and falls, the “Non-Profit/Academic” sector has fluctuated more, with larger rises and falls. Like with the results in Figures 1A and C, the number of patents filed by both types of institutions dropped in 2012.
3.4 iPSC Inventors Results:
The top inventors in iPSC patents are shown in Table 2. Shinya Yamanaka, the original developer of iPSCs, still holds the most patent families. Yamanaka has ten more patents than the next highest inventor, Lorenz Studer.
Table 2. Top ten inventors listed on iPSC patents.
| Inventor | Number of Patent Families |
| YAMANAKA, SHINYA | 38 |
| STUDER, LORENZ | 28 |
| LUNDBERG, ANTE SVEN | 27 |
| PEI, DUANQING | 25 |
| KIM, DONG WOOK | 22 |
| DENG, HONGKUI | 18 |
| JUNG, WON JU | 18 |
| KIM, HO BIN | 18 |
| LEE, KYE HO | 18 |
| LEE, SANG YEON | 18 |
3.5 Impactful iPSC Patents:
Shinya Yamanaka’s original 2006 iPSC patent, “Nuclear Reprogramming Factor”, also has the most forward citations of any iPSC technology patents, as shown in Table 3, with 206. Of the five most-cited patents, three come from Kyoto University. With regards to application jurisdictions, four of the five were filed in the EPO, while one was filed in the United States.
Table 3. Most cited iPSC patent families, listed alongside patent number, title, filing date, inventor, and assignee.
| Patent
Number |
Title | File Date | Inventors | Assignee | No. of Forward Citations |
| EP2206724 | Nuclear reprogramming factor | 2006-12-06 | S. YAMANAKA | KYOTO UNIVERSITY | 206 |
| EP2213727 | Human pluripotent stem cells induced from undifferentiated stem cells derived from a human postnatal tissue | 2007-06-15 | K. SAKURADA, T. ISHIKAWA, H. MASAKI, S. TAKAHASHI | KYOTO UNIVERSITY, BAYER SCHERING PHARMA, IPIERIAN, IZUMI BIO | 125 |
| EP2137296 | Somatic cell reprogramming | 2008-03-21 | J. THOMSON, J. YU, | WISCONSIN ALUMNI RESEARCH FOUNDATION | 70 |
| US20090227032 | Nuclear reprogramming factor and induced pluripotent stem cells | 2008-11-06 | S. YAMANAKA, K. TAKAHASHI, M. NAKAGAWA | KYOTO UNIVERSITY | 64 |
| EP3597749 | Methods and compositions for rna-directed target dna modification and for rna-directed modulation of transcription | 2013-03-15 | E. CHARPENTIER, M. JINEK, CJH. DOUDNA, W. LIM, L. QI, K. CHYLINSKI, JA. DOUDNA | UNIVERSITAET WIEN, UNIVERSITY OF CALIFORNIA | 59 |
DISCUSSION.
In general, iPSC-related patents have continued to grow as iPSCs further develop as a multi-faceted tool for regenerative medicine. The 1:1 ratio between granted and pending patents suggests that new iPSC patents are continuing to be filed.
The United States is the leading patenting geographical location for iPSC technologies. The EPO, China, Japan, and the Republic of Korea are all also significant patenting locations in this field. In short, the top ten national jurisdictions shown in Figure 1B account for around 84.8% of all iPSC patents filed since 2006, indicating these as the top ten commercial markets for iPSC-based technologies. The drop in 2012 of new iPSC patents in all major countries were similar to the findings in Morita et al (4).
The University of California has the most iPSC patents, more even than Kyoto University, where Shinya Yamanaka first developed iPSCs in 2006. Kyoto University still holds the most granted iPSC patents, but the University of California has more patents pending. This may suggest that the University of California, and therefore US iPSC technologies, are starting to outpace those in other countries.
Although non-profit organizations and academic institutions only make up 53.4% of the total assignees, they hold around 67.3% of the iPSC patents. This may be, in part, due to the fact that iPSC technologies are still new and upcoming. However, for-profit organizations and industries have had more steady growth in this space than the non-profits.
Of the top twenty assignees, only one was a for-profit organization. This may be typical, since universities and non-profit research agencies have led the innovation in iPSCs in its early stages. Industry partners collaborate and license the patents from those institutions and then build on those to create new technologies.
One limitation of this study is that it does not include information about the data related to commercialization activities. Specifically, there wasn’t sufficient information in Orbit regarding the licensing of academic iPSC patents to for-profit organizations for commercialization. Similarly, limited information was available on the specific iPSC patents that resulted in marketable technologies.
Future studies could further explore data on the types of inventive domains protected by iPSC patents. For example, one could further this study by analyzing preparation technologies and differentiation methods used in iPSC patents.
CONCLUSION.
The steady growth of iPSC technologies has continued over the last decade, a span of time during which only a few comprehensive patent landscapes have been conducted. The trends suggest that iPSC patents are still most active in the United States, Europe, and East Asia. Non-profit organizations still continue to hold a narrow edge over industries with regard to iPSC patenting. It will be interesting to see if a drop in new patenting will occur due to initial research shutdowns caused by the COVID-19 pandemic, or whether the increased vaccine and therapeutic research will cause iPSC patents to rise precipitously over the next few years.
ACKNOWLEDGMENTS.
I would like to thank Dr. Jonathan Brunger for warmly welcoming me into his lab and providing invaluable guidance throughout the research process, Dr. Nathan Haag for his immensely helpful advice and suggestions from start to finish, and Questel SAS for providing a limited-time usage license for Orbit Intelligence.
REFERENCES.
- A. E. Omole, A. O. J. Fakoya, Ten years of progress and promise of induced pluripotent stem cells: Historical origins, characteristics, mechanisms, limitations, and potential applications. PeerJ. 6, 2–47 (2018).
- B. Lo, L. Parham, Ethical issues in stem cell research. Endocr. Rev. 30 (2009), pp. 204–213.
- D. Tuveson, H. Clevers, Cancer modeling meets human organoid technology. Science (80-. ). 364 (2019), pp. 952–955.
- Y. Morita, H. Okura, A. Matsuyama, Patent application trends of induced pluripotent stem cell technologies in the United States, Japanese, and European applications. Biores. Open Access. 8 (2019), pp. 45–58.
- M. Roberts, I. B. Wall, I. Bingham, D. Icely, B. Reeve, K. Bure, A. French, D. A. Brindley, The global intellectual property landscape of induced pluripotent stem cell technologies. Nat. Biotechnol. 32, 742–748 (2014).
- B. P. Georgieva, J. M. Love, Human induced pluripotent stem cells: A review of the US patent landscape. Regen. Med. 5 (2010), pp. 581–591.
- B. M. Simon, C. E. Murdoch, C. T. Scott, Pluripotent patents make prime time: An analysis of the emerging landscape. Nat. Biotechnol. 28 (2010), pp. 557–559.
- K. T. Vrtovec, C. T. Scott, Patenting pluripotence: The next battle for stem cell intellectual property. Nat. Biotechnol. 26 (2008), pp. 393–395.
- Questel Orbit Intelligence Patent Search Tool, orbit.com (2020).
- Operators. static.orbit.com (2020).
- K. Takahashi, S. Yamanaka, Induction of Pluripotent Stem Cells from Mouse Embryonic and Adult Fibroblast Cultures by Defined Factors. Cell. 126, 663–676 (2006).
- General Information Concerning Patents. uspto.gov (2015).
- How to apply for a European patent. epo.org (2020).

Posted by John Lee on Thursday, May 20, 2021 in May 2021.
Tags: induced pluripotent stem cells, Intellectual Property, iPSC, Patent Landscape