Evaluating the Affinity of Tumor-Specific and Self-Specific CD8+ T Cells in a Liver Cancer Mouse Model
ABSTRACT
CD8+ T cells are vital to our immune response, as they can kill cancerous cells after binding to an antigen, a protein fragment or peptide presented by a target cell that is recognized by a T cell receptor. CD8+ T cells specific to cancerous cells become dysfunctional rapidly after encountering their antigen in a premalignant cancer environment, stopping them from destroying cancer cells. This dysfunction could arise as a result of self-tolerance, the mechanism preventing self-specific T (SST) cells from killing healthy cells. However, we have previously found that self-specific T cells and tumor-specific T (TST) cells undergo different forms of unresponsiveness [3]. We hypothesized these distinct forms are due to differences in affinity, or the strength of the bonds formed between T cells and their antigen. We compared the affinity of SST cells to TST cells by stimulating both with increasing concentrations of their antigens in vitro. After examining the cells’ proliferation and cytokine production, we found that TST cells outperformed the SST cells. Thus, TST and SST cells do have a difference in affinity for their antigens. Future research is needed to look at other potential causes of the difference in self-specific and tumor-specific T cells so that better therapies can be designed to help cancer patients.
INTRODUCTION.
Cancer is a deadly disease, characterized by the uncontrollable division of damaged cells that invade and destroy neighboring tissues, that impacts the lives of millions. As the second leading cause of death in the U.S., cancer is responsible for 144.1 deaths per 100,000 people [1]. As cancer cells replicate, they begin to form solid masses of tissue called tumors.
Our immune system plays a role in fighting cancer, as our bodies have cytotoxic cells called CD8+ T cells that can recognize and eliminate tumors. CD8+ T cells respond to antigens, which are proteins presented on the surface of cancerous cells. The T cell receptor (TCR) of the T cell binds with the major histocompatibility complex (MHC) molecules presented by either an antigen-presenting cell (APC) or a cancer cell. This process of antigen recognition allows for the release of cytokines that lyse and ultimately kill the cancer cell. There are a variety of TCRs, each of which are specific to a single antigen. Previous research has shown that CD8+ T cells specific to tumors become dysfunctional in premalignant cancer environments after encountering their antigen [2]. This dysfunction prevents the T cells from eliminating the cancer cells and allows for further tumor growth.
Cells produce self-antigens, which are markers that help the immune system identify cells as native to the body. Self-tolerance is our immune system’s ability to recognize self-antigens and therefore prevent the killing of our own healthy cells. It has been hypothesized that the dysfunction seen in tumor-specific T (TST) cells could be a form of self-tolerance because cancer cells are derived from our own cells. However, this has been shown to not be the case through the examination of the difference in proliferation between self- and tumor-specific T cells in response to an antigen [3]. A possible explanation for the difference in the immune response to tumor-antigens and self-antigens by CD8+ T cells could be the cells’ affinity or ability to bind to their target antigen. A T cell’s affinity to an antigen is responsible for the magnitude of the T cell’s cytotoxic response, as low-affinity T cells have been shown to be unable to induce the killing of cancer cells [4].
In this study, the affinities of tumor-specific and self-specific CD8+ T cells were compared to determine if a difference existed between the two types of T cells. It was hypothesized that the self-specific T cells would exhibit a lower level of affinity because they have been shown to undergo limited proliferation in the liver after being stimulated when compared to tumor-specific T cells [2]. By further pinpointing the cause of CD8+ T cell dysfunction in the presence of tumors, we can learn how to reactivate these T cells and develop powerful therapies to help cancer patients.
MATERIALS AND METHODS.
Mice. All mice were bred and maintained in a specific pathogen free barrier facility at Vanderbilt University Medical Center. Experiments were performed in compliance with the Institutional Animal Care and Use Committee regulations.
Mice were age- and sex-matched, between 6 and 12 weeks old when used for experiments and assigned randomly to experimental groups.
Both female and male mice were used. TCRGAG transgenic mice have been previously described [1]. TCRTAG transgenic mice (Stock No 005236) were purchased from The Jackson Laboratory. All mice were euthanized by cervical dislocation and sterile technique was used to remove spleens.
Splenocyte isolation. The back of a 3mL syringe plunger was used to mechanically disrupt the spleens to a single-cell suspension. The cells then passed through a 70 μm strainer and were lysed with 1x ammonium chloride potassium (ACK) buffer. The splenocytes remaining were washed with Roswell Park Memorial Institute (RPMI) media supplemented with 10% fetal calf serum (FCS).
T cell stimulation. Splenocytes from a transgenic TCR mouse were isolated as described above. 300,000 splenocytes suspended in 100 μL of cRPMI (RPMI supplemented with 10% FCS, 1% NEAA, 1% sodium pyruvate, 1% HEPES, 1x β-mercaptoethanol) were added to a 96 well plate. A peptide stimulation media in cRPMI was made at a concentration of 100µM and serially diluted to 0.01µM. One group was utilized as a control and not given any peptide stimulation. All wells were incubated at 37°C for 60-72 hours.
Surface receptor and intracellular cytokine staining. 100 µL of a surface antibody mixture for the receptors CD8, CD90.1, CD69, CD44, and CD62L were diluted in phosphate-buffered saline with 2% FCS and without Ca2+ and Mg2+ (PBSA) and added to each well. The cells then incubated at 4°C for 15 minutes before any unbound antibodies were washed with PBSA. Cells were fixed with FoxP3 Fix/Perm kit (Tonbo) per manufacturer’s instructions. 100 µL of a stain media for the intracellular cytokines interferon-gamma (IFN-γ) and tumor necrosis factor alpha (TNF-α) were added to each well and incubated at 4°C for 20 minutes. Any unbounded dye was washed with PBSA.
Proliferation assessment. 5 µM of Carboxyfluorescein succinimidyl ester (CFSE) was added to the splenocytes and incubated at 37oC for 5 minutes to examine T cell proliferation. Any unbounded dye was quenched with FCS, and cells were washed prior to the experiment.
Flow cytometric analysis. T cell analysis was performed using an Attune NxT Acoustic Focusing Cytometer (ThermoFisher). The data collected from the flow cytometer was then analyzed with FlowJo v.10 software (Tree Star Inc.).
RESULTS.
Analysis of CFSE dilution in both tumor-specific and self-specific T cells showed that tumor-specific T cells were stimulated at low concentrations of peptide (0.01 nM) while self-specific T cells were not stimulated until a concentration of 10 nM (Fig. 1A). Thus, SST cells require a greater amount of peptide stimulation to begin proliferating. However, CFSE dilution increases for both groups as peptide concentration is increased (Fig. 1A, 1B, and 1C).
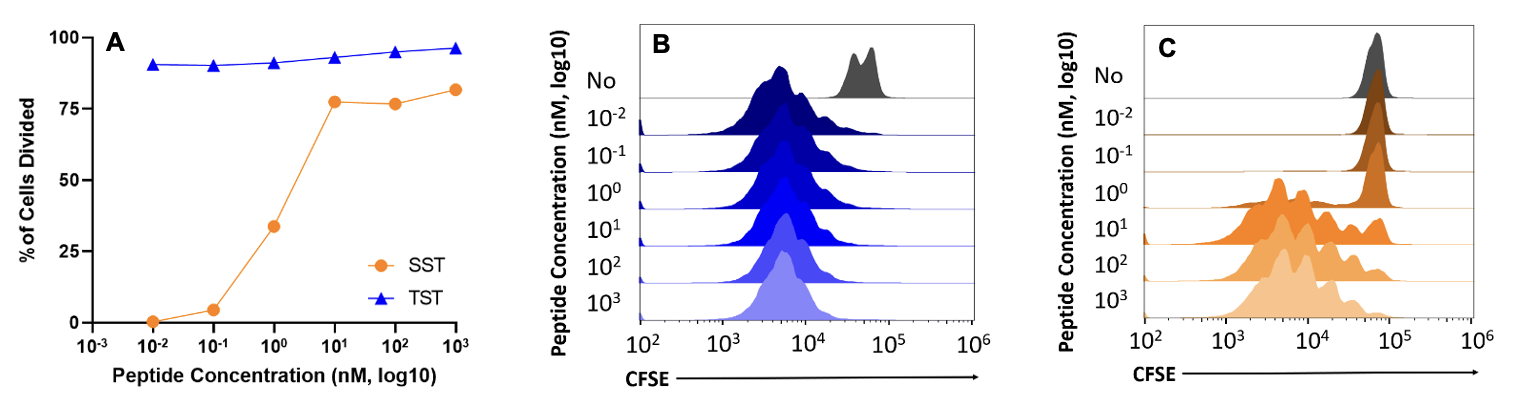
Figure 1. A) Scatter plot showing the increase in the percentage of cells divided in SST (orange) and TST (blue) groups. B) Plot showing cell proliferation tracked through CFSE dilution in TST cells. C) Plot showing cell proliferation tracked through CFSE dilution in SST cells. Naïve T cell populations are marked in gray. n=1 per group. Data representative of at least three independent experiments.
CD69 and CD44 receptors were increased in self-specific T cells in peptide concentrations higher than 1 nM (Fig. 2A, 2C, 2D, and 2F) but were increased in the tumor-specific group at every tested concentration except the no stimulation group (Fig. 2A, 2B, 2D, and 2E).
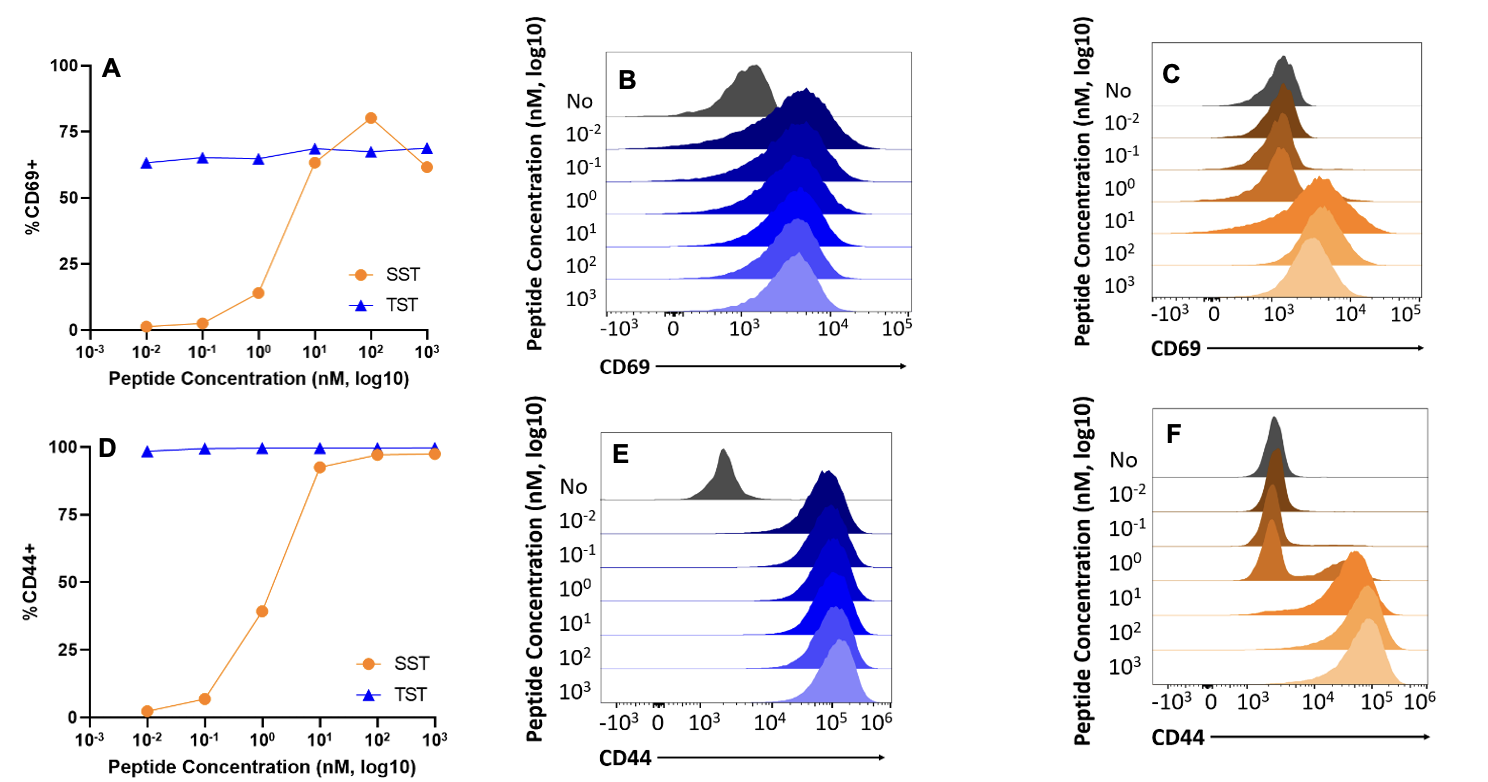
Figure 2. Surface receptor up and downregulation in SST and TST cells. A) Scatter plot showing CD69 expression increase in SST (orange) and TST (blue) cells as peptide concentration increases. B) Plot of CD69 expression in TST cells across increasing peptide concentrations. C) Plot of CD69 expression in SST cells across increasing peptide concentrations. D) Scatter plot showing CD44 expression in SST and TST cells increase as peptide concentration increases. E) Plot of CD44 expression in TST cells across increasing peptide concentrations. F) Plot of CD44 expression in SST cells across increasing peptide concentrations. n=1 per group. Data representative of at least three independent experiments.
Flow cytometric analysis shows that the production of IFNγ and TNFα did not occur in peptide concentrations 0.01 – 1 nM for self-specific T cells (Fig. 3A and 3D) while it did for tumor-specific T cells (Fig. 3A and 3B). Cytokine production was also much greater in TST cells at the concentrations 10 – 1000 nM, despite the fact that SST cells were also activated (Fig. 3A, 3C, and 3F).
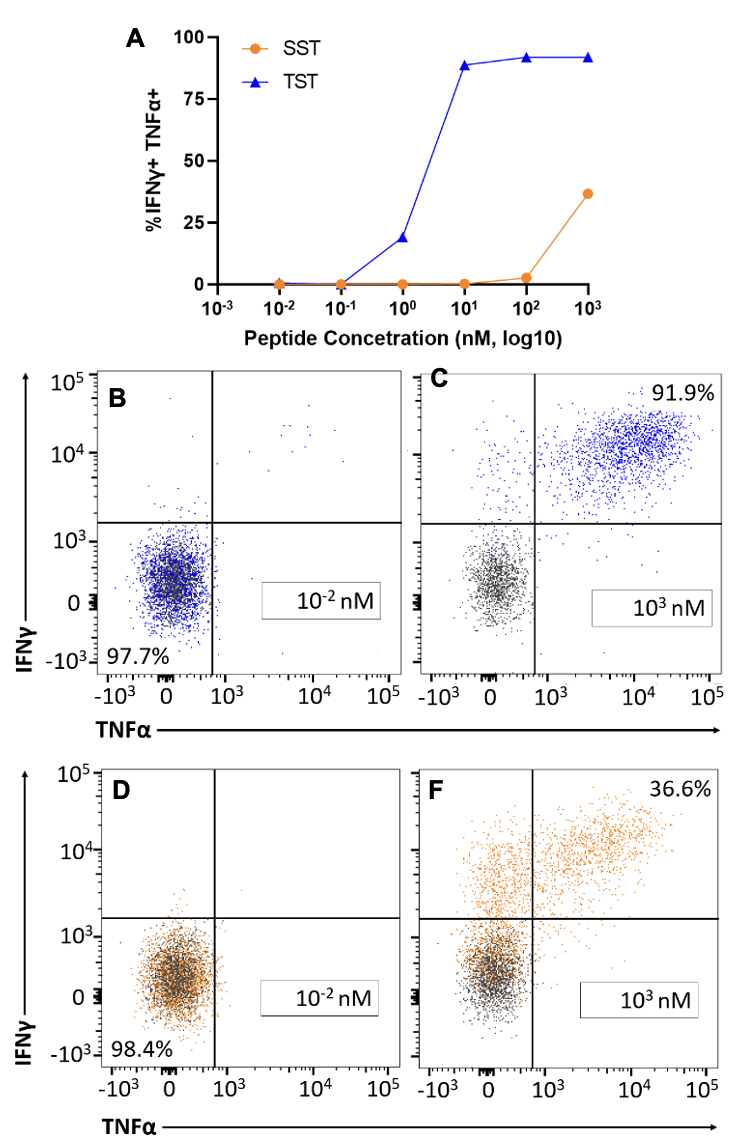
Figure 3. IFNγ and TNFα production in tumor- and self-specific T cells. A) Scatter plot showing cytokine production in SST (orange) and TST (blue) cells stimulated with peptide concentrations 0.01 and 1000 nM. B) Plot showing number of TST cells double negative for IFNγ and TNFα at a peptide concentration of 0.01 nM. C) Plot showing number of TST cells double positive for IFNγ and TNFα at a peptide concentration of 1000 nM. D) Plot showing number of SST cells double negative for IFNγ and TNFα at a peptide concentration of 0.01. F) Plot showing number of cells double positive for IFNγ and TNFα at a peptide concentration of 1000 nM. Naïve population marked in gray. n=1 per group. Data representative of at least three independent experiments.
DISCUSSION.
Our study examined the role that T cell affinity plays in the activation and proliferation of tumor- and self-specific CD8+ T cells. Through the analysis of cell proliferation, cytokine production, and surface receptor regulation in SST and TST cells, we determined that there was a difference in affinity between the two types of CD8+ T cells. The SST cells remained inactive when stimulated by peptide concentrations lower than 10 nM (Fig. 1A, 2A, 2D and 3A) while the TST cells responded to peptide concentrations as low as 0.01 nM (Fig. 1A, 2A, 2D, and 3A). The TST cells also attained a greater level of activation than the SST cells’, as the percentage of IFNγ and TNFα present in the TST cells was about 2.5x larger than the SST cells, at the highest peptide concentration, 1000 nM.
Thus, we concluded that T cell affinity influences the downstream signaling of TST cells that affect proliferation and persistence in tumor environments. The persistence of T cells is crucial to the effective elimination of cancer cells. Given their activation in high and low levels of stimulation, TST cells are not hindered by their affinity to antigens. Therefore, the cause of their dysfunction in premalignant cancer environments is likely unrelated to their ability to bind to cancer antigens. On the other hand, SST cells do appear to be hindered by their affinity, thus strengthening the claim that TST cell dysfunction does not arise as a form of self-tolerance which is seen in SST cells.
This study utilized one TST and SST cell liver cancer mouse model, so other tumor mouse models are needed to further bolster the conclusions drawn from this study. There are other tumor-antigens and self-antigens outside of the liver and spleen that can be tested to determine if the evidence gathered from this study is consistent throughout different organs. However, these models have been used in previous studies and have produced reliable results [2,3]. Future studies on the downstream signaling pathway that impacts TST cell proliferation and persistence are needed to understand the dysfunction of TST cells in tumors. The study of SST and TST cell dysfunction could also potentially aid in the development of immunotherapies that target the dominant antigen type, self- or tumor-antigen, found in patient tumors. If we can determine which antigen type is present in greater counts than the other, we can determine if self- or tumor-specific T cells are persisting to respond to immunotherapies.
ACKNOWLEDGMENTS.
I would like to acknowledge the help provided by my mentor, Jess Roetman, and PI, Dr. Mary Philip. I would also like to express my gratitude towards my advisor, Dr. Menton Deweese.
REFERENCES
- S. Murphy, K. D. Kochanek, J. Xu, and E. Arias, Mortality in the United States. National Center for Health Statistics 456, 1-7 (2021).
- A. Schietinger, M. Philip, V. E. Krisnawan, E. Y. Chiu, J. J. Delrow, R. S. Basom, P. Lauer, D. G. Brockstedt, S. E. Knoblaugh, et al., Tumor-specific T cell dysfunction is a dynamic antigen-driven differentiation program initiated early during tumorigenesis. Immunity 45(2), 389-401 (2016).
- J. Roetman, et al., CD8 T cell tolerance to self-antigen is distinct from CD8 T cell dysfunction to tumor-specific neoantigens. Cancer Immunology Research in revision (2023).
- M. Shakiba, P. Zumbo, G. Espinosa-Carrasco, L. Menocal, F. Dundar, S. E. Carson, E. M. Bruno, F. J. Sanchez-Rivera, S. W. Lowe, S. Camara, et al., TCR signal strength defines distinct mechanisms for T cell dysfunction and cancer evasion. Journal of Experimental Medicine 219(2), e20201966 (2021).

Posted by John Lee on Tuesday, May 30, 2023 in May 2023.
Tags: cancer, CD8+, Immunology