Cognitive, Genetic, and Lifestyle Synergy: A Machine Learning Approach to Alzheimer’s Diagnosis
ABSTRACT
Alzheimer’s disease (AD), a major public health concern characterized by memory loss and cognitive decline, demands innovative strategies for both diagnosis and treatment. This study leverages machine learning (ML) techniques to explore the gene expression patterns in AD, while analyzing the predictive ability of lifestyle, genetic and clinical data. Using ML framework, patient lifestyle information, clinical data and gene expression profiles data were examined. The findings demonstrate the effectiveness of K-means clustering in uncovering distinct gene clusters based on expression patterns to find the one associated with AD, presenting potential biomarkers for diagnosis and HSP as target for therapeutic intervention. The study highlights a significant role of lifestyle factors in modulating AD risk. Cognitive assessments, such as the Mini-Mental State Examination (MMSE) and handwriting analysis, further supports the validity of these measures as diagnostic tools. The results underscore the complex interplay between genetic, behavioral, and cognitive factors in influencing the progression and manifestation of AD and offer a three-step validation for diagnosing AD. By integrating data from multiple sources, this research enhances our understanding of the disease and offers potential applications for personalized therapies and improved diagnostic accuracy bridging ML applications with biological research through a multidisciplinary approach.
INTRODUCTION.
AD is the most prevalent form of dementia, a devastating neurodegenerative disorder (ND) that affects millions of people worldwide. It typically begins slowly, affecting memory and eventually causing difficulties with comprehending language, mood swings and disorientation 1. While the precise cause of AD remains elusive, genetic mutations, environmental influences, and lifestyle factors are all considered contributors, with amyloid-beta plaques and tau protein tangles playing a significant role in disease pathology. Current diagnostic methods are based on cognitive testing and medical imaging. No cures for the disease currently exist, hence managing symptoms and maintaining quality of life are topmost priorities for reducing the damage 2. In the past few years, the number of cases of AD have increased rapidly, with approximately 50 million global patients. Projections indicate that the number of new AD cases could possibly double every five years, reaching about 152 million cases by 2050, displaying the immense societal impact 3.
Past research studies have shown an important role of certain biomolecules in AD initiation and progression. Heat Shock Proteins (HSPs), essential for cellular health, have been found to play a pivotal role in NDs like AD which makes them a critical point to be studied in AD patients. One of their primary functions is acting as molecular chaperones, assisting in protein folding and preventing the harmful aggregation of proteins, such as the misfolded amyloid-beta peptides central to AD pathology 4. Hsp70 amongst other HSPs plays a significant role in AD by influencing the Amyloid-beta (Aβ) peptides and mediating the transcriptional activation of genes involved in AD 5.
Studies regarding both AD and its biomarkers using ML have been gaining popularity, as ML proves to be a way to efficiently interpret and analyze vast, complex biological data. For instance, AD and ML have been integrating on a study by Jinwei Li and her colleagues, where they identified diagnostic genes for AD which could act as biomarkers in identifying the disease, upon which a subarray of genes were selected which had the highest accuracy in identifying AD. Following this, a risk score of a patient being infected by AD was calculated using the levels of the selected diagnostic genes 6. This shows the scope of ML in medical fields and displays how it can be used in various studies regarding AD and its biomarkers.
Although numerous studies have explored the roles of several biomarkers in NDs, and others have employed machine learning in AD biomarker discovery, no research to date has directly integrated ML to provide the multi-level validated diagnosis for AD. This gap highlights the need for novel approaches that combine these fields to better understand the AD diagnosis. Thus, in this study, the use of ML by combining lifestyle factors in modulating AD risk, cognitive assessments, such as MMSE and handwriting analysis, has been made to support the validity of these measures as diagnostic tools. This will allow analyzing complex biological data in an efficient manner to provide more accurate results and possibly provide methods to improve AD diagnosis.
MATERIALS AND METHODS.
Data Collection and preprocessing.
The data used for the study was primarily from Kaggle. Dataset 1 (alzheimers_disease_data)7 contained 32 features regarding lifestyle choices of 2149 patients, and a final target column with AD and non-AD. Dataset 2 (Alzheimer’s Clinical Data’) 8 had clinical information from 1229 patients, with 5 features and a target variable column with ‘No Dementia’, ‘Uncertain Dementia’ and ‘AD Dementia’ individuals. Dataset 3 (Handwriting Data) 9 consisted of data from 174 patients, with more than 252 handwriting related features such as pressure applied on paper, air time, etc. for AD and non-AD individuals. Major changes in handwriting style can be a sign of dementia related diseases. This is because writing involves the brain and motor control, which can easily be affected even during the early-stages of dementia. Dataset was an unlabeled dataset of Alzheimer’s Gene Expression Profiles 10 used in order to retrieve gene related data of the disease that had the levels of different genes in four patient samples, two with AD and other two samples with Parkinson’s Disease (PD). The specifications of each dataset are given in Table 1. After data collection preprocessing was done where Quadratic Interpolation was done to replace the missing data points in Dataset 2. Standard scaling was used for feature scaling of the datasets.
| Table 1. Information on all the datasets used for the study. | ||||
| Name | Dataset | Data Samples | No. of Features | No. of Target Variables |
| Alzheimers_disease_data | 1 | 2149 | 32 | 2 |
| Alzheimer’s Clinical Data | 2 | 1229 | 5 | 3 |
| Handwriting Data | 3 | 174 | 252 | 2 |
| Alzheimer’s Gene Expression Profiles | 4 | 45118 | 8 | 0 |
Feature Engineering and Data Augmentation.
The feature engineering step helped in boosting the accuracy for each of the models used on the datasets. The feature engineering consisted of using various feature selection methods on Datasets 1 and 3. Principal Component Analysis (PCA), Least Absolute Shrinkage and Selection Operator (LASSO) Regularization, and Recursive Feature Elimination (RFE) were used as the selection methods. Dataset 1 showed the best results with RFE, and LASSO Regularization brought out the best results for Dataset 3. Data Augmentation using Synthetic Minority Oversampling Technique (SMOTE) was used for Dataset 2 because this dataset was highly imbalanced.
Model Training and Development.
The Python programming language version 3.11.4 was used to run the models. On datasets 1, 2 and 3 supervised classification models were trained, which included Extreme Gradient Boosting (XGBoost), Random Forest, Support Vector Machine (SVM), Logistic Regression, K-Nearest Neighbours (KNN), Naive Bayes and Adaptive Boosting (AdaBoost) using scikit-learn library. For all supervised models, train-test split from sklearn was used to split the dataset into 70 % training and 30% testing data. Cross Validation was also used in all of the supervised learning models to avoid bias and overfitting. Hyperparameter tuning was applied using sklearn’s GridSearchCV to find the best set of hyperparameters and to optimize the performance of the model. Deep Neural Networks (DNN) were made on Dataset 1 and 2 using TensorFlow framework. 2 Hidden Layers had been used for each dataset, and the activation function used for this was Rectified Linear Unit (ReLU). The first hidden layer had 64 neurons, the second one had 32. For Dataset 1 DNN the Sigmoid activation function was used, as the output consisted of two layers. Binary Cross Entropy was used as the Loss Function for this dataset. For Dataset 2 SoftMax activation function was used and was run with Sparse Categorical Cross Entropy Loss function, as it was a multiclass classification. Unsupervised learning algorithms were applied on Dataset 4, as this dataset had no target variables. Two unsupervised clustering models were run, Density Based Spatial Clustering for Applications with Noise (DBSCAN) and K-Means Clustering using sklearn with making 3 clusters, to find the gene clusters in the patients with AD and PD and with No Dementia.
Model Evaluation.
Every model was evaluated on multiple evaluation metrics to ensure the robustness of the models and select the best model for each dataset. For the supervised learning models on Datasets 1, 2 and 3, the overall Accuracy, Precision, Recall, F1 Score, Area Under Curve (AUC) score and Receiver Operating Characteristics (ROC) curve were all used to evaluate the models. For the dataset 4 different evaluation scores Silhouette Score, Davies-Bouldin Index and Calinski Harabasz Index were used. These indices help in giving the relation of objects with their own cluster as well as measure the ratio of the sum between cluster dispersion and of within-cluster dispersion.
RESULTS.
This section presents the results obtained from the supervised and unsupervised machine learning models as well as deep learning algorithms applied to different datasets. Dataset 1 focused on identifying AD in different patients based on their lifestyle choices and corresponding scores. RFE gave the best results on the dataset by choosing 18 best features out of 32. From 7 ML models that were trained, XGBoost model gave the best results, with an overall accuracy of 95.35%, with the precision, recall, F1 score and AUC-ROC being 95.34%, 95.35%, 95.33% and 95.47% respectively. The ROC-AUC curve of the models trained on Dataset 1 is shown in Fig 1. The ROC-AUC curve is a crucial measure of the classification performance of machine learning models, illustrating the trade-off between sensitivity (recall) and specificity across different thresholds. A higher AUC-ROC score signifies a model’s ability to distinguish between AD and non-AD patients effectively. Among the models tested on Dataset 1, XGBoost performed the best, achieving an AUC-ROC of 95.47%, indicating strong discriminatory power. This suggests that XGBoost is highly reliable for classifying individuals based on their lifestyle-related risk factors, making it a potential candidate for early screening and risk assessment of AD. Table 2 lists down the results of each evaluation measure for every ML model. The DNN model trained on this dataset gave an overall accuracy of 78.91%, with the precision, recall, F1 score and AUC-ROC being 77.90%, 76.54%, 77.07% and 85.17% respectively.

| Table 2. Evaluation metrics of each ML Model on Dataset 1 | |||||
| Model’s Name | Accuracy | Precision | Recall | F1 Score | AUC-ROC Score |
| KNN | 82.95% | 82.74% | 82.95% | 82.75% | 88.16% |
| SVM | 87.75% | 87.66% | 87.75% | 87.67% | 92.66% |
| Logistic Regression | 84.85% | 84.58% | 84.65% | 84.30% | 89.81% |
| Naive Bayes | 79.84% | 79.97% | 79.94% | 79.90% | 87.33% |
| Random Forest | 95.04% | 95.03% | 95.04% | 95.02% | 94.38% |
| XGBoost | 95.35% | 95.34% | 95.35% | 95.33% | 95.47% |
| AdaBoost | 93.33% | 93.40% | 93.33% | 93.36% | 94.10% |
Both the datasets, Dataset 2 and 3 were related to cognitive behavior. Dataset 2 focused on classifying between ‘No Dementia’, ‘Uncertain Dementia’ and ‘AD Dementia’ individuals with the help of 5 features which included a Mini-Mental State Examination (MMSE) score, as well as other important medical data. The correlation between different features of this dataset 2 is shown in Fig S1. Both the datasets directly correlate with the cognitive scores of a patient. For dataset 3, from feature selection, the LASSO method gave the best results with 94 selected features out of 252. From 7 different ML models, the best results on Dataset 2 was obtained from using Random Forest, with an overall accuracy of 90.94%, and the precision, recall, F1 score and AUC-ROC being 90.99%, 90.94%, 90.93% and 97.09% respectively. Evaluation metrics of all the models trained on Dataset 2 and 3 are shown in Table S1 and Table S2, respectively.
The ROC-AUC curve of the models trained on Dataset 2 is shown in Fig 2. For Dataset 3, the best result was achieved by XGBoost, with an overall accuracy of 86.79%, and the precision, recall, F1 score and AUC-ROC being 89.51%, 86.79%, 86.52% and 91.45% respectively. The ROC-AUC curve of the models trained on Dataset 1 is shown in Fig 4. The DNN model run on Dataset 2 gave an overall accuracy of 85.69%, with the precision, recall, F1 score and AUC-ROC being 87.02%, 85.73%, 85.53% and 95.30% respectively.

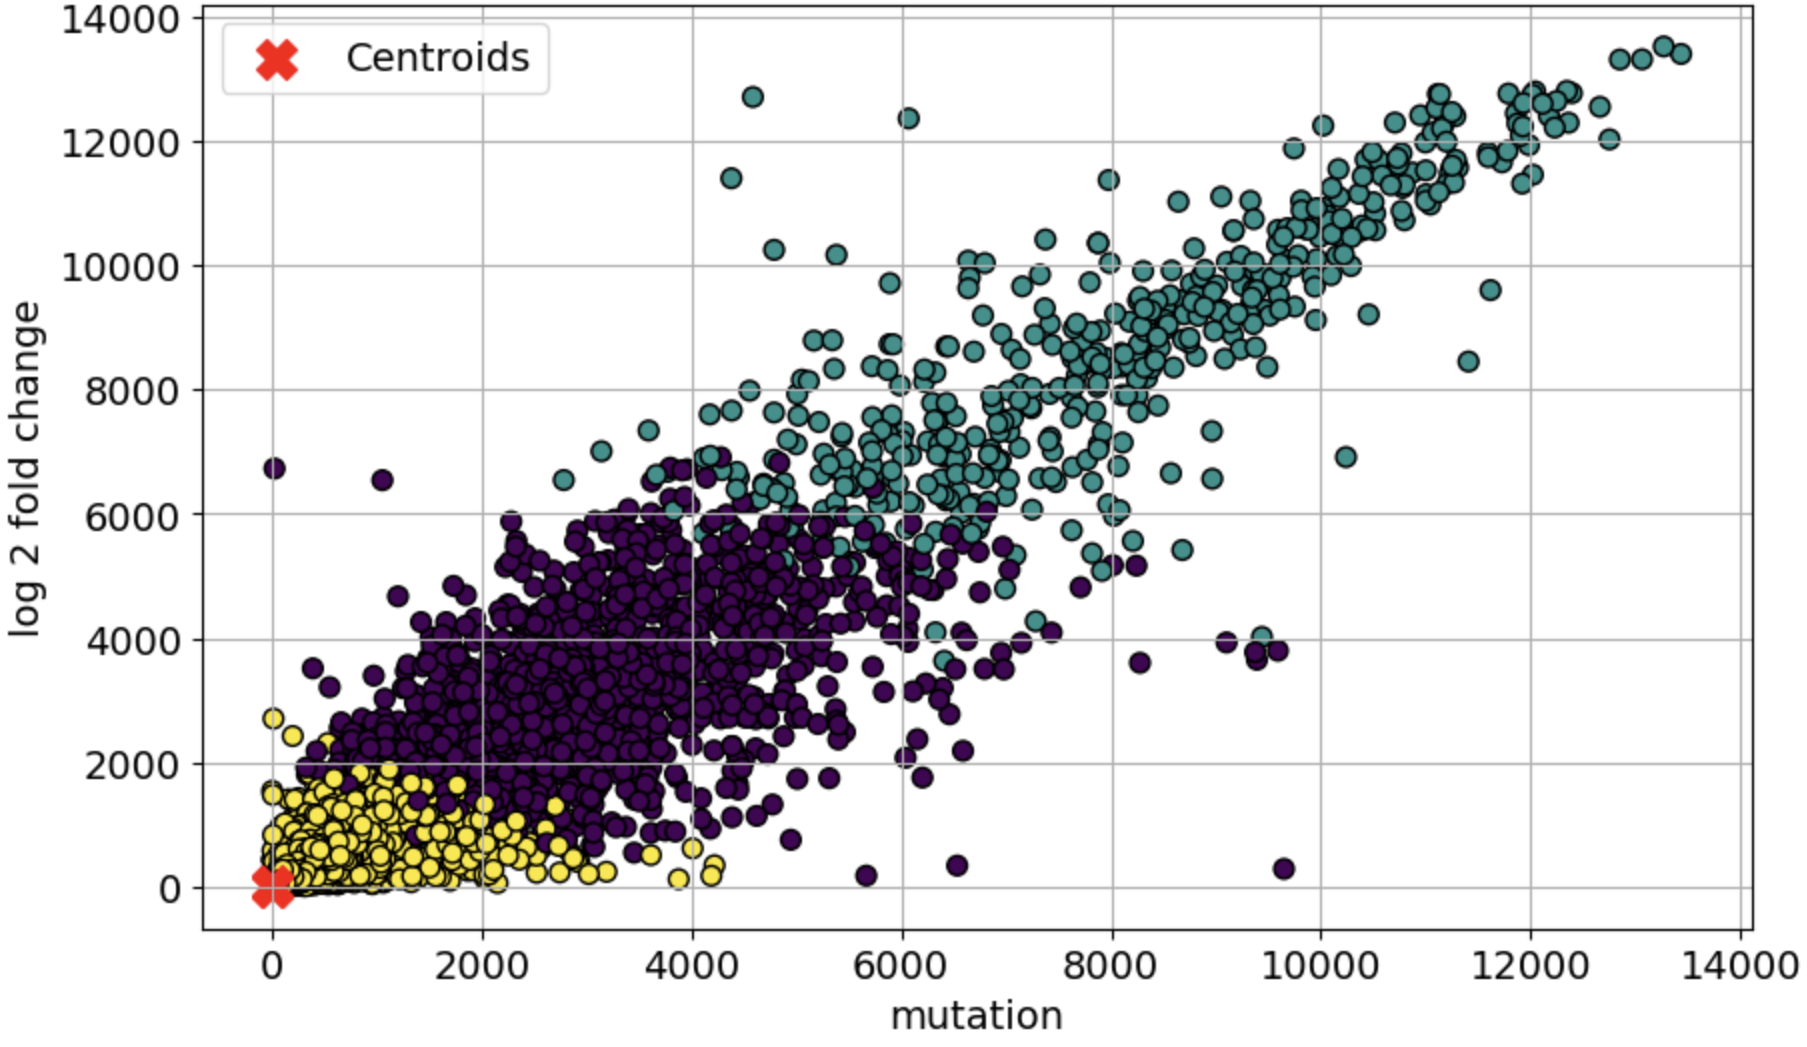
Dataset 4 focused on identifying the cluster of genes which are differentially expressed and specifically associated with the neurodegenerative disorders due to AD. Standard scaling was chosen before running the unsupervised models. A total of 2 clustering models were used on the dataset, K-means Clustering and Density-Based Spatial Clustering of Application with Noise (DBSCAN). The best results were achieved with the K-Means clustering algorithm. The three different clusters made by the algorithm are shown in Fig 3. Table 3 shows the results of the clustering models, for several evaluation metrics such as Silhouette Score, Davies-Bouldin Score, and Calinski-Harabasz Score; some of the evaluation methods which are commonly used in the case of clustering models. The clustering analysis identified distinct gene expression patterns in AD, with K-Means achieving the best results (Silhouette Score: 0.716, Davies-Bouldin Score: 0.5825, Calinski-Harabasz Score: 38484.933), indicating well-separated and biologically meaningful clusters. Among them, Cluster 3 emerged as AD-specific, containing HSP90, a key gene involved in neuroprotection. Pathway analysis further confirmed its relevance, highlighting “HSP90 chaperone cycle” and “Regulation of HSF1-mediated heat shock response” as significant pathways in AD. While DBSCAN had a slightly higher Silhouette Score (0.750), its lower Calinski-Harabasz Score (1343.7857) suggests that K-Means provided more robust biological insights, emphasizing the importance of selecting the right clustering method in bioinformatics-driven disease research.
| Table 3. Evaluation scores of Clustering Models on Dataset 4 | |||
| Silhouette Score | Davies-Bouldin Score | Calinski-Harabasz Score | |
| 0.716 | 0.5825 | 38484.933 | |
| 0.750 | 1.0919 | 1343.7857 | |
DISCUSSION.
This study applied ML and DL techniques to analyze lifestyle choices, cognitive scores, and differentially expressed genes in patients with AD, with the primary goal of identifying critical biomarkers and features. The XGBoost model demonstrated superior performance in analyzing lifestyle choices, achieving an accuracy of 95.35%, highlighting its ability to identify key indicators such as dietary habits, sleep quality, and stress management, corroborating their relevance to AD. Similarly, Random Forest outperformed other models in assessing cognitive scores based on clinical data, with an accuracy of 90.94%, emphasizing the strong correlation between cognitive decline, as measured by MMSE, and AD pathology. Handwriting analysis further validated this approach, with XGBoost achieving 86.79% accuracy, reinforcing its role in cognitive assessment and early AD diagnosis.
In gene expression analysis, K-means clustering emerged as the best-performing model, with a silhouette score of 0.716, revealing critical associations between HSP90, HSF1, and AD pathology. The integration of multiple preprocessing techniques, including feature selection, data scaling, and cross-validation, ensured balanced datasets and improved model accuracy. Using multiple ML models for trials enhanced the reliability of results by selecting the best-performing models. These findings suggest that integrating lifestyle, cognitive, and genetic data offers a robust three-layer diagnostic framework for AD. Thus, this study underscores the potential of ML and DL techniques in identifying key biomarkers, offering valuable insights for improving AD diagnosis and paving the way for personalized therapeutic interventions.
Despite the promising results, this study has some limitations. Firstly, the datasets used were sourced from public repositories, which may introduce biases due to limited demographic diversity and potential inconsistencies in data collection methodologies. Secondly, while ML models achieved high accuracy, the generalizability of these findings in real-world clinical settings remains to be validated on larger and more diverse populations. Another limitation is the lack of longitudinal data, which could provide better insights into disease progression over time. Finally, while ML-based clustering identifies potential genetic biomarkers, further experimental validation is needed to confirm their biological significance in AD pathology.
In conclusion, the research highlights the complex interplay of genetic, behavioral, and cognitive factors in AD progression and opens the door to biomarker based personalized treatment strategies and improved diagnostic tools for AD, contributing to better patient outcomes. It also highlights the potential of machine learning and deep learning techniques to revolutionize personalized medicine by providing more accurate and actionable insights into complex diseases such as AD. By implementing supervised ML models on multiple datasets and by achieving high accuracies, the study provides a three-level validation of AD diagnosis. The findings pave the way for further exploration into integrating AI-driven methods into clinical workflows, conducting prospective validation in hospital settings, and exploring multi-omics approaches for a more comprehensive understanding of AD pathogenesis. integrating AI-driven methods in clinical settings.
SUPPORTING INFORMATION.
Supporting Information includes correlation matrix for selected features, and evaluation metrics regarding accuracies for each ML model on a dataset.
REFERENCES.
- Aging, N. I. o. Alzheimer’s Disease Fact Sheet, <https://www.nia.nih.gov/health/alzheimers-and-dementia/alzheimers-disease-fact-sheet> (2023).
- Breijyeh, Z. & Karaman, R. Comprehensive Review on Alzheimer’s Disease: Causes and Treatment. Molecules 25, 5789 (2020).
- 2024 Alzheimer’s disease facts and figures. Alzheimers Dement 20, 3708-3821 (2024).
- Beretta, G. & Shala, A. L. Impact of Heat Shock Proteins in Neurodegeneration: Possible Therapeutical Targets. Ann Neurosci 29, 71-82 (2022).
- Campanella, C. et al. Heat Shock Proteins in Alzheimer’s Disease: Role and Targeting. Int J Mol Sci 19, 2603 (2018).
- Feng, G. et al. Identification of UBE2N as a biomarker of Alzheimer’s disease by combining WGCNA with machine learning algorithms. (2024).
- Holod, S. alzheimers_disease_data, <https://www.kaggle.com/datasets/ilysha/alzheimers-disease-data> (2024).
- Abdullah, A. Alzheimer’s clinical data, <https://www.kaggle.com/datasets/legendahmed/alzheimers-clinical-data> (2020).
- Najib, T. Handwriting Data to Detect Alzheimer’s Disease, <https://www.kaggle.com/datasets/taeefnajib/handwriting-data-to-detect-alzheimers-disease> (2023).
- Gao, A. Alzheimer’s Gene Expression Profiles, <https://www.kaggle.com/datasets/andrewgao/alzheimers-gene-expression-profiles> (2020).

Posted by buchanle on Thursday, June 19, 2025 in May 2025.
Tags: Alzheimer’s Disease, Cognitive Scores, Diagnosis, Gene Expression, Machine learning