A Machine Learning Method to Achieve High Accuracy in Galaxy and AGN Classification using Photometric Data
ABSTRACT
Classifying galaxies is a crucial task in astrophysics, impacting our understanding of cosmic processes and the structure of the universe. The Baldwin-Phillips-Terlevich (BPT) diagram, established in 1981, is a common method for galaxy classification but has about a 20% inaccuracy rate when classifying Active Galactic Nuclei (AGNs)[1]. AGNs, characterized by their supermassive black holes emitting substantial radiation, are vital for astrophysical research[2]. This paper presents a machine learning approach to improve AGN classification, focusing mainly on photometric data instead of spectroscopy. By applying Random Forest Classifier, Logistic Regression, and K-means Clustering algorithms to a dataset combining the Sloan Digital Sky Survey (SDSS), the Galaxy Evolution Explorer (GALEX), and the Wide-Field Infrared Survey Explorer (WISE), we achieved a classification accuracy of 82% for AGNs using both photometry and spectroscopy, and notably 97% for quasars—an extremely luminous subset of AGNs—using only photometry. This high accuracy is significant since photometric data collection is simpler and less resource-intensive than spectroscopy. The improved classification accuracy is attributed not to an overabundance of non-quasar or non-AGNs in the datasets, which could introduce bias, but to the machine learning algorithms’ capabilities in identifying emission line ratios characteristic of quasars and AGNs. Further refinement of photometry datasets and optimization of machine learning models could lead to even more precise galaxy classifications, deepening our understanding of the universe’s complexities.
INTRODUCTION.
This research targets the enhancement of galaxy classification techniques, especially in the identification of AGNs, by addressing the misclassification issues prevalent in the conventional BPT diagram approach. Utilizing the combined SDSS-GALEX-WISE dataset, this study investigates alternative emission line ratios to establish a more accurate classification model, using machine learning.
Emission line spectra are fundamental to astrophysical inquiry, providing discrete lines that signify particular atomic transitions. These transitions occur when electrons in an atom jump between energy levels, emitting photons at specific wavelengths that are indicative of the atom’s chemical nature and environmental conditions, such as temperature and density[3]. The study of these spectral lines, known as spectroscopy, allows astronomers to determine the composition and physical conditions within galaxies with high precision.
There are two major methods to analyze light and chemical components of celestial bodies, which differ significantly in methodology and the type of data they provide: spectroscopy and photometry. Spectroscopy involves splitting the light from a source into its component wavelengths to produce a spectrum[4]. This process reveals the presence of specific elements and compounds through their unique spectral lines, whether they are emission or absorption lines. It is a powerful technique for obtaining detailed information about the physical properties of astronomical objects but is time-intensive and data-rich, requiring careful analysis.
In contrast, photometry measures the intensity of light from an object over large, defined bands of wavelengths, without resolving the light into individual lines or features. This method provides less detailed information than spectroscopy but is much more efficient for capturing the overall brightness and color of astronomical objects. Photometric data can be collected more quickly and processed more easily than spectroscopic data, making it ideal for studying large samples of astronomical objects.
This research proposes to leverage the efficiency of photometry, in conjunction with the Random Forest Classifier, Logistic Regression and K-means Clustering machine learning algorithms to detect complex patterns in the aggregated SDSS-GALEX-WISE dataset that can distinguish AGNs more accurately than the current spectroscopic methods allow. By identifying new emission line ratios that are more characteristic of AGNs, this study aims to reduce the overlap in spectral features between AGNs and other galaxy types, thereby decreasing the misclassification rate and enhancing the understanding of galactic structures and dynamics in astrophysics research.
MATERIALS AND METHODS.
Telescopes and Surveys.
Sloan Digital Sky Survey (SDSS): The Sloan Digital Sky Survey employs a 2.5-meter telescope for multi-spectral imaging and spectroscopic redshift surveys, capturing detailed images and spectra of celestial bodies. Its technology enables the mapping of galaxies, quasars, and the large-scale structure of the universe.
Galaxy Evolution Explorer (GALEX): The GALEX space telescope specializes in ultraviolet astronomy, using detectors sensitive to ultraviolet light to observe galaxies and stars. It focuses on understanding the mechanisms of star formation and the evolution of galaxies.
Wide-field Infrared Survey Explorer (WISE): WISE is an infrared-wavelength space telescope conducting an all-sky survey. It is equipped to detect infrared radiation, making it adept at observing objects like brown dwarfs, dusty star regions, and distant galaxies.
Dataset Description.
The SDSS-GALEX-WISE dataset we constructed integrates observations from the three significant astronomical surveys, which were queried and crossmatched using TOPCAT. It includes unique identifiers for spectral objects (‘SPECOBJID_1’) and data reliability indicators (‘RELIABLE’), either 0 (not reliable) or 1 (reliable). Spatial coordinates are provided by ‘RA’ (right ascension) and ‘DEC’ (declination), pinpointing object locations in the sky. The dataset categorizes the observed spectra (‘SPECTROTYPE’), which are galaxies, stars, and quasars (QSOs), and provides further classification details (‘SUBCLASS’), such as starforming galaxies, starburst galaxies, and AGNs. Redshift information is captured in ‘Z’, with any potential redshift calculation issues flagged in ‘Z_WARNING’. The ‘SN_MEDIAN’ column indicates the median signal-to-noise ratio, a critical data quality metric.
Spectroscopic data in the dataset is detailed through various FLUX measurements, representing the strength of emission lines at specific wavelengths of the OII_3726, OII_3729, H_BETA, OIII_5007, HEI_5876, OI_6300, NII_6548, H_ALPHA, NII_6584, SII_6717, and ARIII7135 emission lines.
Additionally, the dataset encompasses photometric magnitudes in the ‘u’, ‘g’, ‘r’, ‘i’ bands from the SDSS, which cover the optical range of the spectrum, as well as ‘FUVmag’ and ‘NUVmag’ from GALEX, representing far and near-ultraviolet light, respectively. Infrared observations from WISE are reflected in the ‘W1mag’, ‘W2mag’, ‘W3mag’, and ‘W4mag’ columns. These photometric magnitudes offer a broad overview of an object’s light emission across the electromagnetic spectrum.
For this research study, we filtered the SDSS-GALEX-WISE dataset to only include galaxies and QSOs that are reliable (value of 1), and excluded rows with infinite or negative infinite flux or magnitude values.
Unsupervised Machine Learning Algorithm.
The application of machine learning algorithms presents a useful method to extract meaningful patterns from this large amount of data. We employed an unsupervised machine learning algorithm, K-means clustering, to discern intrinsic groupings within the data without pre-labeled responses[5]. By partitioning AGNs into clusters based on photometric and spectral data, K-means lets us reveal underlying patterns and subtypes of AGNs without the constraints of predefined labels. The algorithm’s ability to detect these variations autonomously allows for a more nuanced understanding of AGN characteristics, potentially leading to the discovery of new classification metrics and insights into the physical processes of AGN phenomena. Hence, we used the K-means clustering as a first approach to identify certain emission line ratios of interest that can be analyzed more closely to determine if these ratios allow for a better classification accuracy than those in the BPT diagram.
Supervised Machine Learning Algorithms.
After using the K-means clustering and identifying emission line ratios of interest, we analyzed these ratios and the classification accuracy they provide in closer detail, with the use of supervised machine learning algorithms. In contrast to unsupervised algorithms, supervised machine learning algorithms require a labeled dataset to learn the relationship between input features and the target output. The Random Forest classifier is a supervised machine learning algorithm that utilizes multiple decision trees to perform classification tasks[6]. It incorporates randomness in two key aspects: by bootstrapping the dataset to create diverse subsets for training individual trees, and by selecting a random subset of features for node splitting within each tree. This method effectively reduces the risk of overfitting, a common challenge in decision tree models. Random Forest’s ability to handle high-dimensional data and provide insights into feature importance makes it a highly useful algorithm for our research, hypertuning the ‘n_estimators’ and test_size parameters to achieve the maximum classification accuracy. The Random Forest classifier was applied to two distinct datasets: one consisting of both GALAXY and QSOs, and another comprising only GALAXYs.
Logistic regression is a statistical model that estimates the probability of a binary outcome based on one or more predictor variables[7]. It operates on the principle that the log-odds of the probability of an event is a linear combination of the independent variables. The model applies a logistic function to arrive at a value between 0 and 1, which can be interpreted as the probability of the event occurring. This characteristic makes it particularly well-suited for binary classification tasks. In this study, we trained the Logistic Regression model onto a filtered GALAXY-only dataset to predict more accurately whether a galaxy is an AGN or not, based on its photometric and spectroscopic features.
For all of the machine learning models, we split the training and testing sets into, on average, 80-20.
RESULTS.
In the initial phase, we reproduced the BPT diagram using the SDSS-GALEX-WISE dataset to establish a baseline for AGN classification, as seen in Figure S1, which plots the calculated LOG(OIII/Hbeta) and LOG(NII/Halpha) axes from the data. This visualization was important in confirming the presence of the expected emission line ratios within our collected data, thereby validating the dataset’s compatibility with that of the BPT diagram.
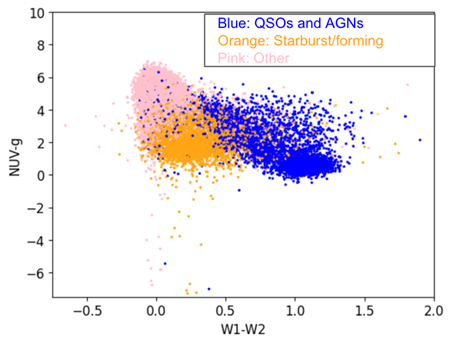
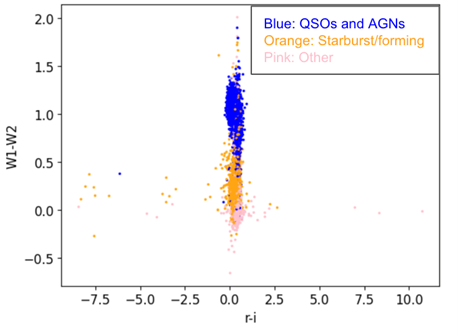
Subsequently, we conducted a systematic evaluation of various spectroscopic flux ratios and photometric magnitudes through iterative plotting of the filtered SDSS-GALEX-WISE dataset. We did this to identify alternative axes that could potentially facilitate clustering that is as distinct or superior to that of the conventional BPT diagram. After many iterations, and combining the QSOs and AGNs into the same color, we have found two possible combinations of axes that have distinct clusters using only photometric magnitudes: NUV-g vs. W1-W2, and W1-W2 vs. r-i, seen in Figure 1 and Figure 2.
After finding two potential axes of interest, we employed the K-means clustering algorithm to see natural groupings within combinations of ratios without reliance on predefined labels. As seen in Figure 3, the K-means clustering effectively found a natural grouping for the W1-W2 vs. r-i graph, after removing the pink data points, which are the spectrotypes we are not interested in analyzing.
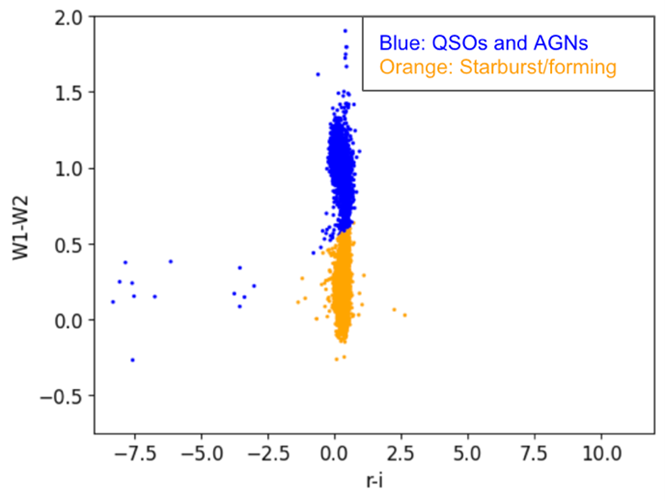
The original ratio of AGN and QSOs to Starburst/forming Galaxies was approximately 6333 to 21250, or 0.298. After applying K-means clustering, this ratio decreased to roughly 2678 to 21325, or 0.125. This shift can be attributed to the additional removal of null values for filtration, and the algorithm’s tendency to cluster other galaxy types with Starburst/forming galaxies due to their close proximity in the feature space. There was also the occurrence of reclassification of AGN and QSOs as Starburst/star-forming galaxies and vice versa. Such occurrences may have resulted from overlapping features in the spectral and photometric data, or due to the inherent sensitivity of the algorithm to the heavy density of the galaxy distributions. Thus, supervised machine learning models can instead be used for higher accuracy classification.
For the Random Forest classifier, we ran two algorithms. The first algorithm exclusively utilized photometric data, of both the W1-W2 vs. r-i axes and the NUV-g vs. W1-W2 axes as features to distinguish QSOs from other galaxy types. The ratio of the QSOs to total rows in the filtered dataset is 133/23971, or roughly 6.5% QSOs. Using this approach, as seen in Table 1, we achieved a classification accuracy of approximately 97%.
| Table 1. Random Forest Classifier of QSOs and Galaxies dataset (only photometry readings) | ||
| n_estimators | test_size | accuracy |
| 170 | 0.35 | 0.97 |
| 170 | 0.4 | 0.97 |
| 200 | 0.1 | 0.96 |
| 200 | 0.15 | 0.97 |
| 200 | 0.2 | 0.96 |
| 200 | 0.25 | 0.96 |
| 200 | 0.3 | 0.96 |
| 200 | 0.35 | 0.97 |
| 200 | 0.4 | 0.97 |
The second Random Forest model adopted a hybrid approach, integrating both photometric and spectroscopic data. For this algorithm, we used the photometric magnitudes NUV-g, W1-W2, r-i, FUV-NUV, and u-g, alongside log-transformed emission line ratios, LOG(ARIII/Hbeta), LOG(OIII/Hbeta), LOG(NII_6548/Halpha), and LOG(SII/Halpha). We included spectroscopic data as we aimed to enhance the model’s ability to distinguish broader AGNs from a filtered GALAXY-only dataset, which is more difficult and complex than simply QSOs, a highly noticeable subset of AGNs, from other galaxies. Using this approach, as seen in Table S1, we achieved a classification accuracy of 82% at its highest.
We also employed a Logistic Regression machine learning model as an alternative supervised learning strategy to determine its classification accuracy relative to the Random Forest classifier. We used this model in the context of distinguishing AGNs from a filtered GALAXY-only dataset, and as seen in Table S2, we achieved a classification accuracy of about 77%.
DISCUSSION.
The principal objective of the research paper was to enhance the precision of galaxy classification, specifically aiming to improve the identification of AGNs and their subset QSOs within the broader galactic dataset. The study additionally addressed the potential issue of dataset imbalance—where the prevalence of normal galaxy rows could bias the machine learning models towards classifying most objects as galaxies. However, the concern of an overabundance was invalidated by the high classification accuracy achieved. The model surpassed the hypothetical accuracy of 93.5%, which comes from the ratio of non-quasars to total rows in the filtered GALAXY-only dataset. This accuracy would be expected if the machine learning model were merely predicting the majority class. However, it instead attained an accuracy of 97%, which demonstrates that the model could discern QSOs from galaxies effectively, indicating that the features used for classification, including photometric magnitudes, provided a strong signal for distinguishing these celestial objects.
This observation that photometric values alone can lead to high classification accuracy is of significant value to the scientific community. It suggests that even without extensive spectroscopic data, researchers can accurately classify celestial objects, greatly expanding the potential for large-scale astrophysical studies. This is particularly beneficial for surveys where time and resources limit the feasibility of collecting detailed spectroscopic measurements. The ability to leverage photometric data opens up new avenues for astrophysical research, allowing for the analysis of larger datasets and facilitating studies that were previously not possible due to resource constraints.
ACKNOWLEDGMENTS.
I would like to thank Antonio Rodriguez for his crucial mentorship throughout this research, who helped me understand the applications of AI and machine learning to astrophysics, fields that I am significantly more interested in exploring in my future career.
SUPPORTING INFORMATION.
Additional supporting information includes:
Figure S1: Plot of original BPT diagram to observe distributions of galaxies, categorized by colors.
Table S1: Three-column table displaying results of Random Forest used on AGNs within GALAXY-only dataset: n_estimators, test_size, accuracy.
Table S2: Two-column table displaying results of Logistic Regression used on AGNs within GALAXY-only dataset: test_size, accuracy.
REFERENCES.
- L. Trouille, A. J. Barger, C. Tremonti, The OPTX Project. V. Identifying Distant Active Galactic Nuclei. The Astrophysical Journal 742, 46 (2011).
- E. S. Perlman, “Active Galactic Nuclei” in Planets, Stars and Stellar Systems (Springer, 2013), pp. 305–386.
- Anoka-Ramsey Community College, “10.3: Emission Spectra” in Introduction to Chemistry (Chemistry LibreTexts, 2023).
- S. Chu, G. S. Hurst, J. D. Graybeal, J. O. Stoner, “Spectroscopy.” Encyclopedia Britannica (2023) https://www.britannica.com/science/spectroscopy. Accessed 18 December 2023.
- A. Reddy, K. Madhavi, “Hierarchy based firefly optimized k-means clustering for complex question answering.” Indonesian Journal of Electrical Engineering and Computer Science 17, 264–272 (2020).
- M. Schonlau, R. Y. Zou, “The Random Forest Algorithm for Statistical Learning.” The Stata Journal 20, 3-29 (2020).
- P. Ranganathan, C. S. Pramesh, R. Aggarwal, “Common pitfalls in statistical analysis: Logistic regression.” Perspectives in Clinical Research 8, 148–151 (2017).

Posted by buchanle on Tuesday, April 30, 2024 in May 2024.
Tags: AGNs, astrophysics, classification, Machine learning, Photometry