A Comparative Analysis of Low-parameter CNN Performance on Malaria Detection from Blood Smear Microscopy
ABSTRACT
Malaria is a bloodborne disease caused by pathogens transferred through the bite of the Anopheles mosquito. Detecting malaria by blood smear microscopy is time-consuming and can be inefficient when areas with few pathologists are overwhelmed with medical cases. Furthermore, due to the complex and detailed nature of blood smear imagery, a human will take time to scan small details that could have been scanned more thoroughly by computer software. Due to these constraints, we hypothesized that a machine learning model can be trained to diagnose malaria from this imagery efficiently and accurately. This would decrease the time spent analyzing multiple samples, and also improve diagnostic accuracy. In this project, we aim to train a deep learning model to detect parasitized blood cells using various convolutional neural networks (CNNs, or ConvNets), namely, MobileNetV2 and EfficientNetB0. We compare metrics such as accuracy, precision, and F1 score and take a holistic overview of each model while prioritizing speed and accuracy to ensure the models can run on devices with low compute power and memory, which may be particularly useful in resource-limited areas where malaria is most prevalent. The best model concluded at the end of the study is able to achieve an accuracy of 96% and an average F1 score of 95.5% while maintaining low CPU and memory usage.
INTRODUCTION.
Background.
According to the World Health Organization’s 2023 World Malaria Report, globally, in 2022, there were an estimated 249 million malaria cases in 85 malaria endemic countries and areas (including the territory of French Guiana), an increase of 5 million cases compared with 2021. Many sub-Saharan African countries and tropical islands contributed to this increase. In 2022 the death rate for malaria was 14.3 deaths per 100 000 population at risk, resulting in 608,000 deaths in 2022 [1].
Quick and accurate diagnosis of malaria is crucial to prevent further infection and ensure speedy treatment with the correct medications. Delays in diagnosis and treatment is a leading cause of death in malaria patients in the United States [2]. There are 3 major types of diagnostic tests for malaria: Blood smear microscopy, Rapid diagnostic testing (RDTs), and polymerase chain reaction (PCR) tests [2]. Because blood smear microscopy is the focus of this paper–since features of parasitized cells in this format lend themselves to be distinguished by machine learning models well–only this technique will be discussed. In blood smear microscopy, examiners identify certain structures to detect the presence of 5–10 parasites in just 1μl of blood [3]. Although analyzing blood smears is the primary method used to evaluate blood samples for malaria detection around the world [3], due to human error and untrained medics in rural areas, the diagnostic sensitivity of blood smear microscopy is no better than 75%–90% under the best of conditions. In some settings, sensitivity may be as low as 50% [4].
The lack of consistent accuracy demonstrated by the statistics calls for a new solution. The issue of predicting whether a cell is parasitized or not from an image based on certain features needs a machine learning approach, namely, a neural network. Labeled microscopy imaging can be leveraged to train efficient machine learning models to make fast and accurate predictions.
Machine Learning and CNNs.
In a broad sense, machine learning is the process by which a computer iteratively improves its performance by learning from experience. “Experience” typically takes the form of a labeled dataset which the algorithm can learn from [5]. This project utilizes supervised learning which is a branch of machine learning that entails learning a relation between a set of input variables X and an output variable Y, known as features and labels respectively, and applying this mapping to predict the outputs for unseen data [6]. When dealing with images, a certain type of neural network, known as a convolutional neural network, is used. A CNN takes in an n-dimensional tensor X through a series of processing, where each step is known as a layer. The convolutional layer of a 2D CNN uses cube-shaped filters, or kernels, which are a set of weights applied to the parts of the image (in a sliding window fashion) through a process known as a convolution [7]. The resulting feature maps then can be passed on to the fully connected portion of the network, where the model maps a relation between the features and labels to make predictions on data. The model takes input images and labels, and uses gradient descent to find a set of weights with which to make predictions on input data. This process is known as backpropagation and is the most common method for training neural networks [8].
The goal of this project is to train a convolutional neural network with a predefined architecture to make accurate predictions about whether a blood sample is parasitized or not while maintaining accessibility across devices of low computational power. Because ConvNets can be arbitrarily large and complex, training them may require a lot of time and resources, which is why comparing all models to find optimal performance is not feasible without access to large cloud servers or high-end GPUs. With this project, we aim to train a model that supports our hypothesis, meaning it can make extremely accurate malaria diagnosis while having a low memory footprint, enabling the model to run on a variety of devices.
MATERIALS AND METHODS.
Dataset.
In this study, the Malaria Detection dataset from the Kaggle website was used [9] due to its inclusion of a large amount of data, pre-split into training, testing, and validation folders. The data set consists of 15,031 images of blood cells split into train, test, and validation folders, each with 2 sub-folders of parasitized and uninfected cells. The training set contains 13,152 images (6,570 parasitized cells and 6,582 uninfected cells), the validation set contains 1,254 images (629 infected cells and 624 uninfected cells), and the test set contains 626 images (309 parasitized cells and 317 uninfected cells). The training set is used to train the model, the validation set is used to ensure the model does not overfit the training data, and the test set is used to test various aspects of the model after it has completed training.
Image Augmentation.
To create a robust model with little bias towards a certain cell shape or size that is unrelated to malaria prediction, image augmentation improves the model’s ability to generalize. Additionally, randomly transforming the data provides a greater benefit for improving performance and reducing overfitting [10]. The transformations applied to our data were small translations in width, height, and rotation. Because the data is already tightly fit inside the borders of the image space (Figure 1), zooming and shearing were found to occasionally clip out identifying features of the cell which is why those two transformations were not included during the augmentation phase.

Software.
For this project, the Kaggle data sources were imported into the Google Colaboratory Notebook software, which was used to visualize the data and train the models. Within this environment, the TensorFlow Keras Python library [11] was used to create and train the models.
Models.
| Table 1. Model information | ||||
| Model | Epochs | Learning Rate | Parameters | FLOPS |
| MobileNetV2 | 18 | 0.0003 | 3.5M | 314M |
| EfficientNetB0 | 25 | 0.0003 | 5.3M | 390M |
We trained two convolutional networks on the data. MobileNetV2 and EfficientNetB0 were chosen due to their low number of parameters and smaller size (Table 1). The compound scaling approach of EfficientNets makes them better for large data and means that they use an order of magnitude fewer parameters and FLOPS (calculations per second) than other ConvNets with similar accuracy [12]. These models were designed to be easily scalable, meaning they start out small and can be scaled up based on the requirements of the problem. MobileNets use separable convolutions, which use between 8 to 9 times less computation than standard convolutions at only a small reduction in accuracy [13]. MobileNetV2 was designed to be small enough to run on mobile devices but still have a high enough accuracy to compete with state-of-the-art architectures. In addition, we also trained the ResNet50 model, but was very quickly found to be too large and complex for the task and overfit the data substantially while also having a much longer training time than the other two models. Instead of using the pretrained models for just feature extraction and then only training the fully connected portion of the model, we trained the entire architecture from scratch since the images were found to have distinguishing features that the pre-trained model was not suitably trained for. Both models were initialized using ImageNet weights as a baseline. After training, we compared metrics like accuracy, F1 score, ROC curve, and memory usage to evaluate model performance.
RESULTS.
When trained on the training set of the data (containing 13,152 images), MobileNetV2 achieved an accuracy on the test set of 96% and an F1 score of 95% for parasitized cells and 96% for uninfected cells (Table 2). EfficientNetB0 achieved an accuracy of 95% and an F1 score of 95% on the parasitized and uninfected cells (Table 3).
| Table 2. Results for MobileNetV2 | ||||
| Precision | Recall | F1 Score | Inference time | |
| Parasitized | 0.96 | 0.94 | 0.95 | 12s |
| Uninfected | 0.95 | 0.97 | 0.96 | |
| Accuracy | 0.96 | |||
| Table 3. Results for EfficientNetB0 | ||||
| Precision | Recall | F1 Score | Inference time | |
| Parasitized | 0.97 | 0.93 | 0.95 | 13s |
| Uninfected | 0.93 | 0.97 | 0.95 | |
| Accuracy | 0.95 | |||
DISCUSSION.
Model Comparisons.
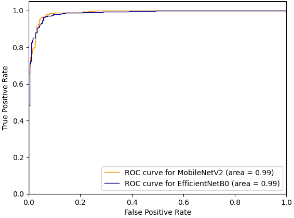
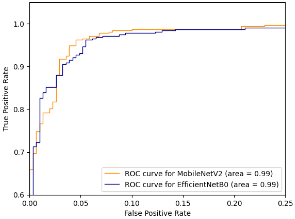
Since the models both have similar performance, we can compare other metrics like the ROC curve. The ROC (Receiver Operating Characteristic) curve is a relation between the false positive rate and the true positive rate. The area under the curve (AUC) represents the probability that a randomly chosen diseased subject is correctly rated or ranked with greater suspicion than a randomly chosen non-diseased subject [14]. In our case this means that when given 2 cells, one parasitized and one unaffected, AUC gives the probability that the model will assign a higher risk of malaria to the cell that is actually parasitized. However, using ROC-AUC as a numerical measure of model performance has some well known disadvantages, such as when ROC curves cross [15], the intersection means that one curve has larger sensitivity for certain choices while the other has larger sensitivity for other choices of specificity [16]. Due to this disadvantage, and the fact that the ROC curves do in-fact cross, the area under the curves may misrepresent the characteristics of the models (Figure 2, 3).
The next step is to compare the model architecture and find the model that is the most efficient because heavier models can impose considerable computation and memory overhead [17]. This limits their practical use and deployability. Using model data from the Keras applications list, MobileNetV2 has a smaller size, number of layers, and depth than EfficientNetB0 [18]. Additionally, after convergence, MobileNetV2 had a loss of 0.13429 on the training set while EfficientNetB0 had a loss of 0.14895 on the training set. The final step in evaluating the performance of the two models is to compare the memory usage and CPU load. The CPU provided by Google Collab – on which the model was trained and evaluated – was an Intel Xeon CPU with 13 GB of RAM. This is an important metric since many devices in rural areas without access to expensive, modern technology have to rely on computationally weak devices for healthcare. Using the psutil and time libraries in python, computing the difference in memory usage by the average of 5 trials each tells us that MobileNetV2 used an average of 8,019,968 bytes of memory while EfficientNetB0 used an average of 11,703,910 bytes of memory (Table 4). Likewise, MobileNetV2 had an average CPU usage of 0.1721% while EfficientNetB0 had an average CPU usage of 0.3722% (Table 4).
| Table 4. Resource usage by both models. | ||
| MobileNetV2 | EfficientNetB0 | |
| Memory (bytes) | 8,019,968 | 11,703,910 |
| CPU (%) | 0.1721 | 0.3722 |
As we hypothesized, we were able to train a model that could make extremely accurate malaria diagnosis while maintaining a low memory footprint. While both these models achieved our goal, we still need to compare them to find the best model out of the two, since although they have similar performance, other factors can also influence which one is better for classifying malaria. Because both models perform similarly across most metrics, choosing the best out of the two requires a holistic analysis.
As seen in tables 2, 3, and 4, MobileNetV2’s slightly higher performance metrics and lower CPU and memory usage make it ideal for running live on small devices, and therefore MobileNetV2 is the faster, more accurate model out of the two when classifying malaria from blood smears. Using MobileNetV2, we were able to train a model that can make faster predictions, more accurate predictions on weaker machines, which is significant to low-resource areas without access to high-end devices.
Addressing Major Issues.
A thorough analysis of the model’s incorrect predictions revealed that while some of the incorrectly predicted images did show signs of malaria which the model was not able to detect, the majority of the incorrectly predicted images did not show any visual signs of malaria at all. This brought up the possibility that the majority of the misclassified images that did not show any visible signs of malaria may not have been misclassified due to model error, but may be due to inconsistencies within the dataset itself. Studies similar to this one have shown that similar datasets with blood smear microscopy for detecting malaria have a considerable amount of incorrectly labeled data. A specific study, using a superset of the dataset used in this experiment, consulted with an expert in the field and found that roughly 5.1% of the 27,558 images were incorrectly labeled [19]. Although we cannot confirm that images in our dataset were mislabeled, based on similar findings from other studies, and the fact that the majority of models described in papers in this field cap out at an accuracy of roughly 94 – 97%, it may be reasonable to assume that due to the large size of this dataset, incorrectly predicted images not showing visible sign of malaria are misclassified.
To deal with both of these issues, we created a new modified training set. In this new training set, each of the misclassified images which showed signs of malaria were duplicated 5 times to improve dataset balance. We also omitted the potentially misclassified images in the modified training set to reduce the negative bias to the model. However, when MobileNetV2 was trained on the modified training set, these solutions only improved model accuracy by a fraction of a percent. A further investigation of these issues may be helpful.
Future Work.
There are two potential ways we thought of that could increase the accuracy of the model and even potentially decrease its complexity. Both these methods could provide greater model accuracy and possible decreases in computer power requirements.
1) Using an auto-encoder for feature extraction may work very well on this dataset, since reducing the dimensionality for feature selection could remove irrelevant features like cell shape and size and focus the model on detecting relevant features such as darker regions within the cell.
2) Before using traditional deep learning methods, a preprocessing function could be implemented that uses edge detection to segment the cell image into boundaries in which more than one boundary would mean there is a subregion of darker color within the cell indicating malaria.
CONCLUSION.
In this study, we trained and compared two machine learning models to predict malaria from blood smear imagery and discussed their performance and how it affects real world use cases. Various aspects of the model were compared to find the better model. We also discussed how the motivation behind the creation of these models influences their advantages in solving this problem. It is crucial that automated malaria detection be fast and accurate since it’s necessary the models deliver results quickly and are able to run on low power devices found in resource-limited areas, which is why the models trained and compared in this project have the potential to be implemented in apps or services that pathologists could use quickly on any device to aid their diagnosis on whether a patient has malaria based on blood smear microscopy.
REFERENCES.
- World Health Organization, “World Malaria Report 2023”; www.who.int/teams/global-malaria-programme/reports/world-malaria-report-2023, July 20, 2024.
- CDC, “Testing for Malaria”; www.cdc.gov/malaria/testing/index.html, June 25, 2024.
- C W. Pirnstill, G. L. Coté, Malaria Diagnosis Using a Mobile Phone Polarized Microscope. Scientific Reports 5, 13368 (2015).
- M. L. Wilson, Malaria Rapid Diagnostic Tests. Clinical Infectious Diseases 54, 1637–1641 (2012).
- M. Mohri, A. Rostamizadeh, A. Talwalker, Foundations of Machine Learning (MIT Press, ed. 2, 2018).
- P. Cunningham, M. Cord, S. J. Delany, “Supervised Learning” in Machine Learning Techniques for Multimedia, of Cognitive Technologies (Springer Berlin Heidelberg, 2008), pp. 21–49.
- K. O’Shea, R. Nash, An Introduction to Convolutional Neural Networks. arXiv:1511.08458 [cs.NE] (2015).
- Y. Chauvin, D. E. Rumelhart, Backpropagation: Theory, Architectures, and Applications (Psychology Press, 2013).
- S. M. Shahriar, Malaria Detection, version 1, Kaggle (2024); www.kaggle.com/datasets/sayeemmohammed/malaria-detection.
- S. C. Wong, A. Gatt, V. Stamatescu, M. D. McDonnell, Understanding Data Augmentation for Classification: When to Warp?. 2016 International Conference on Digital Image Computing: Techniques and Applications (DICTA), e10.1109/DICTA.2016.7797091 (2016).
- Keras. n.d., “Home – Keras Documentation.” Keras.io, https://keras.io/, July 2024.
- M. Tan, Q. Le, in Proceedings of the 36th International Conference on Machine Learning (MLR press, 2019), pp. 6105-6114.
- A. G. Howard, M. Zhu, B. Chen, D. Kalenchenko, W. Wang, T. Weyand, M. Andreetto, H. Adam, MobileNets: Efficient Convolutional Neural Networks for Mobile Vision Applications. arXiv:1704.04861 [Cs.CV] (2017).
- J. A. Hanley, B. J. McNeil, The Meaning and Use of the Area under a Receiver Operating Characteristic (ROC) Curve. Radiology 143, 29–36 (1982).
- D. J. Hand, Measuring Classifier Performance: A Coherent Alternative to the Area under the ROC Curve. Machine Learning 77, 103–123 (2009).
- C. Gigliarano, S. Figini, P. Muluere, Making Classifier Performance Comparisons When ROC Curves Intersect. Computational Statistics & Data Analysis 77, 300–312 (2014).
- S. H. Hasanpour, M. Rouhani, M. Fayyaz, M. Sabokrou, Lets Keep It Simple, Using Simple Architectures to Outperform Deeper and More Complex Architectures. arXiv:1608.06037 [Cs.CV] (2018).
- Keras, “Keras Applications,” Keras.io, keras.io/api/applications/, July 2024.
- K. M. F. Fuhad, J. F. Tuba, Md. R. A. Sarker, S. Momen, N. Mohammed, T. Rahman, Deep Learning Based Automatic Malaria Parasite Detection from Blood Smear and Its Smartphone Based Application. Diagnostics (Basel) 10, 329 (2022).

Posted by buchanle on Friday, June 20, 2025 in May 2025.
Tags: Artificial Intelligence, convolutional neural networks, Machine learning, Malaria