Validating a Dual-Threshold Peak Detection for Calcium Signals Around Laser-Induced Epithelial Wounds
ABSTRACT
Epithelial cells are a vital part of basic survival in many organisms. When these cells are wounded, coordination between the epithelial cells is necessary for the wound healing process to begin. During this time, the concentration of calcium oscillates within the cells. These oscillations, or peaks, may contain information about how epithelial cells use calcium to aid the wound healing process. Previously, an automated system was created to collect and analyze these peaks using a dual-threshold method. However, this automated system had not been verified to work accurately. Therefore, the creation of a manual peak detection system was necessary to calculate the accuracy of the automated system. Specificity and sensitivity of the automated system in comparison to the manual system were measured to determine the most optimal automated system settings. The setting proved to have the highest accuracy of approximately 87%. However, the targeted goal was to have a minimum accuracy of 95%. Therefore, the current automated system was determined to not be accurate enough for use.
INTRODUCTION.
When epithelial wounds occur, coordination between epithelial cells is essential for the wound healing process [1,2]. Following injury, epithelial cells are involved in a complex process in which they must detect the wound, migrate and multiply to close the wound, and reestablish damaged tissue architecture [3]. During this time, the intracellular concentration of calcium begins to increase around the wound. It is currently unknown how cells use the calcium to transmit information between each other in the healing process [4]. However, it has been seen in laser-induced wounds of Drosophila pupae that influxes of calcium appear around the wound in four main stages: the initial influx, the first expansion, the second expansion, and the flaring state [5,6].
The initial influx of calcium occurs milliseconds after wounding due to a laser-induced cavitation bubble. The bubble creates micro-tears in the cells’ plasma membrane near the wound which allows calcium to enter the cell. This elevated concentration of calcium in the tissue causes the first expansion as calcium diffuses intercellularly away from the wound through gap junctions connecting adjacent cells. In the second expansion, more calcium enters cells farther away from the wound in a slower, extracellular process. Finally, in the flaring state, intracellular calcium concentrations begin to rapidly oscillate. These oscillations may encode important information that instructs cells on how to heal the epithelial wound. The oscillations, or peaks, of calcium concentrations, however, have not been thoroughly examined in the context of wound healing. Fully examining the relationship between the calcium oscillations and time, distance from the wound, and intensity may link calcium as a key factor in the wound healing process.
To be able to efficiently analyze the calcium peaks, a method of determining when these peaks occur is warranted. Currently, an automated system has been created to determine when a peak occurs following the second expansion, but this automated system has not been validated. Before the automated system could be verified, a manual peak detection system must first be created. Comparing the peaks detected in the automated system against the manual system would reveal the settings that provide the highest accuracy of the automated peck detection and if the automated system is consistently 95% accurate enough to be used.
MATERIALS AND METHODS.
Drosophila pupae were marked with the genetically encoded calcium indicator GCaMP, and then lasered ablated using a Zeiss LSM410 raster-scanning inverted confocal microscope with a 40 × 1.3 NA oil-immersion objective to provide seven different wounding videos [5]. Further experimental procedures and data acquisition methods are explained in reference [5].
All videos were recorded with the microscope and passed through a median filter in ImageJ. From the videos, sixty-six pixels were selected semi-randomly such that each pixel was outside the second expansion and contained at least one peak. Additional pixels were also selected without any peaks to assess the rate of false positives in the automated system. Each pixel produced a graph of GCaMP fluorescence vs. time. The graph was then processed by both the automated peak detection code and the self-developed manual peak detection code.
The automated code determined peaks using a dual-thresholding method. First, the mean of fluorescence noise before wounding was subtracted from the fluorescence data to set the baseline relative to the mean. Then, a lower threshold and an upper threshold were determined using the standard deviation of the noise. Standard deviation calculations had two different options: frame-based or pixel-based. The frame-based option calculated the standard deviation of the noise based on all pixels in the frame before wounding. The pixel-based option calculated standard deviations of noise based on only the one selected pixel before wounding. The standard deviation of the noise would then be multiplied against the multipliers, a combination of two integer numbers ranging from one to ten, to create each respective threshold.
With each multiplier, the first number is always below the second (e.g. 1,3), for a total of forty-five different combinations. A peak would start from the moment the data crosses the upper thresholds and end when it crosses the lower threshold.
The manual version chose peaks based on a subjective baseline and were all handpicked by one user for consistency. Both the automated and manual versions then produced a binary graph using the start and end of peaks for all points (Figure 1).
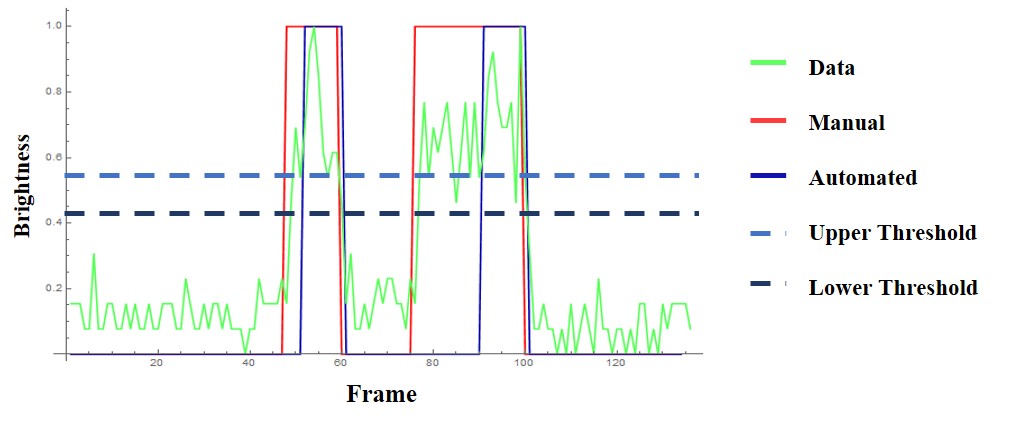
Figure 1. Example of automated and manual fitting of raw fluorescence data. Raw data was smoothed using a medium filter to create a fluorescence light (light green). The automated version calculates peaks based on the mean of noise before wounding. Then, the lower threshold (light-blue dashed line) and the upper threshold (dark-blue dashed line) are calculated using the standard deviations and a multiplier. The multipliers are a combination of two integer numbers ranging from 1 to 10, with the first number always being below the second. A peak (blue) would start from the moment the fluorescence crosses the upper threshold and end when it reaches the lower threshold. The manual version peaks (red) were chosen subjectively compared to the automated detection of peaks.
Five different peak-matching outcomes were defined to compare the manual and automatic peak detection. A correct match occurred when both the automated and manual code detected a peak within a given time interval, although the peaks do not have to be completely aligned. False negatives occur when there is a peak in the manual detection but not in the automatic detection within some time interval, while false positives occur when there is a peak in the automatic detection but not in the manual detection. Grouping occurs when two or more manual peaks are placed within one automated peak, while the opposite is termed splitting (Figure 2).
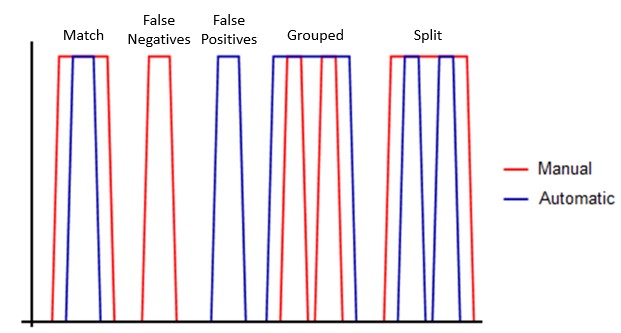
Figure 2. Examples of the different results possible from peak comparisons. Five different outcomes from comparing the manual and automatic peak detection methods.
For each threshold multiplier combination, specificity and sensitivity values were calculated. Specificity was calculated as the ratio of the number of correctly matched peaks to the total number of outcomes. Sensitivity was calculated as the ratio of the number of correctly matched peaks to the total number of manual peaks. The average of the specificity and sensitivity resulted in the accuracy which was used to find the most optimal setting for the automated peak detection code.
RESULTS.
To determine the most optimal threshold settings, the selected time series were analyzed using both the manual peak detection as well as the automated peak detection with all combinations of threshold multipliers using both frame-based and pixel-based standard deviation calculations. This produced a total of 90 distinct sets of automated peak detection settings to compare to the manual peak detection. For each comparison, the number of each peak-matching outcome was counted in order to determine the specificity of each automated peak detection setting. Sensitivity and accuracy were then calculated for each automated peak detection setting. All upper threshold multipliers greater than five resulted in accuracies below 75%.
Since a correct peak-match outcome does not compare the duration of peaks between the manual and automated versions, it could be the case that the automated peak detection method, even with high accuracy, either overestimates or underestimates the duration of the peaks. Therefore, for each automated peak detection setting the duration of correctly match peaks was compared between the manual and automated peak detection methods (Figure 3a). The slope of the best fit line indicates how well the automated peak detection is at matching the peak durations given by the manual peak detection; a slope less than 1 indicates a tendency of the automated version to underestimate peak durations while a slope greater than 1 generally indicates an overestimate peak durations. A slope close to 1 indicates that the automated peak detection does not favor underestimation or overestimation of peak durations.
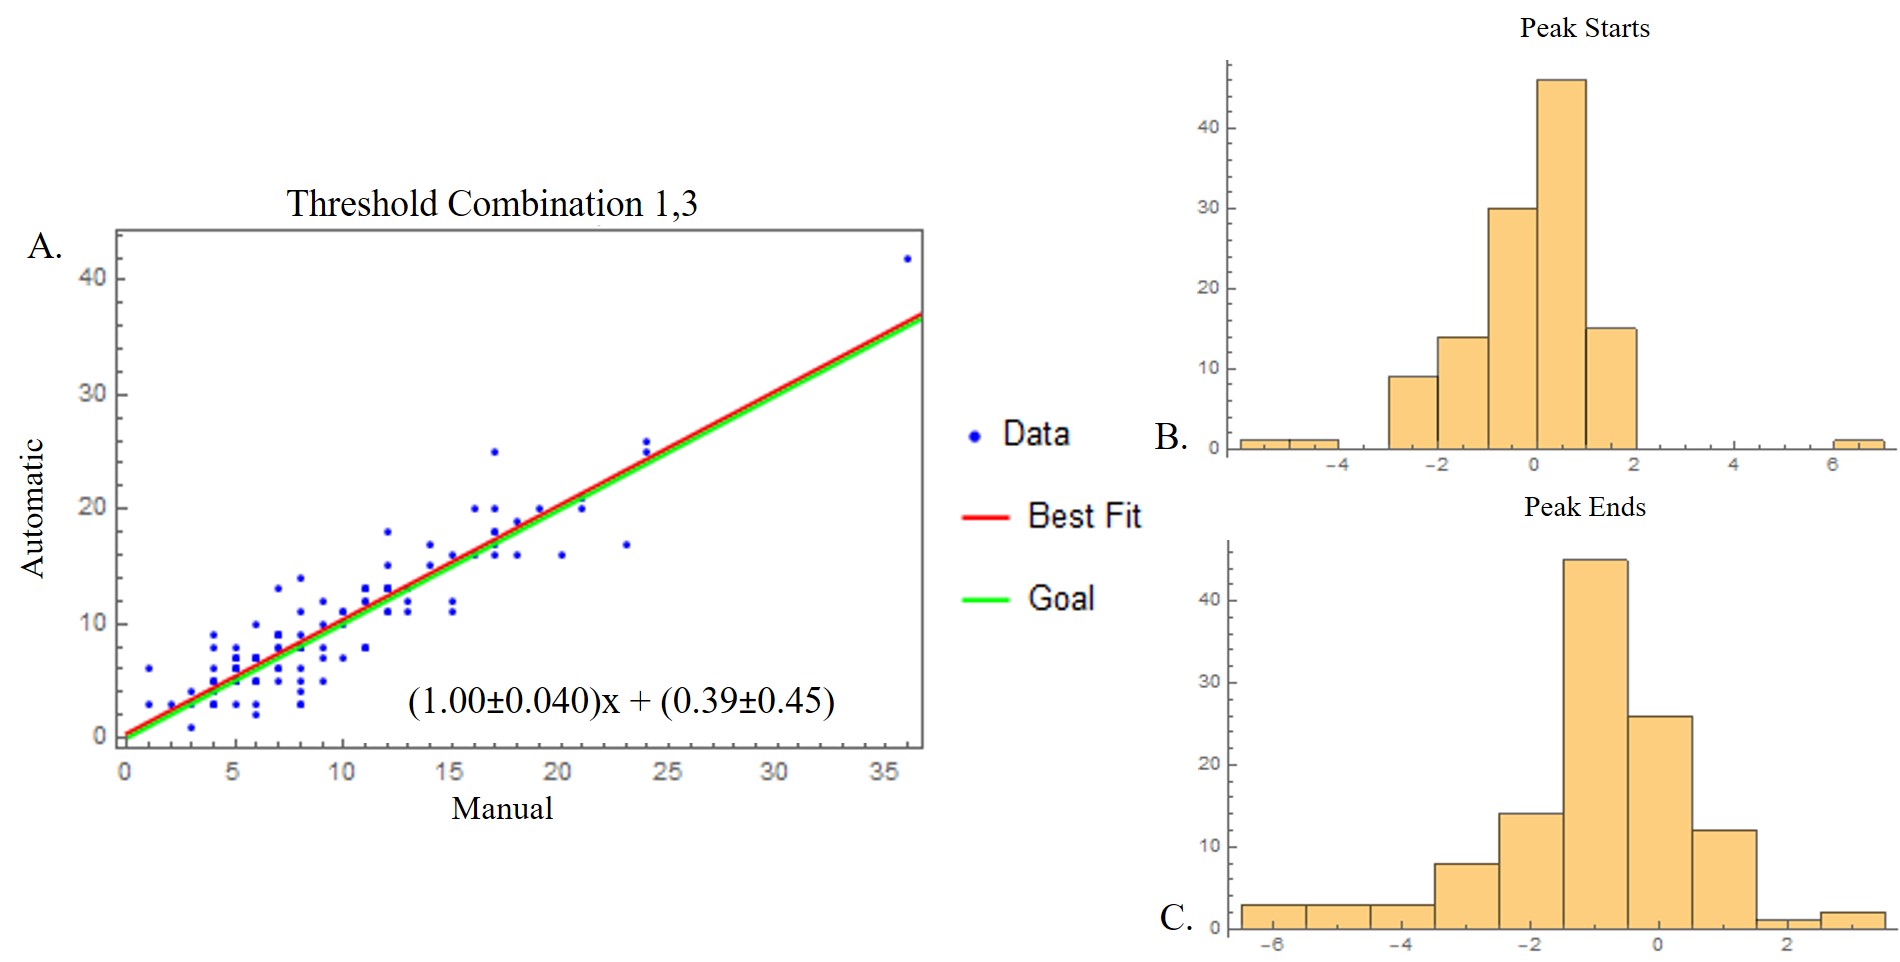
Figure 3. Comparisons between manually and automatically detected peaks. (A) The scatter plot compares peak width, or how long each peak lasted, at the setting of a frame-based threshold multiplier of 1 and 3. The horizontal axis is how long each manually detected peak lasts while the vertical axis is how long each automatically detected peak lasts. Only correctly matched peaks (blue) were plotted along with a best-fit line (red). A best-fit slope greater than one suggests longer automated peaks while a slope less than one suggests shorter automated peaks compared to the manually determined peak durations. A line with a slope of one (green) is plotted as well. For the threshold multipliers of 1 and 3, the slopes of both lines closely matched, indicating no tendency for the automated version to overestimate or underestimate peak durations. The histograms represent how early (B) or late (C), in terms of frames, the automated version detects or ends a peak in relation to the manual detection. Values equaling to zero show that the automated peak detection picked up a peak in the same frame as the manual versions. Positive values indicate early detections or ends while negatives indicate late detections and ends. In 2B, values tend to center zero meaning that peaks are generally started in the same frame. In 2C values tend to nearly center zero but are slightly more negative, indicating a slightly late ending.
A correct peak-match event also does not guarantee that the automated peak detection method has correctly determined when a peak starts and ends. The difference between the start of the manual detection and the start of the automated detection, as well as the ends, were found and plotted in histograms to show early or late detections/endings (Figure 3). Positive differences indicate that the automated peak detection placed the start or end of a peak earlier than what was set by the manual peak detection, and negative differences indicate that the automated peak detection placed the start or end of a peak later than what was set by the manual peak detection. Values of 0 indicates an agreement between both peak detection methods.
DISCUSSION.
In order to determine the optimal setting of the automated peak detection method, a manual version of the code was created to determine the accuracy of the automated system. Out of all of the possible combinations of threshold values and setting choices, a framed-based standard deviation, a lower threshold multiplier of 1, and an upper threshold multiplier of 3 have proved to have the highest accuracy of 87%. Other multiplier combinations with the upper threshold of 1 to 4 range relatively close as well (generally greater than 80%). These upper threshold values contained few false negatives, but they contained several false positives. As the upper threshold values increased, fewer false positives appeared, but an increase the percentage of false negatives increasingly grew. In terms of peak durations, closer lower threshold values and upper threshold values had a decreasing slope, indicating that automatically detected peaks lasted shorter than their manual counterpart. Generally, a lower threshold of 1 had the slopes closest to 1 in comparison to other lower threshold values. Automated detection of the start of the peak became increasingly behind while the detection of the end of the peak became increasingly ahead. This is consistent with the shorter duration of peaks in the scatterplots.
The desired level of accuracy wanted was at a minimum of 95%. The highest accuracy was only approximately 87% for the threshold combination of 1 and 3 using the frame-based standard deviation calculation. This combination also contained less than 5% of false negatives and less than 8% of false positives in its detection. Although the peak duration nearly matched, the beginning of the detection was consistently late with ending detections being consistently early. As this was the current best setting, it was determined that automated peak detection is not currently usable for statistical analysis of the calcium oscillations.
Nevertheless, there are a few ways that accuracy may be improved. Currently, the automated peak detection only uses threshold multipliers that are integers. However, using rational numbers may or may not increase the accuracy of the automated detection. Adjustments could also be made with how the automated detection calculates values like the thresholds or the standard deviations. For instance, instead of just selecting one pixel for the pixel-based standard deviation calculation, another calculation method could be selecting the individual pixel and the surrounding ones. Also, as only a limited amount of videos (7) were analyzed, more videos could be processed with both the manual and automated detection system to increase the certainty of the comparison. Another method to automatically detect peaks, such as machine learning, may be necessary to provide the most optimal peak detection.
By having an efficient and reliable automatic system to detect peaks in time series data sets, calcium oscillations may be further studied and analyzed. In turn, patterns could be discovered regarding how calcium operates and travels during the oscillation portion of the wound healing process. Overall, this would help in determining how cells work together to heal epithelial wounds.
ACKNOWLEDGMENTS.
I would like to thank the School for Science and Math at Vanderbilt and the Hutson Lab for allowing me to participate in research. Furthermore, I would like to especially thank Aaron Stevens and Menton Deweese for being my mentor and advisor throughout the duration of this project.
REFERENCES.
- S. Park, et al., Tissue-scale coordination of cellular behavior promotes epidermal wound repair in live mice. Nature Cell Biology 19, 155-163 (2017).
- S. Xu and A. Chisholm, A Gαq-Ca2+ Signaling Pathway Promotes Actin-Mediated Epidermal Wound Closure in C. elegans. Current Biology 21, 1960-1967 (2011).
- N. B. Enyedi and P. Niethammer, Mechanisms of epithelial wound detection. Trends in Cell Biology 25, 398-407 (2015).
- A. Lansdown, Calcium: a potential central regulator in wound healing in the skin. Wound Repair and Regeneration 10, 271-285 (2002).
- E. K. Shannon, et al., Multiple Mechanisms Drive Calcium Signal Dynamics around Laser-Induced Epithelial Wounds. Biophysical Journal 113, 1623–1635 (2017).
- L. Antunes, et al., Coordinated waves of actomyosin flow and apical cell constriction immediately after wounding. The Journal of Cell Biology 202, 365-379 (2013).
Posted by John Lee on Wednesday, December 23, 2020 in May 2020.
Tags: Calcium Signals, Peaks Detection