Utilizing Camera Traps to Analyze Relative Abundance of Basking Turtles in Wetland Ecosystems
ABSTRACT
Wetland degradation threatens many aquatic turtle species, which link terrestrial and aquatic habitats, and are important species in many ecosystems. Aquatic turtles are ectotherms that must sun themselves to thermoregulate, a behavior known as basking. This research evaluates the applicability of camera traps, a new innovation in ecology, for monitoring basking relative abundance of red-eared sliders (Trachemys scripta elegans) in three wetland ecosystems in Tennessee during summer 2018. Cameras took pictures of basking sites every hour from sunrise until sunset utilizing time-lapse technology. Temperature was recorded with a data logger, and solar irradiance was calculated using a solar calculator. Solar irradiance had a more significant effect on basking use (P-value < 0.001) than temperature (P-value = 0.039). Basking use was greatest during the afternoon hours (12:00-17:00). Afternoon basking allows turtles to gain considerable energy, while leaving the rest of the day for foraging and other activities. Future directions include utilizing camera traps to assess more diverse ecological measures, thus introducing new research opportunities.
INTRODUCTION.
Wetlands and their inhabitants provide key ecosystem services and are important nursery locations for many fish and animal species [1]. Monitoring wetlands is crucial to ensuring their continued existence as habitats for the organisms and as performers of important ecological functions [1]. Amphibians and reptiles are particularly dependent on wetlands for a variety of life history requirements, such as foraging and reproduction.
Native freshwater turtles link terrestrial and aquatic habitats and represent important species in wetland ecosystems [2]. Primary threats to aquatic turtles include pollution, introduced diseases, and invasive species, including other non-native turtles, such as the red-eared slider (Trachemys scripta elegans) [3, 4]. Evaluation of turtle behavior is important to better understand wetland disturbance; however aquatic turtles are often difficult to study due to secretive behaviors and use of several habitats.
This research seeks to better understand the basking relative abundance of T. s. elegans in wetland ecosystems, where it is native, with the goal of providing insight into how its behavior changes when acting as an invasive. Aquatic turtles are ectotherms so they must sun themselves on fallen logs, rocks, or other sites to thermoregulate in a behavior known as basking [5]. Basking behavior is influenced by physical factors such as light intensity and air/water temperature, as well as biological factors such as body size [5].
Additionally, this research evaluates the usefulness and applicability of camera traps for turtle research. As opposed to traditional trapping methods, cameras “trap” organisms with photos. Camera trap technology can overcome some of the major limitations of traditional sampling; their capacity to collect data over long periods of time with minimal maintenance makes them ideal alternatives to traditional capture methods [7, 8, 9]. Researchers are hesitant to use PIR (passive infrared) sensors, the traditional technology used by camera traps, on cold-blooded, slow-moving creatures [7], but they have been shown to perform similarly to traditional sampling methods in measuring abundance and occupancy of turtles [9, 10].
This research provides insight into the potential utility of camera traps for a wide variety of ecological measures to study wetland species, in this case, a basking use analysis of one turtle species. It was predicted that temperature and basking use would follow similar trends, and that the basking use of T. s. elegans would be highest at the warmest/brightest times of day around mid-afternoon (12:00-15:00) because they could make energy gains faster than at other times of day.
MATERIALS AND METHODS.
Wetland Selection.
Surveyed sites included wetlands of varying ecological condition (details in Supporting Information) within Davidson County, Tennessee, USA: Wetland 1 (36°10’24” N, 86°49’36” W), Wetland 2 (36°11’44” N, 86°42’01” W), and Wetland 3 (36°10’16” N, 86°51’05” W) (Figure S1).
Data Collection.
A HOBO U12 4-external channel data logger was used to record air temperature at each wetland, starting at noon on the first day of sampling and recording every minute for the duration of sampling. Each of five camera traps consisted of a Browning Strike Force HD Pro trail camera (model: BTC-5DP) mounted to a tree with a mounting rope and secured with a lock box and master lock. Cameras were positioned toward basking sites to maximize turtle detections. Because traditional motion sensors can be unreliable with ectothermic organisms, the camera traps’ time-lapse capabilities were utilized. The cameras were programmed to take a picture every hour from sunrise until sunset for each sampling day over a six-day period (settings in Supporting Information). As the total number of cameras was limiting (n = 5), each wetland was surveyed randomly during a different week.
Data Processing and Analysis.
Each picture fell within a one hour sampling period (1-15), ranging from 5:00 to 19:59, with pictures from a single wetland taken within 15 minutes of each other. Captured turtles observed basking were counted towards basking use. An offsite independent observer confirmed total counts for each sampling period for each day. Cameras that captured less than five turtles over the entire sampling period were excluded from further analysis.
Individual counts were standardized by correcting them to a proportion of use, which was calculated by dividing the raw count of each frame by the highest count captured by that camera in that wetland.
These proportions were averaged across wetlands and days to determine average use for each sampling period. Temperature for each sampling period was the average temperature of the hour preceding the picture because turtles began basking sometime during that hour, and was also averaged across wetlands and days.
For each wetland, hourly solar irradiance data was obtained using the MeteoExploration Solar Calculator [11], using GPS coordinates, altitude, and temperature data collected in the field and visibility, RH, and ozone thickness data obtained from METAR reports [12]. The albedo value used for all sites was 0.24, reported by Oguntunde et. al. for a vegetative wetland [13]. Total solar irradiance was measured in watts/m2 and was the sum of direct and diffuse radiation. Final hourly values for each wetland were averaged across days.
For statistical analysis, the one hour sampling periods were divided into the following time of day categories: morning (1-7, 5:00-11:59), afternoon (8-13, 12:00-17:59), and evening (14-15, 18:00-19:59). A linear mixed model via the lme4 package [14] in R Studio (v. 1.1.453) was used to test the relationship with between basking use and time of day, with time of day category treated as a fixed effect, and camera and wetland number treated as random effects. A Tukey test was used for post-hoc comparisons between categories. The correlations between basking use and temperature and basking use and solar irradiance were tested using two linear regressions in R Studio. Results were considered statistically significant when P-values were £ 0.05.
RESULTS.
Basking Use and Time of Day.
A linear mixed model revealed a significant effect of time of day on basking use (F = 25.7, d.f. = 2, and P < 0.0001). The random effects of camera and site had variances of 16.6 ± 4.1 and 31.6 ± 5.6 respectively. A post-hoc Tukey test revealed that all times of day were significantly different from one another with regards to basking use with the greatest differences occurring between afternoon and the other two categories (P-values < 0.001, Figure 1). Morning and evening were also significantly different (P-value = 0.03, Figure 1) but less so than afternoon.
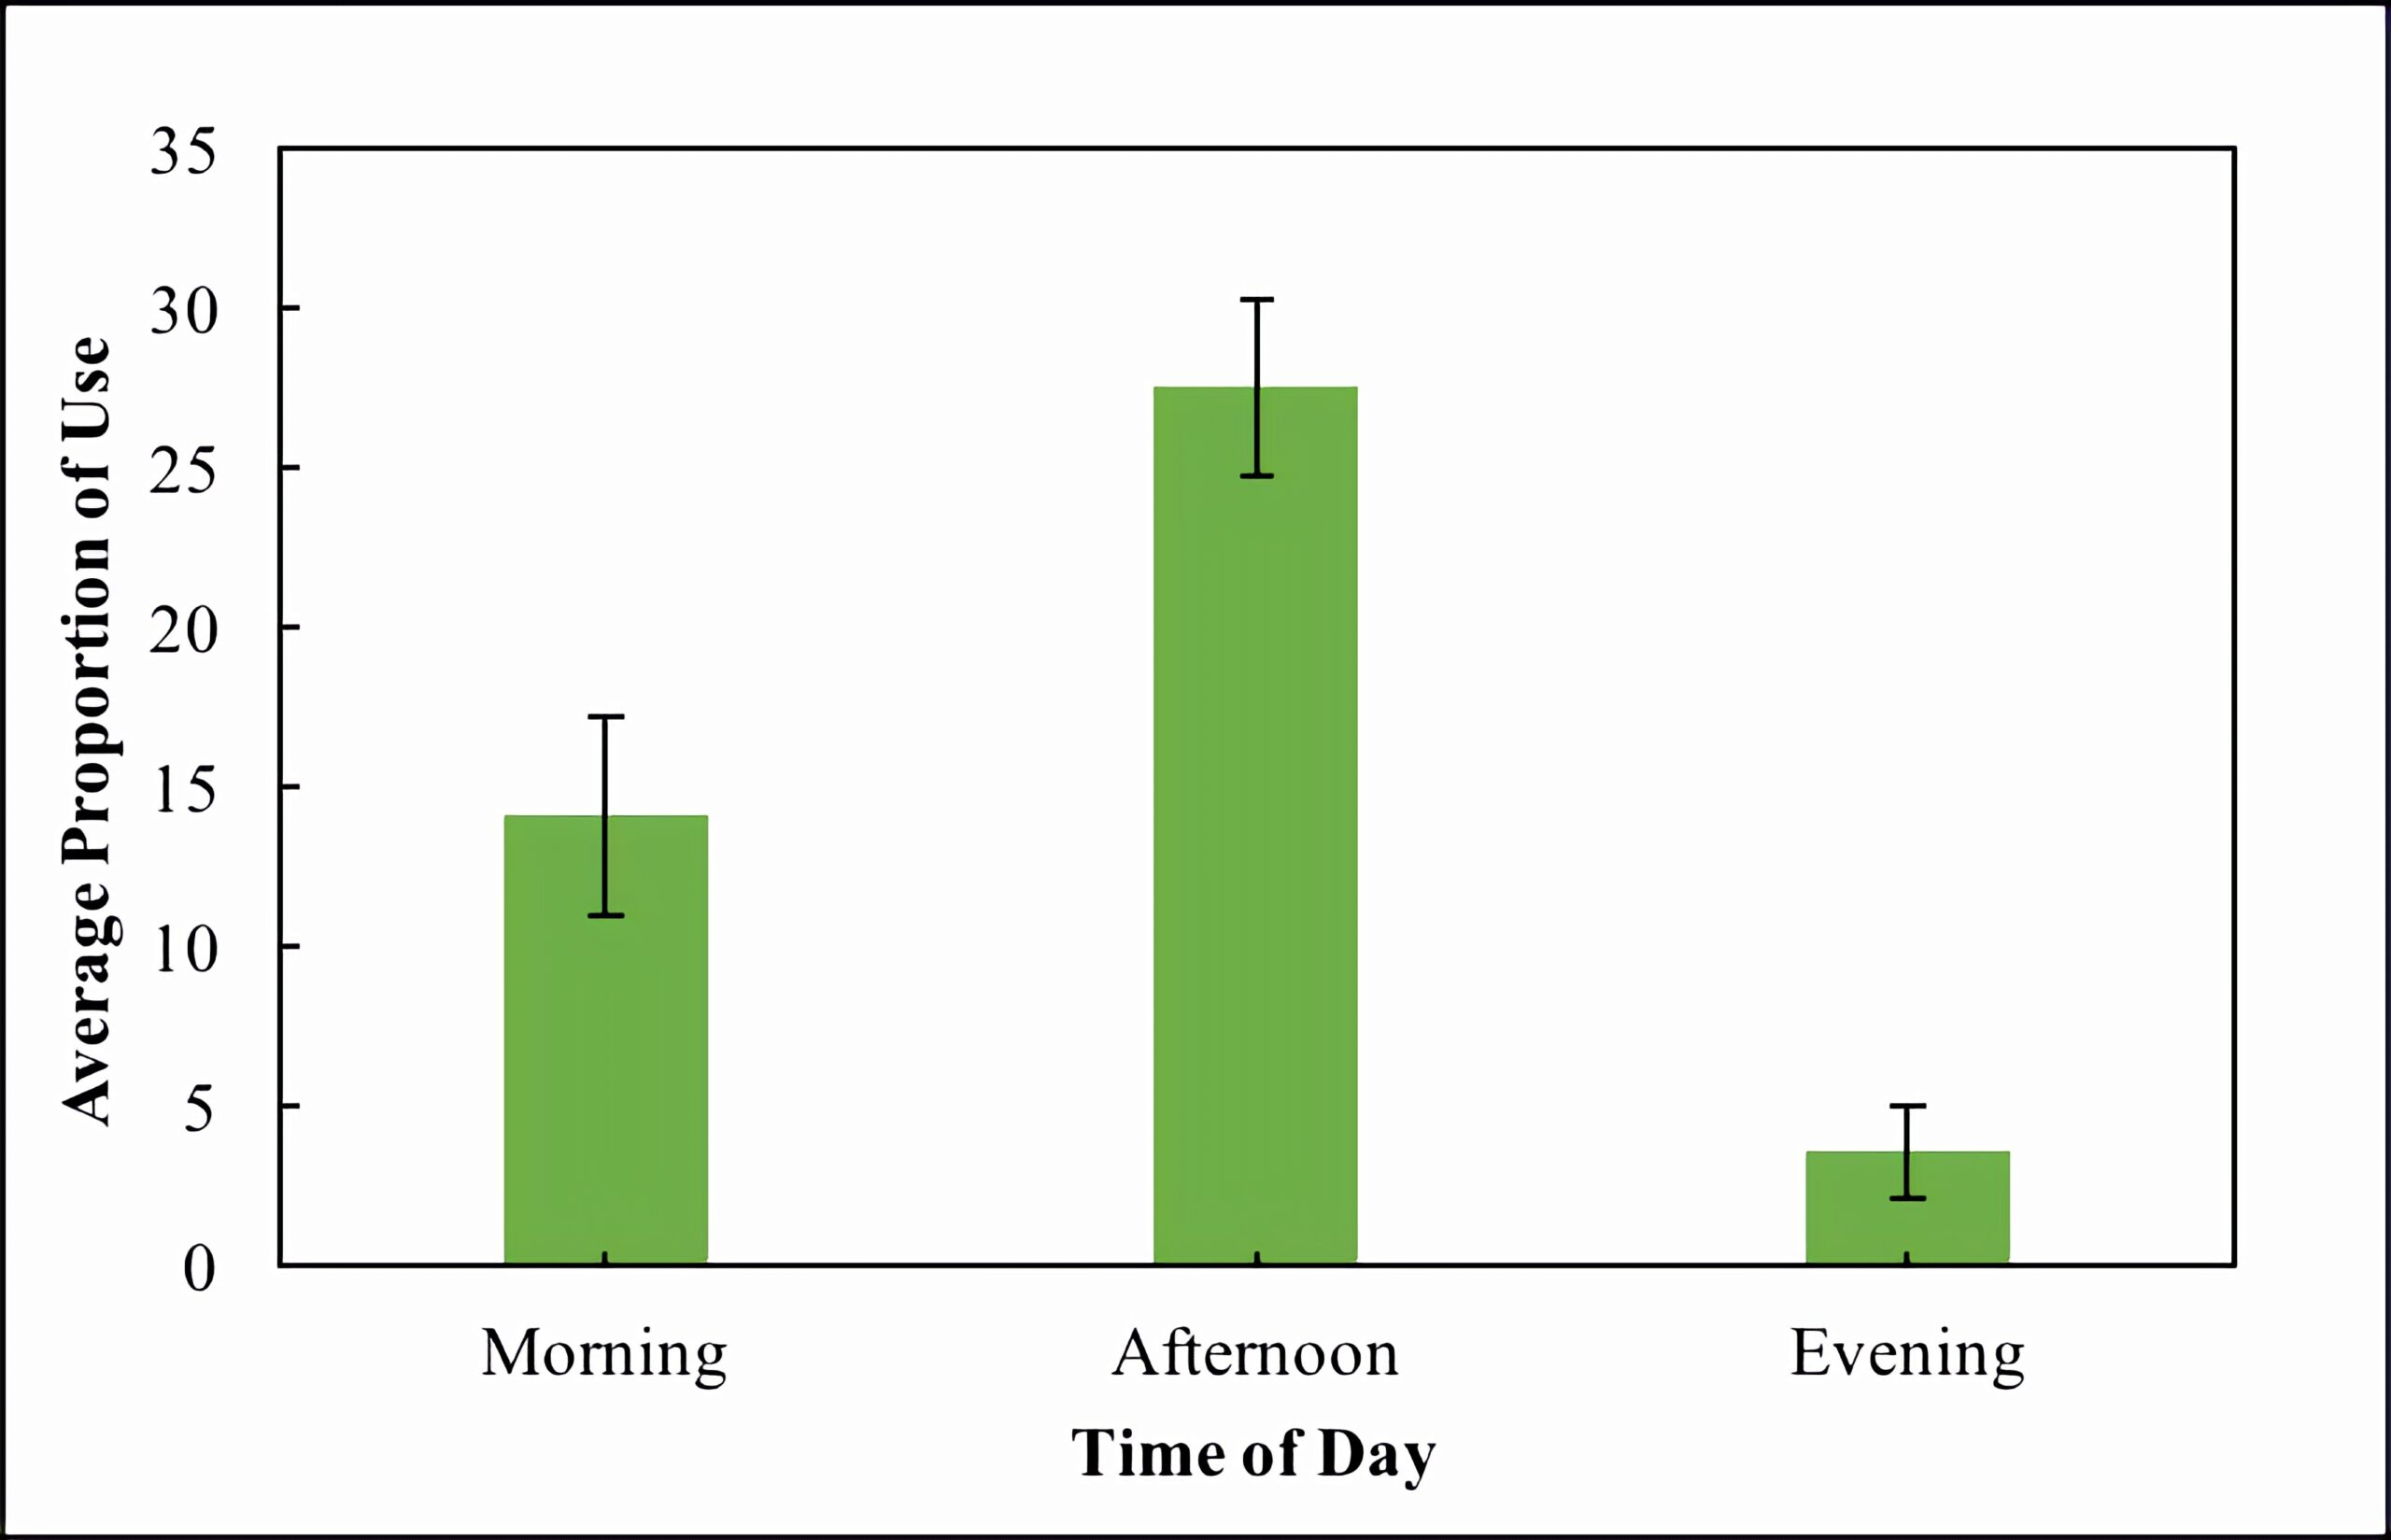
Figure 1. Average proportion of use (percentage of highest count) across all wetlands during three times of day: morning (sampling periods 1-7), afternoon (sampling periods 8-13), and evening (sampling periods 14-15). Standard error within categories is also shown.
Basking Use and Temperature.
All three wetlands followed similar patterns for basking use, with a total of 913 turtles captured at all three wetlands. The overall trend was an increase in basking use during the morning and into the afternoon, peaking at sampling period 9 (13:00) with an average proportion of 34.97 ± 7.5 (Figure 2). Basking use then declined in the afternoon and was very minimal during the evening (Figure 2). The pattern of basking use fits a parabolic trend (R2 = 0.91, Figure 2). Temperature followed an asymptotic trend (R2 = 0.91), increasing during the morning and afternoon, only beginning to decrease in the evening (Figure 2). Temperature was greatest at 17:00 with an average of 31.83 ± 0.3 °C (Figure 2). The parabolic trend of basking does not follow the trend of temperature throughout the day. A linear regression revealed that temperature had a somewhat significant impact on basking use (P-value = 0.039). The adjusted R2 value for this relationship was 0.23.
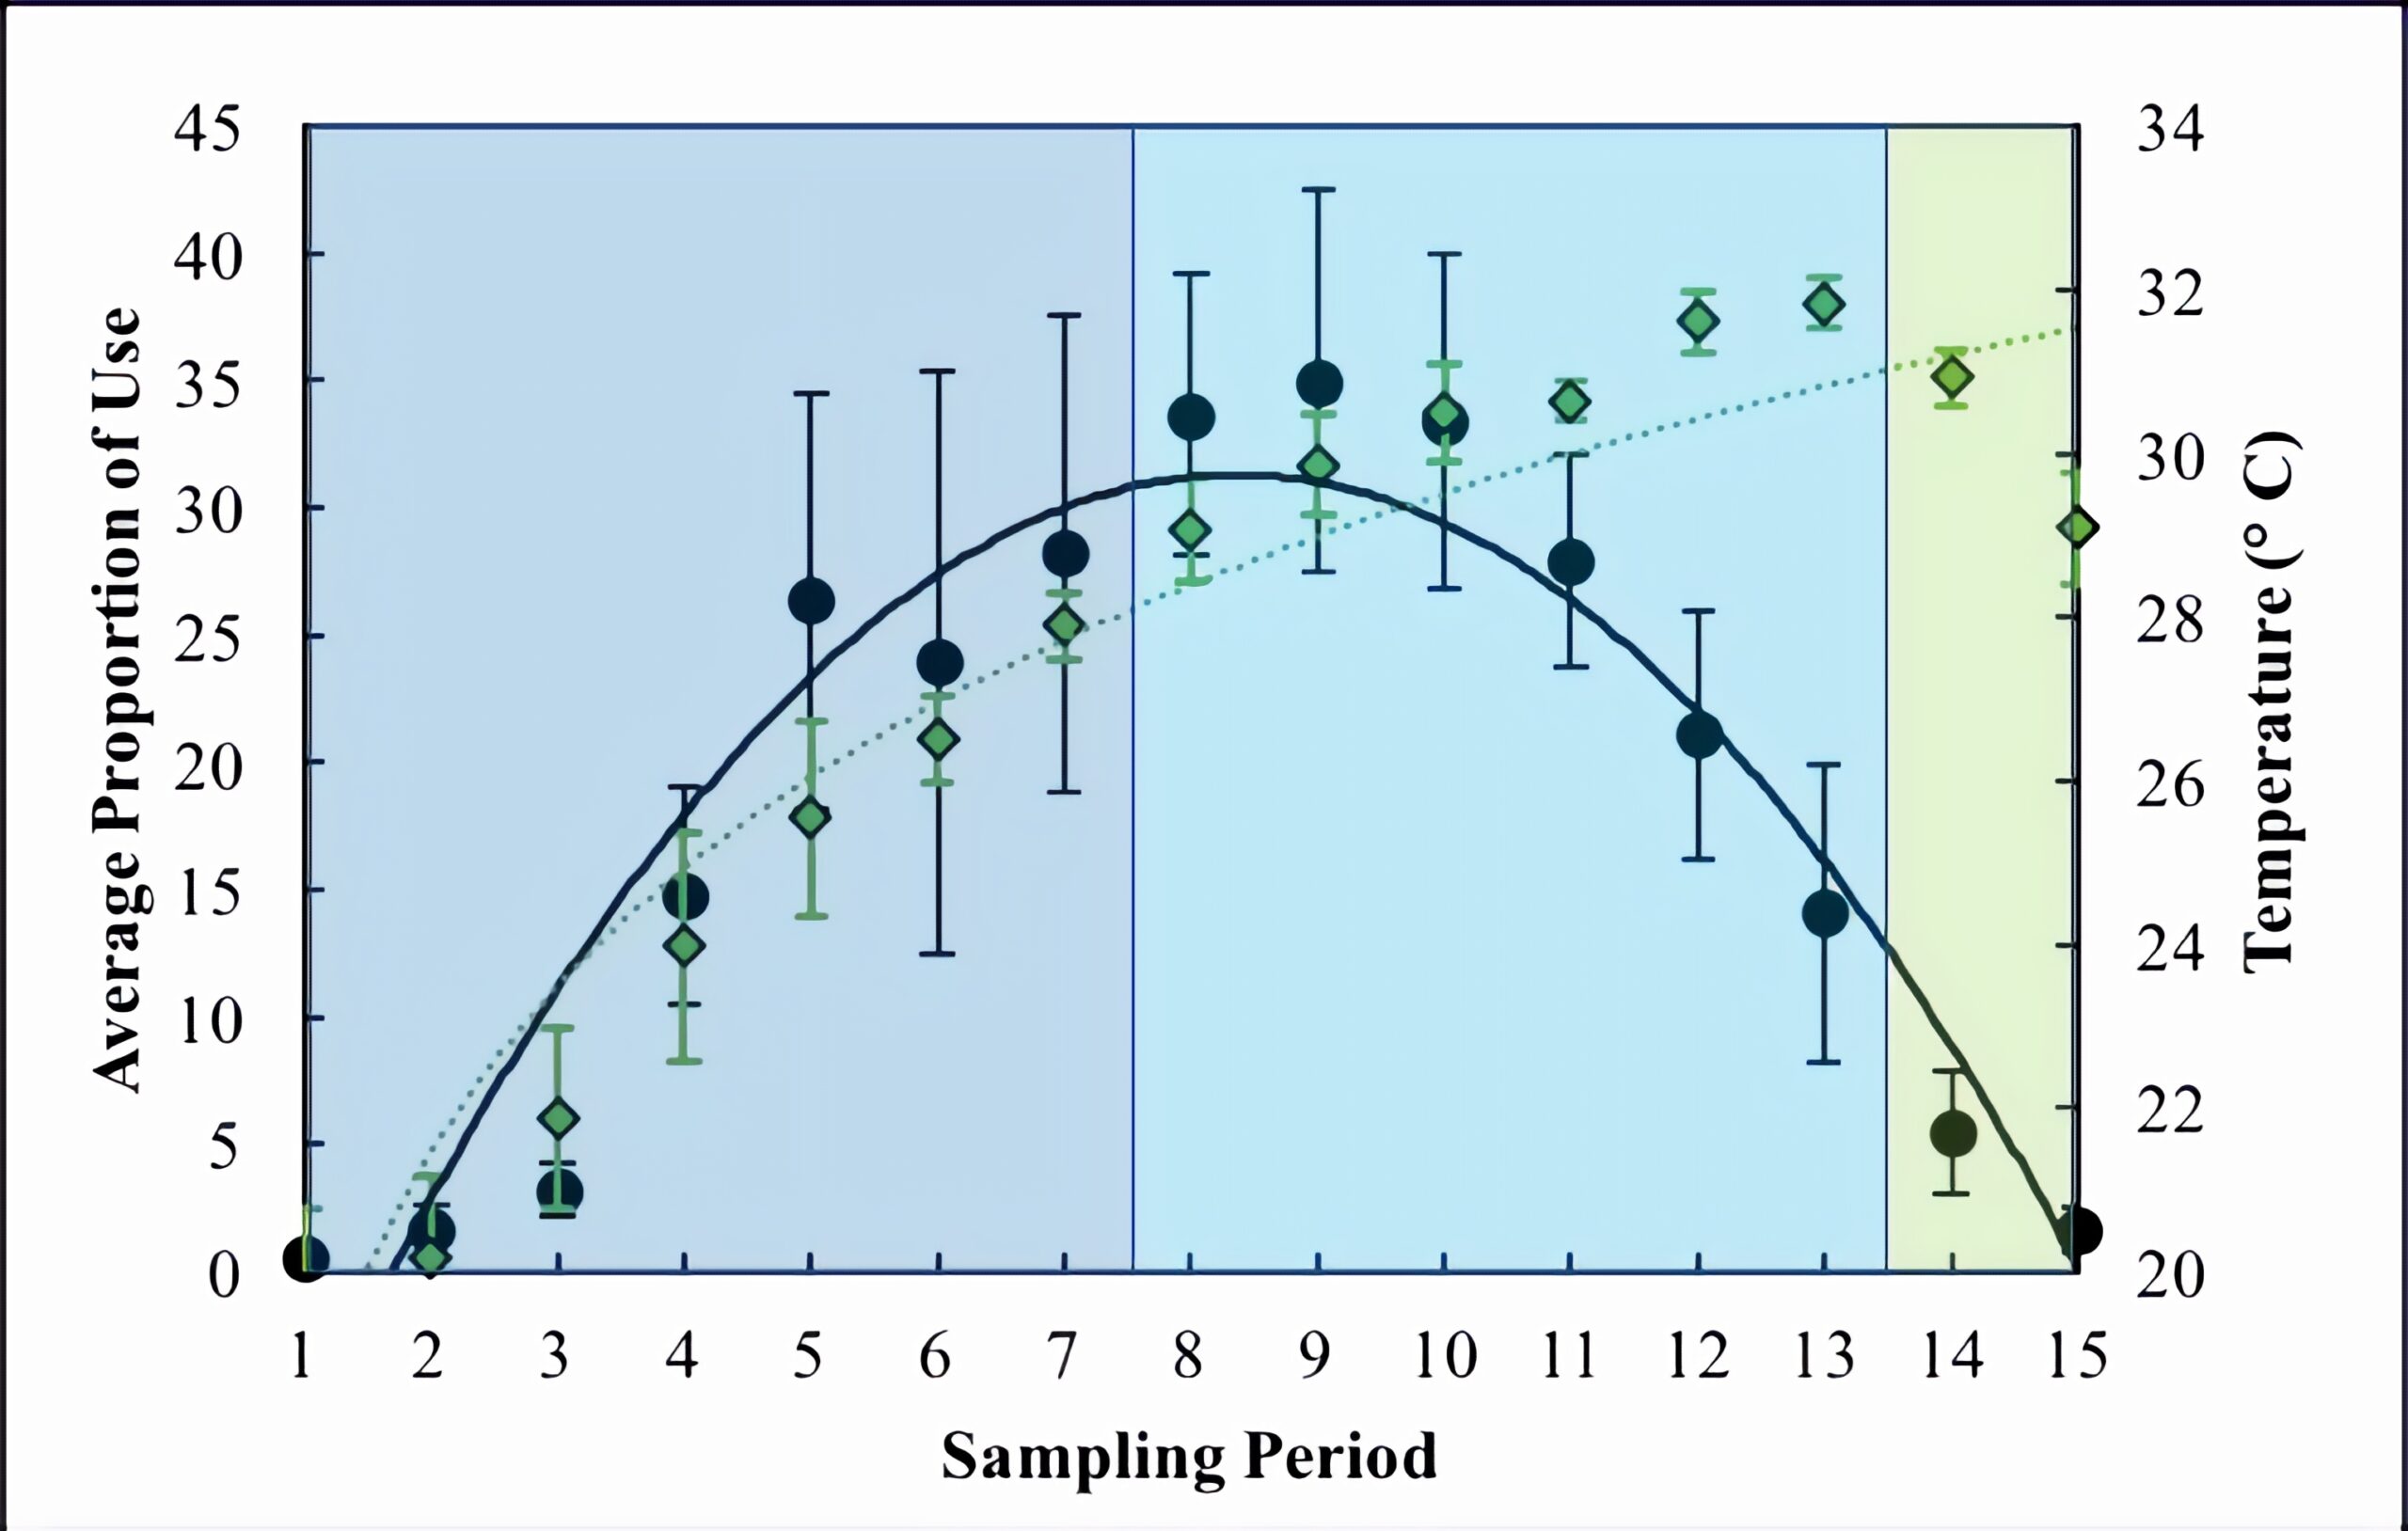
Figure 2. Average proportion of use (black circles) across days of sampling, cameras, and wetlands and average temperature of the preceding hour (green diamonds) across days of sampling and wetlands. Dark blue shading = morning, light blue shading = afternoon, and green shading = evening. Standard error is also shown.
Basking Use and Solar Irradiance.
Solar irradiance followed a parabolic trend (R2 = 0.95) with very little variation between wetlands and days (Figure 3). Solar irradiance peaked at sampling period 7 (11:00) with an average of 950.47 ± 2.69 W/m2 (Figure 3). The trend of solar irradiance largely follows that of basking use throughout the day (Figure 3). A linear regression revealed that solar irradiance significantly impacted basking use (P-value < 0.001). The adjusted R2 value for this relationship was 0.66, which is greater than that of temperature.
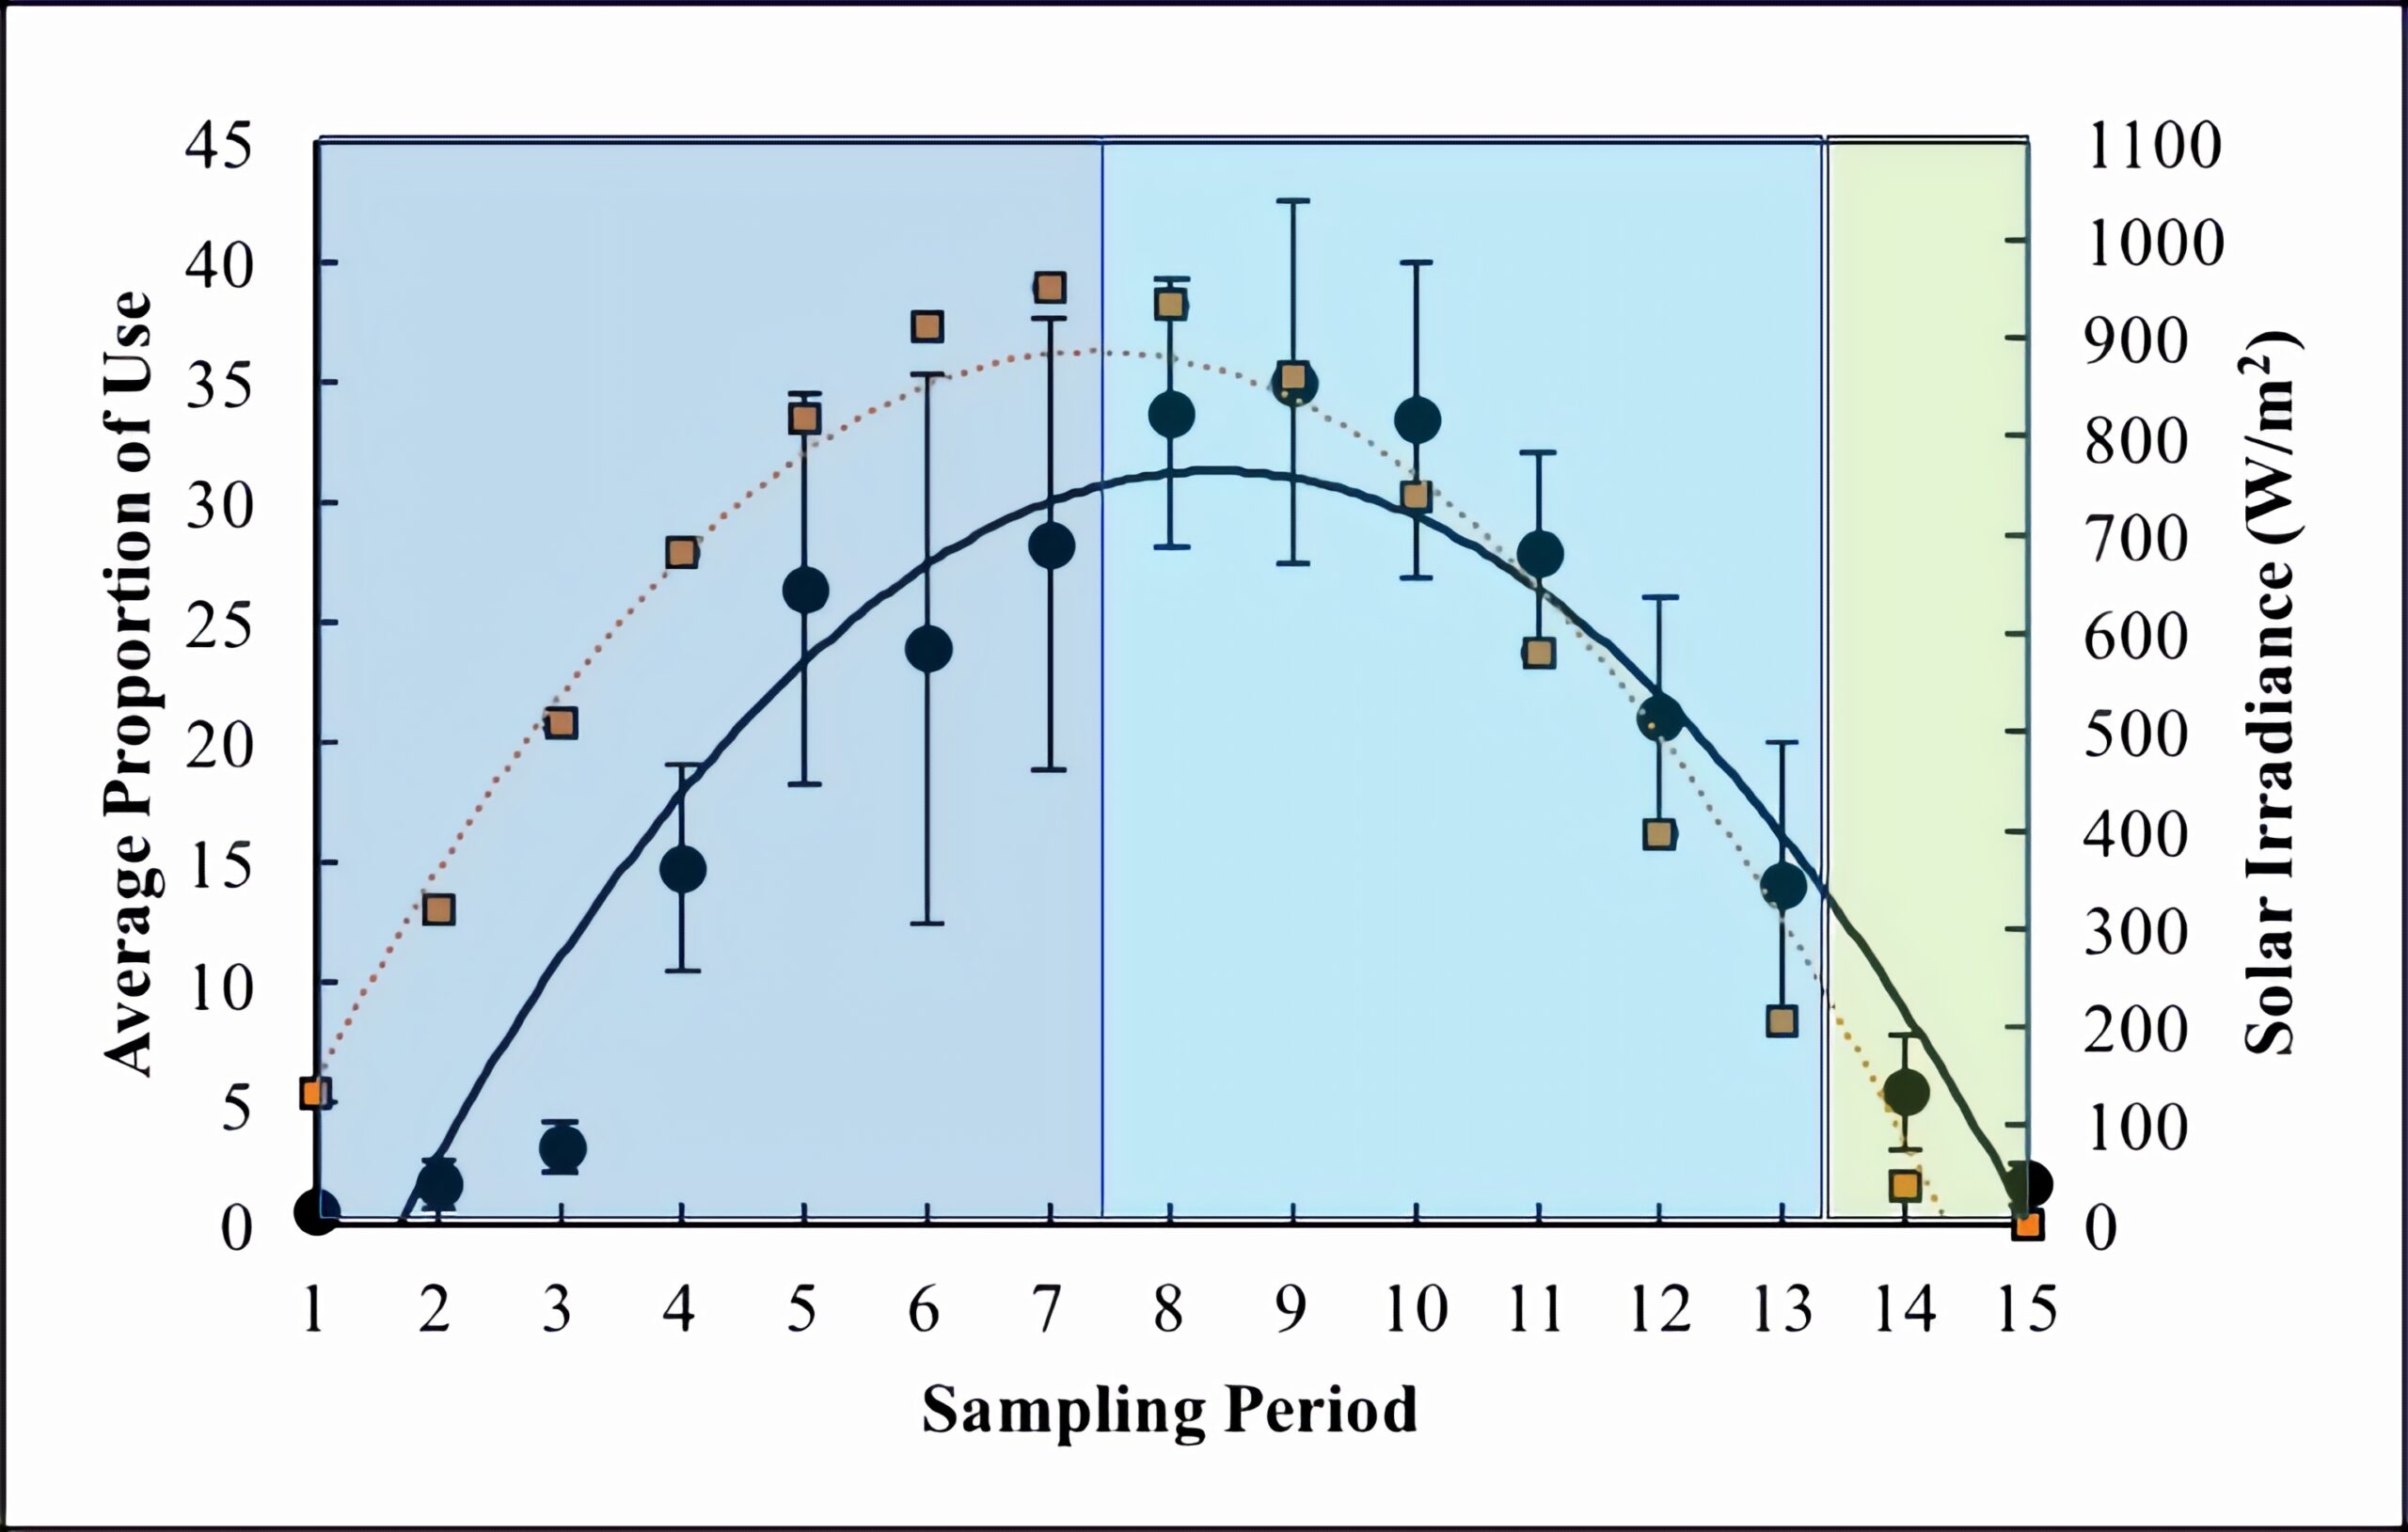
Figure 3. Average proportion of use (black circles) across days of sampling, cameras, and wetlands and average solar irradiance (orange squares) across days of sampling and wetlands. Dark blue shading = morning, light blue shading = afternoon, and green shading = evening. Standard error is also shown.
DISCUSSION.
Ecological Significance
Turtles need to bask in order to thermoregulate and to acquire vitamin D [5, 6]. In this study, basking use was greatest during the afternoon (Figure 1), when temperature was increasing and solar irradiance had just peaked (Figure 2-3). This effect is likely due to minimizing time spent basking and maximizing time for other life history requirements, such as foraging and mating [15]. Turtles are vulnerable to predation when basking; therefore, they are more likely to bask when they can make greater energy gains in a shorter amount of time. The basking use of T. s. elegans better follows the trend of solar irradiance as opposed to temperature (Figure 2-3) likely because it has more impact on their ability to regulate their body temperature and energy levels through basking. Turtles that do not maintain their body temperature and energy levels will be disadvantaged for completing other life history requirements [5].
It is possible that the observed parabolic trend of basking use (Figure 2) is due to a biological clock. Boyer, D.R. investigated this possibility by observing individuals of T. s. elegans in a lab where the light was changed to mirror the natural pattern of the sun [5]. Turtles became less active when “night” was induced, but immediately began to bask when the light was turned on, indicating that turtle basking habits are mainly influenced by external factors, such as light, as opposed to a biological clock [5].
Body size has not been found to affect the efficiency of energy gains in basking turtles, but it can influence competition [5]. The body size advantage of T. s. elegans makes the species a particularly dangerous invader as it allows them to out-compete smaller native species for basking sites [4, 6]. When native species are out-competed for this resource, they have less energy to forage, mate, and complete other life history requirements, further disadvantaging them in favor of T. s. elegans. Red-eared sliders are also known for their adaptability, which can favor them over native species that are more sensitive to ecological disturbances [6]. Understanding the basking behavior of red-eared sliders in their native habitats (ex. middle Tennessee) can provide insight into how their behavior changes when interacting competitively and how to mitigate their impacts on native species.
Limitations
In order to maximize the likelihood of capturing turtles, all available cameras were used at each wetland site, meaning wetlands could not be surveyed simultaneously. Wetlands underwent different weather conditions during their surveys, which could have affected basking use. However, wetland number was included as a random effect in the linear mixed model which accounted for variation in the data contributed by wetlands. Appropriate camera trap sites were limited by the location of structures on which to mount the camera relative to the location of basking sites. Where cameras were farther away from the basking site, it was more difficult to obtain counts.
Due to the nature of current camera trap technology, cameras are unlikely to detect turtles that do not bask as an observer is less likely to know where individuals will surface when aiming the camera and it will not be triggered by their motion. This leaves the methods used in this research restricted to studies of common basking species, while non-invasive technology for studying rare/non-basking turtle species remains limited.
Future Directions
Though solar irradiance appears to be an important factor driving basking use, it is important to investigate other factors that influence this timing. Environmental factors such as substrate, relative humidity, and wind and physical factors such as body size, shape, and color have been considered as possible influencers of basking use [5]. Future directions of this research also include studying changes as solar irradiance changes and during different times of turtles’ life history.
The limitations of PIR technology do not mean that camera traps cannot be used to effectively study ectothermic organisms; time-lapse technology can be an ideal alternative to traditional PIR sensors [9]. Utilizing camera traps with other field techniques (ex. basking rafts) would allow researchers to reliably assess a wider variety of ecological measures, such as occupancy or density and to utilize capture-recapture analyses [9]. One could use motion sensors to track trap frequencies of traditional hoop-net traps, a type of trap made of circular nets that are baited and left overnight, which would otherwise be undetectable by the observer.
Camera traps have the potential to revolutionize wildlife conservation. They are being used to document rare species, discover new ones, and take ecological measurements to a level of accuracy previously impossible [8]. Modifying the technology to make them more applicable for a wider variety of organisms will exponentially increase the opportunities researchers have to identify and conserve populations [8]. Beyond their research applications, camera traps are an excellent teaching tool and resource for raising awareness, which can further aid conservation campaigns [16].
ACKNOWLEDGMENTS.
This research was a collaboration between labs, programs, and universities. I would like to thank my advisors, Dr. Grigor, Dr. Jorge, and Dr. Sutton, as well as the other members of the School for Science and Math faculty, Dr. Brown, Dr. Eeds, and Ms. Dixon. Thanks also to the other members of my lab(s), Melissa, Dan, Dara, and Michelle. Thanks to the Tennessee Wildlife Resource Agency and Metro Parks for issuing research permits. A portion of this research was funded by the National Institute of Food and Agriculture McEntire-Stennis Capacity program. Finally, many thanks to my mentors, Kristy and Laura.
SUPPORTING INFORMATION.
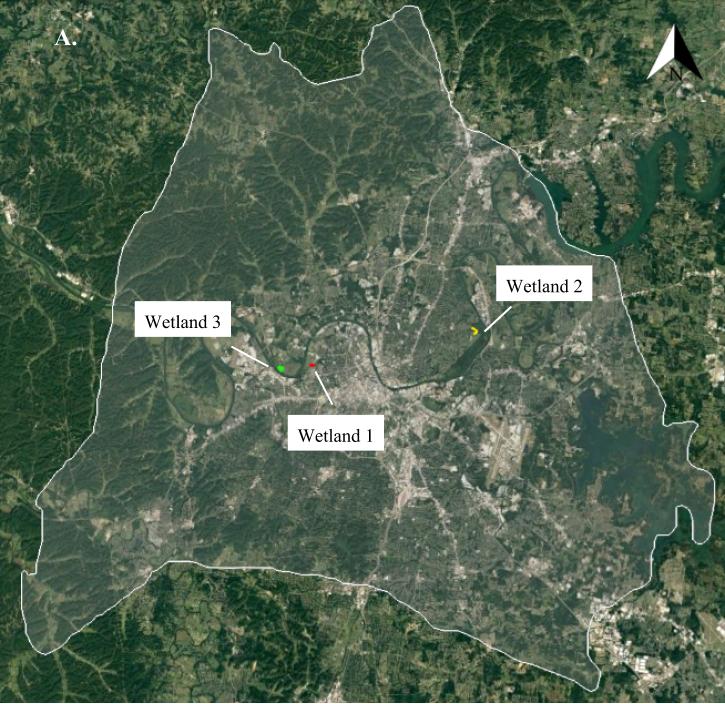
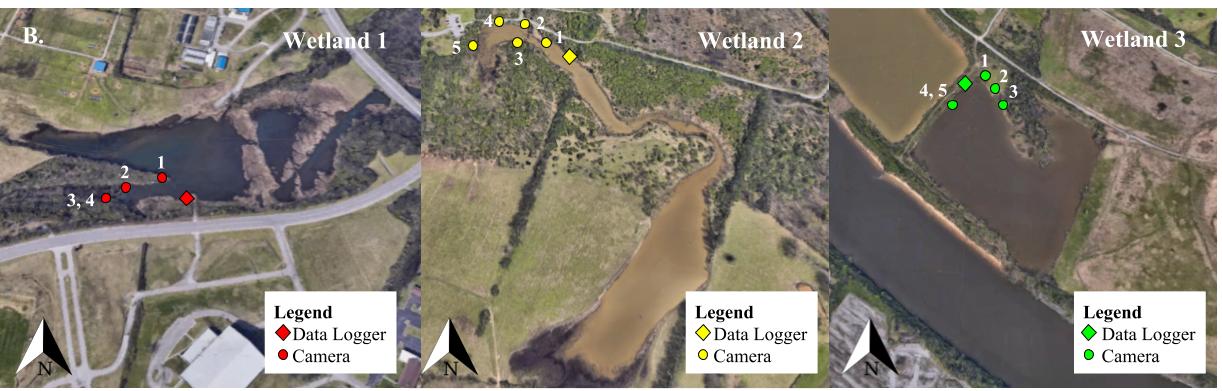
Figure S1. Wetland Sites and Camera Locations
REFERENCES.
- M. J. Gray, M. J. Chamberlain, D. A. Buehler, W. B. Sutton, “Wetland wildlife monitoring and assessment” in Wetland Techniques (Springer Science and Business Media Dordrecht, New York, vol. 2, 2013), pp. 245-274.
- Turtle Conservation Fund, A global action plan for conservation of tortoises and freshwater turtles. Strategy and Funding Prospectus 2002-2007. 2002, 1-30 (2002).
- M. N. Marchand, J. A. Litvaitis, Effects of habitat features and landscape composition on the population structure of a common aquatic turtle in a region undergoing rapid development. Conservation Biology. 18, 758-767 (2004).
- S. H. Pearson, H. W. Avery, J. R. Spotila, Juvenile invasive red-eared slider turtles negatively impact the growth of native turtles: implication for global freshwater turtle populations. Biological Conservation. 186, 115-121 (2015).
- D. R. Boyer, Ecology of the basking habit in turtles. Ecology. 46, 99-118 (1965).
- N. Polo-Cavia, P. Lopez, J. Martin, Competitive interactions during basking between native and invasive freshwater turtle species. Biological Invasions. 12, 2141-2152 (2010).
- M. T. Hobbs, C. S. Brehme, An improved trap for amphibians, reptiles, small mammals, and large invertebrates. PLoS One. 12, (2017).
- M. Trolle, A. J. Noss, J. L. P. Cordeiro, L. F. B. Oliveira, Brazilian tapir density in the Pantanal: a comparison of systematic camera-trapping and line-transect surveys. Biotropica. 40, 211-217 (2008).
- R. D. Bluett, B. Cosentino, Estimating occupancy of Trachemys scripta and Chrysemys picta and time-lapse cameras and basking rafts: a pilot study in Illinois, USA. Transactions of the Illinois State Academy of Science. 106, 15-21 (2013).
- R. D. Bluett, E. M. Schauber, Estimating abundance of adult Trachemys scripta with camera traps: accuracy, precision and probabilities of capture for a closed population. Transactions of the Illinois State Academy of Science. 107, 19-24 (2014).
- Solar Calculator (2018). (available at http://meteoexploration.com/products/SolarCalculator.html)
- METARs (2018). (available at http://aviationweather.gov/metar)
- P. G. Oguntunde, O. J. Olukunle, O. A. Ijatuyi, A. A. Olufayo, A semi-empirical model for estimating surface albedo of wetland rice field. Agricultural Engineering International. 9, (2007).
- D. Bates, M. Machler, B. Bolker, S. Walker, Fitting linear mixed-effects models using lme4. Journal of Statistical Software. 67, 1-48 (2015).
- K. M. Crawford, J. R. Spotila, E. A. Standora, Operative environmental temperatures and basking behaviors of the turtle Pseudemys scripta. Ecology. 64, 989-999 (1983).
- Camera Traps (2018). (available at http://www.worldwildlife.org/initiatives/camera-traps).
Posted by John Lee on Tuesday, December 22, 2020 in May 2019.
Tags: Biological clocks, habitat degradation, invasive species, physiological responses, thermoregulation