Tracking Provenance of Glacial Sediments in Ong Valley, Antarctica
ABSTRACT
Glacial melting has a large effect on global water systems. Understanding past motion of ice sheets in Antarctica helps us make better predictions of future change. This project focused on Ong Valley, Antarctica, looking for changes in ice flow over time. Ong Valley has three distinct glacial tills that record up to 7 million years of glacial history. Samples were collected from soil pits in each glacial drift, beyond the oldest drift, and on the hillside. Four analyses were used to compare the samples’ composition. Similar results between the drifts would indicate that the glacier flowed in the same path each time. Samples were burned to determine percentage composition of organic material in the sediment, run through a Malvern machine to calculate grain size of the sediment, and x-rayed for overall elemental composition. Finally, mass spectrometry of Uranium-Lead ratios from laser-ablated zircon were used to estimate the ages of the sediment. All tests revealed close similarities in chemical composition between the three drifts, and more differences between the till and non-till samples. The ice moved in the same path every time it moved. The difference from the hill samples means the similarities were not from particles transported by the wind.
INTRODUCTION.
Many resources have been affected by climate, including food. Changes in temperature and precipitation have had negative effects on agricultural productivity, especially in the tropical regions of Earth [1]. To adapt to these changes, farmers turn to science [2]. Research on how climate change will warp our future is used by workers in the primary sector to adapt their practices to an ever-changing environment [2].
Glaciers have gained awareness in the environmentalist movement, and for a good reason. Due to their niche environment glaciers have been highly affected by climate change. Glacial volume has decreased since the 1960s [3]. Since then, there has been a continued acceleration of glacial melting [3]. Glacier’s sensitivity gives scientists a quantifiable measure of how climate change impacts the Earth. Antarctica provides a unique environment that preserves ancient ice and sediment. The low temperatures and precipitation levels leave the landscape mostly untouched, aside from wind erosion [4]. Since till is so well preserved in Antarctica, it is ideal for getting an accurate picture of the world’s terrestrial evolution. This lab has previously analyzed the ice from Ong Valley, but not done an in-depth analysis on the till in the valley [5]. Sediment has more components than ice, which provides opportunities for more varied types of analysis.
There were two goals for this research. The first was to look for changes in the tills over time by comparing the till from the three drifts in the valley. The second was to compare the tills to the hills to confirm the results were not affected by anything other than the glacier. The first hypothesis of this study is that the till will indicate that the Argosy Glacier only ever flowed in one path. The results that indicate this would be similarities in the chemical compounds that make up the tills. The second hypothesis is that the hills will be different from the tills. Using the hills as a control group will reduce the probability that any results seen from the till were due to environmental influences other than the glacier.
MATERIALS AND METHODS.
Collection Site. Ong Valley is in the Transantarctic Mountains [5]. 23 till samples were collected; six each from the Young, Middle, and Old Drifts, three from past the Old Drift, and two from the hillside (Figure 1). The samples were collected from 11 hand-dug pits, one sample from the top of the pit and one sample from deeper down, the exception being Pit 207 with 3 samples taken. The samples were taken in November/December of 2017. The samples from the drifts are till from moraines, and the samples from past the Old Drift and from the hillside are not till.
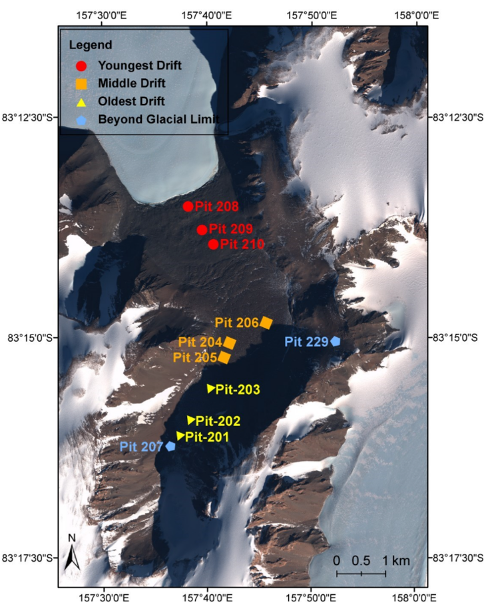
Figure 1. Birds-eye view of Ong Valley. The figure shows an overhead view of Ong Valley. The Argosy Glacier that created the valley is shown in the top left corner. The legend shows which samples came from which section of the valley. Dig sites are marked and labeled with the pit names.
Tills. The 18 till samples were analyzed for grain size, elemental composition, and carbon content to try and find changes in the till from the glacier or weathering. Each till was sifted to 2 mm. The samples were processed through a Malvern Mastersizer 3000 for grain size, an X-Ray Fluorescence (XRF) machine for elemental composition, and burned in an oven for organic carbon. The tills were already tested for zircon age, so the results from that study were used [5].
Hills. The 5 hill samples were analyzed for grain size, elemental composition, and carbon content using the same methods used for the tills. The hill samples had not been analyzed for zircon age, so they were analyzed in this study. Zircon was isolated from samples using multiple processes based on the properties of zircon. The samples were sifted to 250 µm, sonicated, separated with a hand magnet, separated by density, separated magnetically with a machine, and put through nitric, hydrofluoric, and hydrochloric acid treatments. The nonmagnetic and dense materials were the desired sample parts.
Next, the samples were mounted in epoxy and sanded with an MA4972450 EcoMet 250/300 Grinder Polisher AutoMet 250/300 Power Head. Once sanded down, the samples were imaged by a Scanning Electron Microscope to make a computer-generated mosaic image. This image was used for the laser ablation.
Finally, the samples were run through an LA-ICP-MS. This obliterated selected spots of zircon, and the gas that was released from the obliterated zircon was measured using mass spectrometry.
Statistical Analysis. Glitter, a statistical analysis program, was used to analyze the raw data from the zircon. The program shows a chart for each obliterated point with lines bordering what part of the data is analyzed. The bars are adjusted to encase a section that gives a concurrent age for the first three analyzed elemental ratios, within 20% of each other. When all spots are adjusted, the ages are pasted in a spreadsheet. Zircon that did not have concurrent ages within 20% of each other were saved separately and not analyzed for this paper.
RESULTS.
Till. The grain sizes show a decrease in average grain size going from the Old to the Young Drift. The Old Drift till show the most similarity between the high and low samples. The till samples show similar levels of silt and fine sand, with more variability in clay and medium and coarse sand. The average grain size of the sediment increased as the distance from the Argosy Glacier increased. The Young Drift till averaged 81 µm, the Middle Drift till averaged 88 µm, the Old Drift till averaged 131 µm (Figure 2).
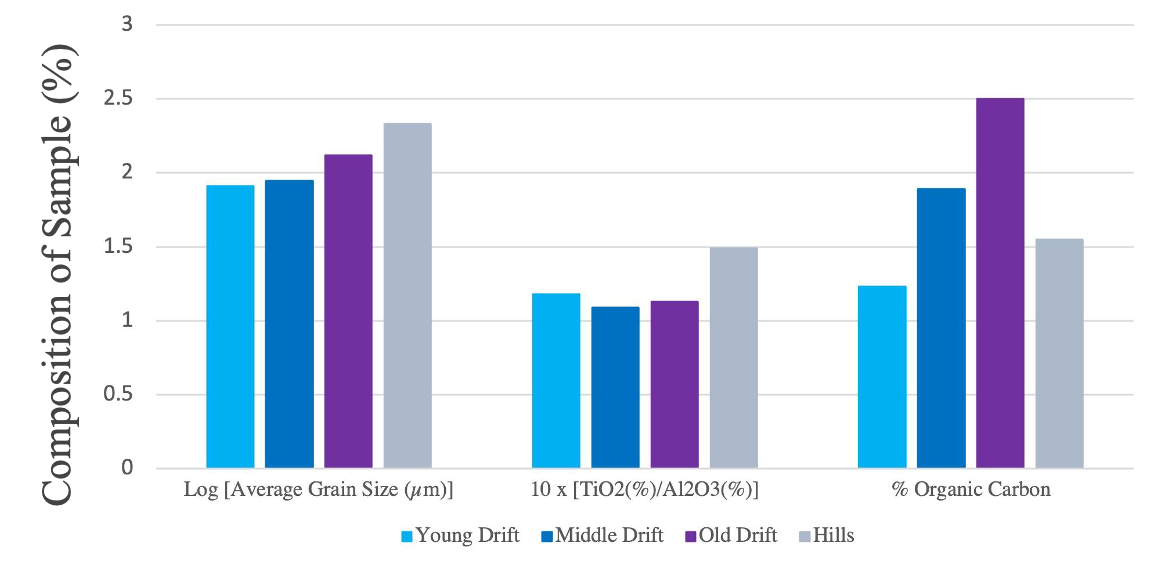
Figure 2. Comparison of grain size, elemental composition, and organic carbon in every sample section. The log was taken for grain size and the elemental composition was multiplied by 10 to better show the data in comparison with each other.
When the percentage of the elemental oxides Aluminum Oxide (Al2O3) and Titanium Oxide (TiO2) were compared, there was little variability between the sediments. There is a positive linear trend but the range is about 1% and the domain is about 2%, so there is little difference. There was a slight clumping by drift (Figure 2).
The samples averaged a weight of 21.8 g before burning. After burning, they averaged 21.5 g. Both averages had a standard deviation of 3.3 g. The average weight of carbon material burned off was 0.4 g (STDEV=0.2). This brings the average percentage lost to 2% of material (STDEV=1.1). The specific percentages are as follows: Youngest Drift, 1% lost; Middle Drift, 2% lost; Oldest Drift, 3% lost. There is an upward trend, but it is insignificant (Figure 2).
The ages of the till line up with each other. They lay almost completely on top of each other. More detail will be given when the hills are discussed given this data is from previous research [5] (Figure 3).
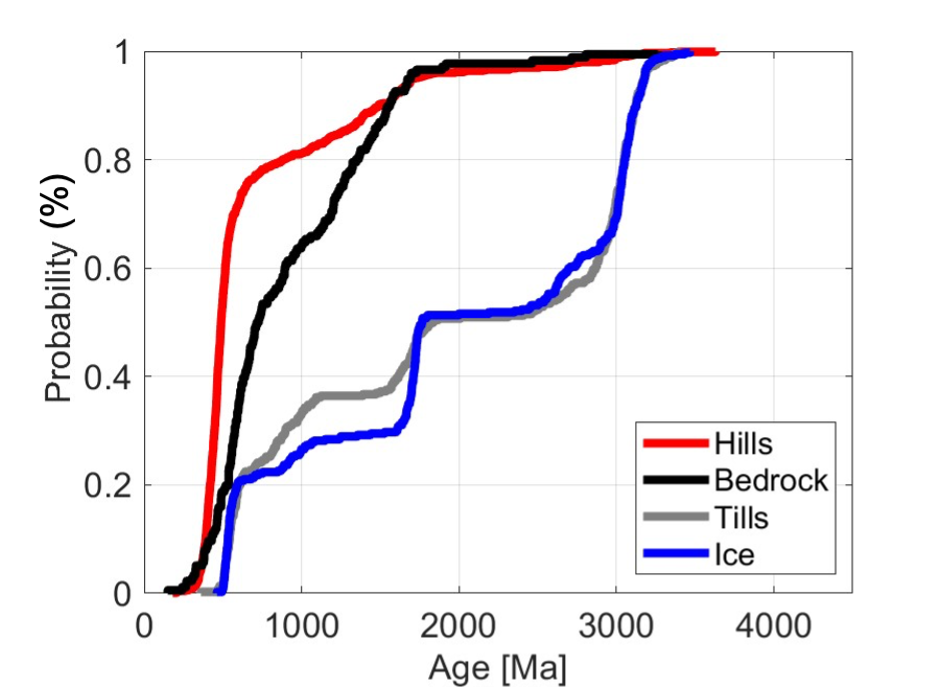
Figure 3. Ages of Samples. The graph shows the predicted ages of the different sample types according to the mass spectrometry from the laser ablation of zircon. These results are shown after data analysis through Glitter and run through Matlab.
Hills. The hill samples were different from the till samples in grain size. The average grain sizes of the hills were larger than that of the tills. The hill sediment averaged 215 µm. Grouped by sediment type, the hill sediment (215 µm) averaged over two times bigger grain sizes than the Drift till (100 µm)(Figure 2).
When comparing TiO2 and Al2O3, the hills were scattered and had higher percent composition of these elements than the tills. The hills still follow the slight upward trend seen also in the tills (Figure 2). The hills had 2% of their mass lost when burned. This translates to 2% of the hill samples being organic material. The hills are within the range of the tills but does not follow the trend of the tills (Figure 2).
The ages of the hills do not match the tills. The hills have a significantly different age estimate than all of the tills and when the tills are combined. Using data from the past study, the hills line up with the age estimates of the bedrock in Ong Valley, and the tills line up with the ages of the ice from Ong Valley [5](Figure 3).
DISCUSSION.
The goals of this study were to look for changes in the tills over time by comparing the till from the three drifts in the valley, and to compare the tills to the hills to confirm the results were not affected by anything other than the glacier.
Tills. The first hypothesis was that the glacier only ever moved in one path. The average grain size increased with age, likely due to the wind, not from changes in the Argosy glacier’s flow. The tills likely started off with the same grains sizes when they were deposited, so the increase in grain size over time could be from losing smaller grains over time. This could be from the wind or boulders disintegrated and added coarser sand to the tills.
When comparing TiO2 and Al2O3 there is a positive trend between the percentage composition of the elements. The samples bunch generally by till unit, but all of the units are close to each other. The lowest ratio is in the Middle Drift, then the Old Drift, then the Young Drift. This is different than the expected trend of TiO2 and Al2O3 increasing over time as dust settles on the tills.
Previously, this lab has not tested for organic carbon in Antarctic sediment due to an assumption that it did not exist there, so the existence of carbon is surprising. Thus, it is expected that organic carbon would increase over time as dust settles onto the tills. Nothing is growing in the environment at Ong Valley, but dust does have some small organic components that slowly would add to each unit. The expected increase over time occurred in the tills.
The age estimates of the three drifts line up with each other. This indicates that the sediment in the valley has been around for the same amount of time. The till ages also match the ages of the ice from the valley. This makes sense because the till and the ice were moved and deposited by the glacier together.
The similarities between the tills in grain size, chemical composition, organic material, and age confirm the hypothesis that the Argosy Glacier only moved in one path. Showing similarity in four different tests emphasizes that the till has not changed. Since the till is the same, it must have come from the same place. If the glacier moved in multiple paths the till would differ by where it was picked up from. However, the till is the same so the glacier is unlikely to have moved in more than one way.
The results of this study support the results of this labs previous study on Ong Valley ice cores [5]. As beforementioned, the ice and till were picked up, moved, and deposited together by the Argosy Glacier. Over time, deposited ice in the valley has sublimated, but what was collected still looks similar to the till collected from the same place.
Hills. The second hypothesis was that the hills would be different from the tills, confirming that any components of the till were affected by the glacier and not from a different source.
In grain size, the tills are different from the hills. The hills are composed of every size sand, while the tills lean more towards the fine sand. The difference in grain size suggests the wind has not redistributed all of the sediment and made the sediment the same size.
When looking at TiO2 and Al2O3, the hills are not as close to the tills as the tills are to each other. The hills are also more spread out on the graph. The hills have the highest ratio between TiO2 and Al2O3 which is consistent with them being the oldest deposits in Ong Valley. The older the sediment, the more time there is for dust particles to settle.
Surprisingly, the hills do not have the most organic carbon. The expectation that the organic material comes from settled dust is complicated by the hills having lower organic content than the middle and oldest drifts. Following this reasoning, the hills should have the highest content from being exposed the longest.
The hill ages are less similar to each other than between the tills, but they still match each other more than they match the tills. The hill ages are similar to the ages of the bedrock. Like the ice and till relation, this makes sense. The hills have not been moved by glaciers, and the bedrock is too deep to be affected. These are similar in age because they were established around the same time and neither has been largely changed.
These differences between the tills and hills confirms the second hypothesis. Since they are different, this reduces the chance that the till results were skewed by environmental factors. If the hills were similar to the tills, the similarity between the tills could have been due to a widespread event such as a large settling of dust that would make the sediment the same.
Limitations. The limitation of this study is human error. The zircon picked to be obliterated were chosen by hand, which could vary which zircon were chosen. This is unlikely to largely affect the results because the sample was sprinkled on the epoxy at random, mixing and spreading the sediment. Human error was also introduced in the Glitter statistical analysis. The ranges to analyze of the mass spectrometry were adjusted by hand to get the dates withing 20% of each other, and again while this should not have too much variation once in that 20%, the chosen ranges would vary based on the person who adjusts them.
Future Directions. Glaciers on the interior of the continent could be compared to glaciers on the edges and closer to the ocean. These glaciers could be affected by rising sea levels and global temperatures at different rates. One could also have more of an influence on global climate than the other. These potential studies could further the knowledge we have about the greatest concerns due to climate change.
A specific comparison between Antarctic glaciers could be how glaciers move in different parts of Antarctica. Geographic differences could potentially impact movement. The West Antarctic Ice Sheet (WAIS) is not on as much land as the East Antarctic Ice Sheet (EAIS) is. It is also at a lower altitude. The Transantarctic Mountain Range is between the two ice sheets and has a higher amount of surface soil and lower amount of surface ice. Factors to study between these sections of Antarctica could be the differences in elevation, amount of area based on the continent, or speed and frequency of winds. For example, the results from this study in the Transantarctic Mountains can be compared to results from a 2005 study on glacial movement in the Ross Embayment, a part of the WAIS [7].
CONCLUSION.
The sediment itself did not change over time. The measurements of grain size, XRF, organic carbon, and ages of the samples have little variability between dig sites, indicating the composition of the sediment did not change over time. Stability in sediment composition indicates that the movement of the glacier was consistent. If the sediment changed, it would indicate that at one point the glacier moved on a different path as it would pick up sediment with different composition.
ACKNOWLEDGMENTS.
Thank you to Daniel Morgan, Courtney E. Megerian, Richard W. Bradshaw, and Jess L. Raff for helping conduct this research. Thank you to the Polar Rock Repository, the National Science Foundation, and the U.S. Antarctic Program for funding and providing samples for this research. Thank you to the School for Science and Math at Vanderbilt for providing and coordinating this amazing opportunity. And a special thank you to my SSMV advisor Rebekah Stanton for guiding me through the whole way.
REFERENCES.
- P. Kurukulasuriya, S. Rosenthal, Climate Change and Agriculture: A Review of Impacts and Adaptations. Climate Change Series, Environment Department Papers, World Bank. 91, (2003).
- T. A. Crane, C. Roncoli, G. Hoogenboom, Adaptation to climate change and climate variability: The importance of understanding agriculture as performance. NJAS – Wagen. J. Life Sci. 57, 179–185 (2011).
- M. B. Dyurgerov, M. F. Meier, Twentieth century climate change: Evidence from small glaciers. PNAS. 97, 1406–1411 (2000).
- K. J. Licht, A. J. Hennessy, B. M. Welke, The U-Pb detrital zircon signature of West Antarctic ice stream tills in the Ross embayment, with implications for Last Glacial Maximum ice flow reconstructions. Antarctic Science. 26, 687–697 (2014).
- T. Bibby, J. Putkonen, D. Morgan, G. Balco, D. L. Shuster, Million year old ice found under meter thick debris layer in Antarctica. Geophysical Research Letters. 43, 6995–7001 (2016).
- Ong Valley, Antarctica – GeoYP.com. (available at https://geoyp.com/29/ong-valley-2411585/. [Accessed: Nov. 10, 2022].
- K. J. Licht, J. R. Lederer, R. Jeffrey Swope, Provenance of LGM glacial till (sand fraction) across the Ross embayment, Antarctica. Quaternary Science Reviews. 24, 1499–1520 (2005).

Posted by John Lee on Tuesday, May 30, 2023 in May 2023.
Tags: Antarctica, detrital zircon, Ong Valley