The role of fructose in the expression of extracellular matrix markers and cytokines released by M1 and M2 macrophages that regulate the progression of nonalcoholic fatty liver disease
ABSTRACT
More than 10% of the US population is affected by non-alcoholic fatty liver disease (NAFLD). This disease, linked to factors such as obesity and diabetes, begins with steatosis, an accumulation of lipids in the liver. It escalates in the form of liver inflammation and collagen deposition, also known as non-alcoholic steatohepatitis (NASH), and eventually leads to cirrhosis of the liver. It is known that the sugar fructose plays a role in the development NAFLD, but the mechanisms through which fructose achieves this remain uncertain. A cell type that progresses NAFLD is macrophages, immune cells that engulf and digest substances through phagocytosis. When activated, macrophages secrete cytokines, some of which promote NAFLD and cirrhosis of the liver. Macrophages can be polarized to M1, pro-inflammatory, or M2, anti-inflammatory, but studies show the inflammatory M1 macrophage as more present in models of NASH. Activated macrophages are known to express tissue inhibitors of metalloproteinases (Timp1), which inhibits protease activity of scar matrix and is elevated in humans and mouse models of NASH. We hypothesized that fructose would induce the expression of extracellular matrix genes (Timp1) in M1 macrophages. In order to see the effect of fructose on the activation of macrophages, we quantified the expression of specific markers of polarized macrophages in fructose or glucose conditions. M1 macrophage polarization was confirmed through the markers Tnfα. M2 macrophage polarization was confirmed through the marker ArgI. The expression of genes Il10 and Timp1 were also quantified. Results from two trials revealed increased expression of Il10 and Timp1 in the fructose treatment for both polarization states. Furthermore, fructose increased Tnfα gene expression in the M1 polarized macrophages. The increase in cytokines and Timp1 in macrophages may explain the progression of NASH in the presence of fructose.
INTRODUCTION.
With an estimated 24% world prevalence and over 64 million people affected within the United States, Nonalcoholic fatty liver disease (NAFLD) has become an impending concern of health in today’s society [1]. The progression of this disease is linked to a variety of factors, including diabetes, obesity, and insulin resistance [2]. NAFLD can lead to the damaging and stiffening of the liver and is caused by a source other than high alcohol consumption. The first stage is known as steatosis, which occurs when lipids accumulate in liver hepatocytes. This then progresses to nonalcoholic steatohepatitis, (NASH), where an influx of inflammatory cells and collagen deposits are present in the liver. The final stage of the process, known as cirrhosis, is characterized by fibrosis and an abnormal structure [3]. The specific causes relating to this disease remain largely unknown. Research has not yet yielded a reason as to why some people accumulate fat in the liver while others do not. Similarly, there is limited understanding of why some fatty livers develop inflammation that progresses to cirrhosis [2]. But one thing is certain, a liver with cirrhosis remains unable to function normally [3]. The scar tissue replaces the healthy tissue and hinders blood flow, and this change is typically irreversible. With the important role the liver plays in maintaining health, this is detrimental. Over the years, correlations have been drawn suggesting that high fructose consumption is a major contributor to the increase in NAFLD [4, 5].
Fructose is a monosaccharide and a sweet tasting sugar that is found naturally in fruits and some vegetables. Today, the principal source of fructose in the American diet is high fructose corn syrup (HFCS). Industrially, HFCS is frequently found in soft drinks and pre-packaged foods. Several analyses suggest that the consumption of sugar-sweetened beverages is related to the risk of increased triglycerides level [4]. Fructose is an intermediary in the metabolism of glucose. However, it differs in several ways from glucose. Fructose is poorly absorbed from the gastrointestinal tract by a different mechanism than that for glucose. Most cells have only low amounts of the glucose transporter type-5 (GLUT-5), which transports fructose into cells. Fructose is almost entirely cleared by the liver [6]. With these characteristics, fructose could play a role in the progression of NAFLD, but the mechanisms through which this could be achieved are unknown [4].
Macrophages are a cell type present in the liver that identify damage (as a part of the innate immune system) and take appropriate action: recruiting inflammatory cells and phagocytosis of damaged tissues and toxins. Studies have found that the population of these macrophages in the liver were higher in models of more progressed forms of NAFLD [7]. Macrophages are able to polarize into different phenotypes. The inflamed phenotype is known as M1, and as an M1 macrophage, cytokines such as Tnfα, Il1B, and Il6 are released. The anti-inflammatory phenotype is known as M2, and releases cytokines Arg1, Il10, Il1, and Il13 [8]. In order to polarize, these macrophages require activation and a source of energy. Glucose is known to serve as an energy source, but it is yet to be determined if fructose is utilized by macrophages and how this impacts macrophage polarization [9]. When activated, M1 and M2 macrophages also release other extracellular matrix (ECM) proteins such as Tgfb and Timp1. These proteins perform a variety of functions when released, some of which are pro- NAFLD. Tnfα activates the NF-kB pathway which promotes the survival of hepatic stellate cells (HSCs). HSCs secrete collagen when the liver is damaged, but their continued survival and secretion after repair can progress liver fibrosis [10]. Macrophages do have the capacity to degrade newly synthesized scar matrix through the secretion of MMPs, but this protease activity is inhibited by concurrent production of TIMPs by macrophages, which results in progressive matrix deposition and scar accumulation [11]. Il10 plays a major role in the cross-talk between macrophages and hepatocytes during the progression of NASH, and studies have found Il10 connecting the function of M2 macrophages to lipid accumulation and apoptosis in hepatocytes [12]. If fructose does indeed upregulate the expression of these cytokines in macrophages, as we predict, then it would play a major role in the progression of non-alcoholic fatty liver disease.
MATERIALS AND METHODS.
Cell culture.
J774 cells were cultured in 5mM Glucose DMEM and 5mM Fructose DMEM (Gibco) with 10% fetal bovine serum. Cells were differentiated into macrophages by 3 day incubation with 100 nM phorbol 12-myristate 13-acetate (Sigma). Macrophages were polarized in M1 macrophages by incubation with 10 pg/ml of LPS for 4 days in the first trial and for 24 hours in the second trial. Macrophage M2 polarization was obtained by incubation with 20 ng/ml of interleukin 4 (Fisher R&D) and 20 ng/ml of interleukin 13 (Fisher R&D) for 4 days. The n was 5 for each condition and polarization state.
Quantitative real time PCR.
RNA was isolated using the Direct-zol RNA MiniPrep kit (Gennessee) or the RNA isolation and Purification from Tissue Culture Dishes protocol. mRNA contained in 1 ug total RNA was reverse transcribed using iScript cDNA synthesis kit (Bio-Rad, Hercules, CA) and a thermal cycler according to the following protocol: priming (5 min at 25 C), RT (30 min at 42 C), RT inactivation (5 min at 85 C). cDNA was prepared with iQ Supermix, 20x primer-probe set (Assays-on-demand, Applied Biosystems, Foster City, CA) and nuclease-free water for qRT-PCR performed using a Bio-Rad CFX Connect Real-time System (Bio-Rad). The threshold cycle number was determined by Bio-Rad CFX manager software version 3.0. The mRNA expression results were normalized to 18S housekeeping gene.
Statistical analysis.
Statistical analyses were performed using GraphPad Prism software (version 6.05; GraphPad Software, La Jolla, CA). Comparisons to detect media conditions and polarization effects were performed using two-way ANOVA. All data are reported and presented in figures as the mean +/- SEM, and significance was set at P < 0.05 (n=5).
RESULTS.
To determine whether fructose plays a role in the secretion of specific ECMs and cytokines by M1 and M2 macrophages, we quantified the expression of these genes under different media conditions and polarization states. In the first trial (Figure 1) under glucose conditions, we found that the M1 macrophage marker Tnfα was not upregulated in the M1 macrophages. However, M2 macrophage marker, Arg1, was significantly upregulated in the M2 macrophages compared to the M1 and M0 macrophages, confirming M2 polarization. Arg1 expression of M2 macrophages under fructose condition was also significantly increased compared to the M2 macrophages under glucose condition. Il10 was also significantly upregulated in the M2 macrophage fructose treatment as compared to M0 and M1 macrophages and the glucose treatment. Interestingly, quantification results of Timp1 gene expression, while not significant, tended to be elevated in M2 macrophages under fructose conditions as compared to the glucose conditions. Similar to Il10 and Arg1, M2 macrophage expression of Timp1 was increased as compared to MO and M1 macrophages.
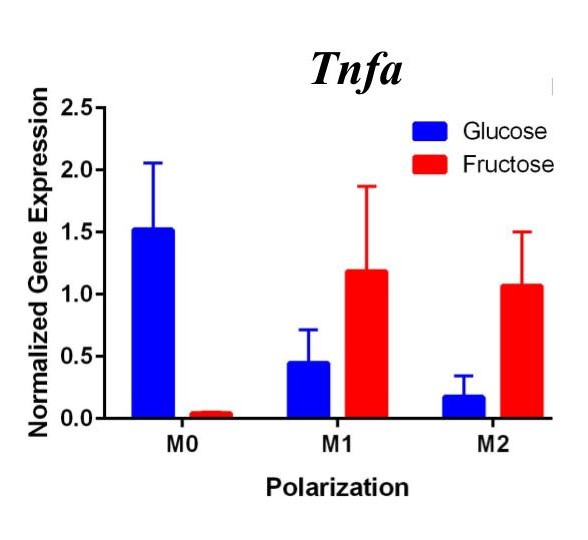
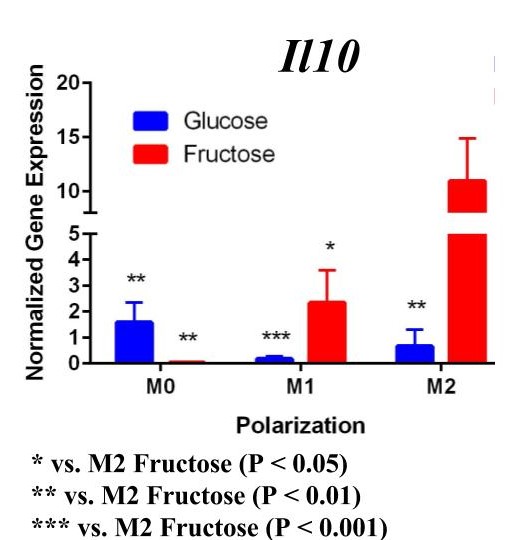
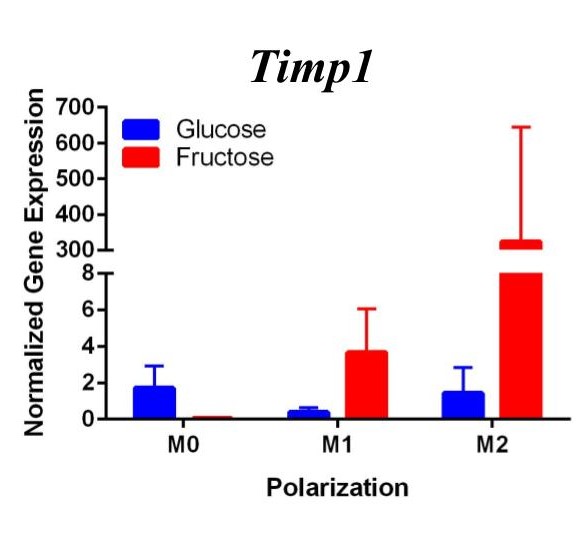
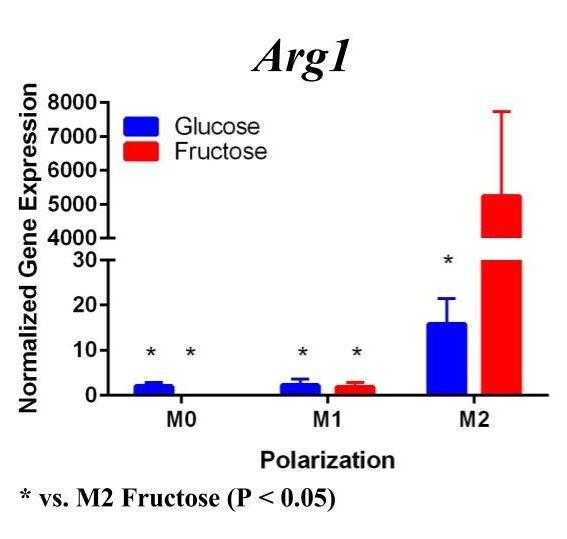
Figure 1. First Trial. Quantification of Il10 and Arg1 gene expression confirmed M2 macrophage polarization as well showed significant expression in the M2 macrophage fructose condition compared to M1, M2, and the glucose treatment. Timp1 gene expression also showed upregulated expression in the fructose treatments compared to glucose and in M2 macrophages compared to M1, M0. Tnfα showed no significant increase in M1 macrophages.
To confirm these results and confirm the polarization of M1 macrophages, we performed a second trial (Figure 2). This time we confirmed M1 macrophage polarization as we detected a significant increase of Tnfα gene expression in the M1 macrophages compared to the M0 and M2 macrophages, in both glucose and fructose media conditions. Similar to our first trial, Arg1 gene expression was upregulated in the M2 macrophages compared to M0 and M1 macrophages, confirming M2 polarization. However, we detected no difference between the glucose and fructose treatment groups.
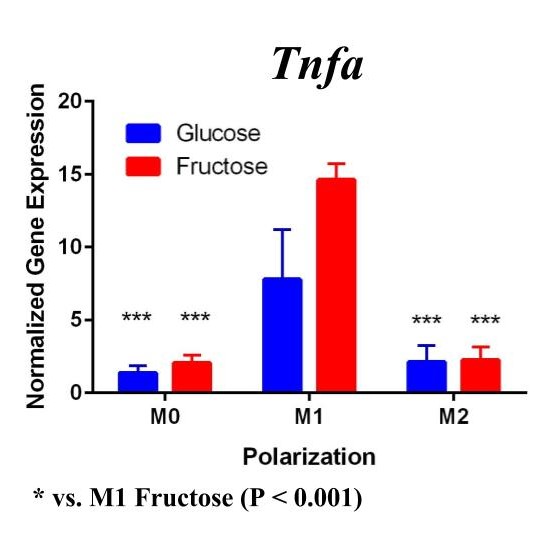
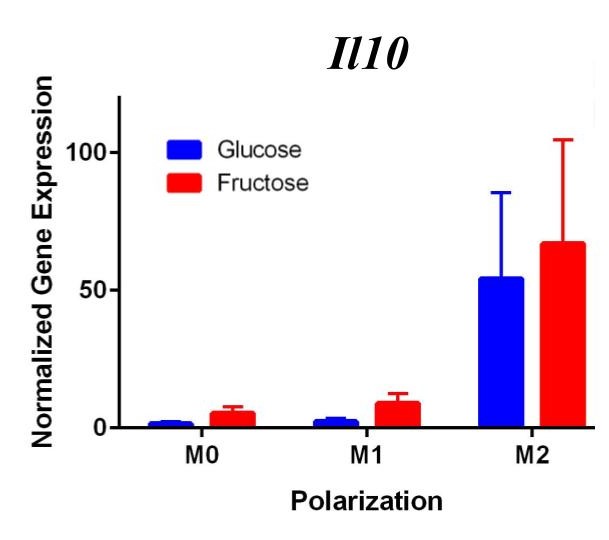
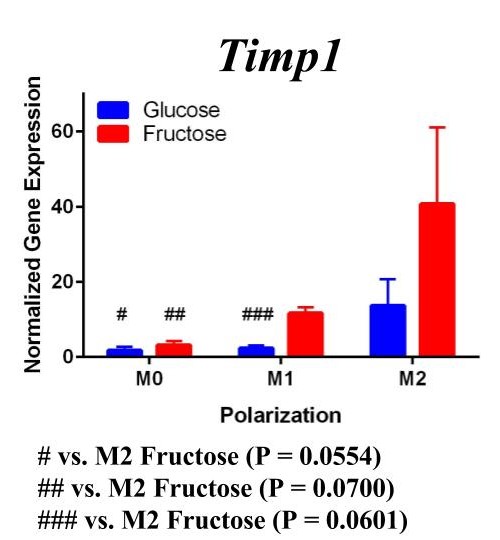
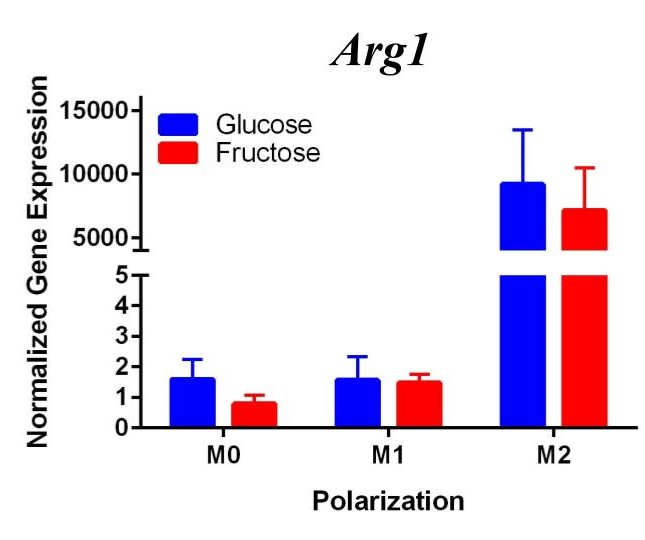
Figure 2. Second Trial. Tnfα gene expression upregulation in the M1 macrophages confirmed M1 macrophage polarization. Arg1 gene expression was increased in the M2 macrophages, confirming M2 polarization. Il10 gene expression was elevated in the M2 macrophages and the fructose treatment, confirming first trial results. We see similar results in the Timp1 gene expression, this time with some significance.
Similar to our first trial we saw an increase in the expression of Il10 in the M2 macrophages compared to the other two polarization states, especially in the fructose condition. While we did not detect significant differences in Timp1 gene expression between glucose and fructose, Timp1 was slightly elevated in M1 and M2 macrophages under fructose conditions compared to glucose conditions. We also detected Timp1 gene expression as slightly more elevated in the M2 macrophages compared to the M1 macrophages within a treatment group, similar to our first trial. Results from both trials showed more expression of Il10 and Timp1 in the M2 macrophages and not the M1 macrophages. Both trial results also showed significant increases of expression in the fructose treatment groups compared to the glucose treatments.
DISCUSSION.
Our primary findings suggest that fructose may directly regulate Timp1 gene expression in M1 macrophages. Both trials resulted in increased gene expression of this ECM protein under the fructose conditions compared to the glucose conditions regardless of polarization states.
We predict that the expression of Tnfα was not upregulated in the M1 macrophages because of the methods used in the first trial. Cells were incubated with LPS for four days instead of 24 hours, allowing enough time for cell death. The second trial with 24 hour incubation yielded significant results as the TNFα expression was upregulated in the M1s compared to the other polarization states, confirming M1 macrophage polarization. M2 macrophage polarization was confirmed in both trials.
In the first trial, our results demonstrate a significant increase in expression of Il10 in the M2 macrophages incubated with fructose compared to glucose. However, in the second trial this elevation was not present, suggesting fructose does not regulate Il10 gene expression in M1 or M2 macrophages. However, previous studies detect that Il10 does play an important role in communication between macrophages and hepatocytes during the progression of NASH yielding increased lipid accumulation and apoptosis of hepatocytes [12].
Previous studies have found that fructose plays a role in the development of NASH and liver cirrhosis, and our results may explain a specific mechanism through which fructose achieves this [4]. Our results suggest that fructose may regulate expression of Timp1 regardless of polarization state. The upregulation of Timp1 could be a possible source of liver fibrosis as the production of TIMPs by macrophages inhibits protease activity of scar matrix [11]. The accumulation of this scar matrix, allowed by TIMPs, eventually renders cirrhosis and detrimental effects to the liver. As fructose influences increased macrophage activation and production of Timp1, it allows a pathway for the buildup of scar tissue in the liver.
Our studies imply that fructose may control expression of extracellular matrix proteins by macrophages possibly contributing to the progression of NAFLD and NASH. Further studies could highlight the different roles of the two polarized macrophage states in this progression by investigating the expression of ECM proteins and cytokines in fructose induced NASH, using animal models. Additionally further studies quantifying the expression of other ECM proteins such as Timp2, Timp3, Timp4 and Tgfb – the major pro-fibrogenic cytokine that upregulates type I collagen synthesis – in the presence of fructose could further confirm the role of fructose in the progression of NAFLD and liver cirrhosis [11]. These studies may be able to serve as further confirmation and eventually a warning against consuming foods and beverages with high concentrations of fructose because of the detrimental role fructose plays in NAFLD. In conclusion, our study offers important data to suggest the important role of fructose in NAFLD through the production of ECM proteins by macrophages regardless of polarization state.
ACKNOWLEDGMENTS.
I would like to thank my mentor Arion Kennedy for support and assistance throughout the entire research process and Alyssa Hasty for the use of lab space and equipment.
REFERENCES.
- Neuschwander-Tetri, B. A. Non-alcoholic fatty liver disease. BMC Medicine 15, 45 (2017).
- Caligiuri A, Gentilini A, Marra F. Molecular Pathogenesis of NASH. Int J Mol Sci 17, 1575 (2016).
- Obika, M., & Noguchi, H. Diagnosis and Evaluation of Nonalcoholic Fatty Liver Disease. Experimental Diabetes Research 6, 947-952 (2012).
- Ouyang, X., et al. Fructose Consumption as a Risk Factor for Nonalcoholic Fatty Liver Disease. Journal of Hepatology 51, 1961-1971 (2008).
- Tappy, L., & Le, K. Metabolic Effects of Fructose and the Worldwide Increase in Obesity. Physiological Review 1, 23-46 (2010).
- Basaranoglu, M., Basaranoglu, G., Bugianesi, E. Carbohydrate intake and nonalcoholic fatty liver disease: fructose as a weapon of mass destruction. Hepatobiliary Surgery and Nutrition 4, 109–116 (2015).
- Baffy, G. Kupffer cells in nonalcoholic fatty liver disease: The emerging view. Journal of Hepatology 51, 212-23 (2009).
- Martinez, F. O., & Gordon, S. The M1 and M2 paradigm of macrophage activation: Time for reassessment. F1000 Prime Reports 3, 6-13 (2014).
- Basaranoglu, M., Basaranoglu, G., Bugianesi, E. Carbohydrate intake and nonalcoholic fatty liver disease: Fructose as a weapon of mass destruction. Hepatobiliary surgery and nutrition 2, 109-16 (2015).
- Pradere, J.-P, et al. Hepatic macrophages but not dendritic cells contribute to liver fibrosis by promoting the survival of activated hepatic stellate cells in mice. Hepatology (Baltimore, Md.) 58, 1461-1473 (2013).
- Pelllicoro, A. Ramachandran, P. Iredale, J. Liver fibrosis and repair: immune regulation of wound healing in a solid organ. Nat Rev Immunol. 14, 181-194 (2014).
- Han et al. RORα Induces KLF4-Mediated M2 Polarization in the Liver Macrophages that Protect against Nonalcoholic Steatohepatitis. Cell Reports 20, 124–135 (2017).
Posted by John Lee on Tuesday, December 22, 2020 in May 2018.
Tags: fructose, Macrophages, Nonalcoholic fatty liver disease