Simulating Visual Deficits in a Virtual Environment: A Street Crossing Study
ABSTRACT
Diseases which cause visual deficits, like macular degeneration and glaucoma, affect millions of individuals in the United States every year. The difficulties attributed to these impairments cause problematic and even dangerous conditions for those affected, especially in urban settings. Simple activities, such as crossing a street, become overwhelmingly difficult. This study aims to observe street crossing performance within a virtual reality roundabout environment. The environment consists of a roundabout model, realistic traffic simulations, visual deficit simulations modeled after patient data, and accurate user tracking software. This simulation will allow medical professionals to experience visual deficit effects firsthand, which creates a heightened sense of clinical empathy. This will also allow for more accurate diagnoses of visual diseases because the doctor will be able to personally experience a patient’s condition. Subjects with normal vision will be presented conditions with varying degrees of obstruction, and their performance will be analyzed using metric-based algorithms. This data will ideally help to aid urban developers in identifying threats posed to those suffering from visual diseases within urban environments.
INTRODUCTION.
Virtual reality (VR) can be defined as anything that immerses an individual in an environment and creates a false sense of presence, tricking the user into believing the presented stimuli [1]. Most commonly, VR is shown using a Head Mounted Display (HMD). HMDs work by presenting content to an individual in a realistic setting via two high definition, low latency displays. Some of the main uses of VR and HMDs today are gaming, education, and research. VR is also prominent in the medical field. It can be used to simulate disorders and provide accurate representations of complicated medical phenomenon, such as visual deficits [1-3].
Diseases that generate visual deficits are ophthalmological disorders which affect an individual’s field of view (FOV). Common impairments, such as glaucoma and macular degeneration (MD), can cause blurriness or even total blindness in a patient’s FOV [4]. In this work, we simulate these phenomena using VR. VR’s use in this experiment is to accurately depict visual deficits and monitor procedures in a safe, controlled environment. Visual deficits are simulated based on measured visual field loss from actual patients. We aim to test whether presence of these deficits can alter street crossing behavior in normally sighted individuals using a realistically modeled traffic simulation.
There are two main types of visual deficits, peripheral and foveal. Peripheral deficits, such as late-stage glaucoma, affect vision on the perimeter on a patient’s FOV. Visual acuity often remains normal in the foveal region of patients with peripheral occlusion. However, foveal deficits like MD affect foveal vision quality.
Visual field deficits are typically reported using data gathered by a Humphrey Visual Field Analyzer (HVFA), which reports patients’ retinal sensitivity [4]. This data can be mapped to stereoscopic VR HMDs. Stereoscopic displays allow for depth-based vision, which is vital for simulating and analyzing visual deficits.
METHODS.
Environment.
The virtual environment (VE) was created using Unity 5.6.1, MonoDevelop, and Microsoft Visual Studio 2015. Open source buildings and environmental models were implemented, navigation paths (NavPaths) and realistic car models were used to simulate accurate traffic flow, and abnormal scotomas were superimposed on the HMD to increase the ecological validity of the scene. In addition, advanced algorithms were created for gathering metrics like Crossing Time, Gap Threshold, and Curb Delay. These metrics will be used to quantify user performance [5].
The roundabout in the environment was directly modeled after the Pullen-Stinson roundabout on the campus of North Carolina State University. This specific roundabout was chosen due to extensive knowledge about its dimensions and speed requirements. It has also been the location of many previous behavioral studies [2,6]. Other buildings, such as the many skyscrapers found in the scene, were accumulated using open source databases such as TurboSquid, CGTrader, and Free3D. Some of the vegetation within the VE was gathered from the Unity Asset Store instead of these databases; however, most of the vegetation were generic environmental models found within the program, such as the terrain. Terrain was used to create a realistic, grass-like surface. However, some aspects of the terrain were too computationally expensive to incorporate into the final version of the environment. To solve this, a generic grass pattern was overlaid onto the terrain within Unity. Trees and bushes sometimes exhibited the same issues. In addition, wind effects had to be scaled back to a reasonable speed so that the subject would not be affected during testing.
The navigation paths within the environment were created in accordance with the experimental procedure [2]. Gap distances between cars were consistent at 1.5 seconds of separation, except for a larger target gap which ranged from 2 to 10 seconds in length. The larger gap was randomly assigned to a location within the string of cars. Strings of cars, typically six cars in length, were spawned when an input was given. Cars exhibited behavior comparable to that of normal traffic due to adjustments to angular velocities and breaking distances. They maintain a constant speed of 15 meters per second outside of the roundabout, and slow down to 7.5 meters per second once they enter. Cars will also yield to pedestrians and other vehicles. This is due to a collision detection system created by the application of box colliders which surround all cars and the player. Code is then set up to detect when colliders come within proximity of each other and prompt the cars to act accordingly. Similar code and colliders are also used for gathering the desired metrics: Crossing Time, Curb Delay, and Gap Threshold.
Metrics.
Crossing Time was the simplest metric to measure. Three colliders were required, two on each side of the street where the subject was crossing and one on the person. The time difference between when the subject left one side of the street (first collider) and arrived on the other side (second collider) was determined to be the crossing time.
Curb delay was measured similarly to Crossing Time. The times in which a car entered the crossing area, or the middle of the street where the user crossed, and when the user decided to cross were taken. The difference between when the car entered and when the subject decided to cross yielded Curb Delay.
Gap Threshold, which is the average gap distance between cars when the user decides to cross, uses a system of five colliders. One collider in the center of the crossing area determines gap sizes in between cars by subtracting the time differences from one car to the next as they enter the crossing path. The time in which the user begins to cross the street is then compared to the timing of the gaps. The gap when the user crossed can subsequently be determined by this information and Boolean logic.
Visual Deficit Simulation.
The simulation of an abnormal scotoma within VR involved intensive work with shaders and photo editing software. Screen shaders are graphic image effects which map directly to the camera by altering a camera’s rendering output. First, we mapped the HVFA data to the center visual field of the HMD. The program assumes either a 30-2 Analyzer protocol or a 24-2 protocol for the HVFA data. The 30-2 protocol measures 30 degrees temporally and nasally and tests 76 points [7]. The 24-2 protocol measures 24 degrees temporally and 30 degrees nasally and tests 54 points [7,8].
The data is organized as either a 9×8 or 10×10 matrix of raw values representing retinal sensitivity for the 24-2 protocol and 30-2 protocol, respectively. Each data point of the matrix uses a decibel (dB) value to measure retinal sensitivity at specific retinal points. Sensitivity typically ranges between 30 dB and 0 dB. Values near 30 dB indicate normal vision and lower values indicate loss in retinal sensitivity. A value of 0 indicates no light sensitivity (a blind spot).
This raw HVFA data is manually coded, as matrices, since patient data is stored on paper. These matrices of retinal sensitivity were then used to generate grayscale intensity maps. A linear mapping of each sensitivity data from 0 to 1 was desired, to normalize the data for image processing. A zero value corresponds to zero light sensitivity and a one value indicates perfect vision. Since decibels are a log-based measurement, the values were first converted to a linear scale and then weighted to map from 0 to 1. Afterwards, the images were plotted with gaussian interpolation to produce an 800 x 600-pixel grayscale image. A gaussian filter was applied to mimic the smoothing effect used by the human eye. As the dimensions of the matrix and the dimensions of the image did not always match, “buffer” values of 1 were added when needed.
The mapping within the HMD involves a transparency map through grayscale. This allows pixel intensity values near 1 (white) to be opaque, while intensity near 0 (black) are more transparent. Therefore, before we mapped to the HMD, the grayscale image intensity values were inverted. (e.g., 1 would now map to 0). This inversion allowed for the HMD to process the greyscale visual field data.
The final component was to map the scotomas to the stereoscopic display of an HMD. Each HMD has a field of view and each HVFA data matrix, likewise, represents either 24 or 30 degrees of the central FOV (depending on the protocol). Therefore, we could properly position the grayscale visual field data onto the screen of the HMD by using FOV data and the HMD screen’s pixel count. The project was subsequently ported to the Vive and Oculus HMDs. Our implementation was also efficient enough for use on the Samsung Gear VR.
RESULTS AND DISCUSSION.
The project was divided into three tasks: developing the VE, creating a scotoma simulation based on patient data, and coding the desired metrics. Once these tasks were complete, they were combined to form the final version of the experiment.
The experiment itself takes place in a controlled environment which allows for the assurance of user safety. Performing a street crossing study, with the inclusion of visual deficits, in the real world would pose many threats to both the experimenter and the subject. Developing the experiment in VR, however, eliminates these dangers while still providing the subject with realistic, convincing stimuli. The subject is given ample space to travel as if they were physically in the VE. This is to increase a user’s immersion within the VE. In addition, data acquisition is expedited when using VR when compared to the real world. All metrics required for user performance quantification are automated in VR, which decreases the chance for experimenter error.
Incorporating patient data and realistic scotomas into a behavioral study offers a more accurate representation of the effects of visual disorders. Scotoma simulations have typically been modeled after simple geometry [2]. This, however, is not ideal because they do not show the abnormal structure exhibited by most scotomas (Figure 1B).
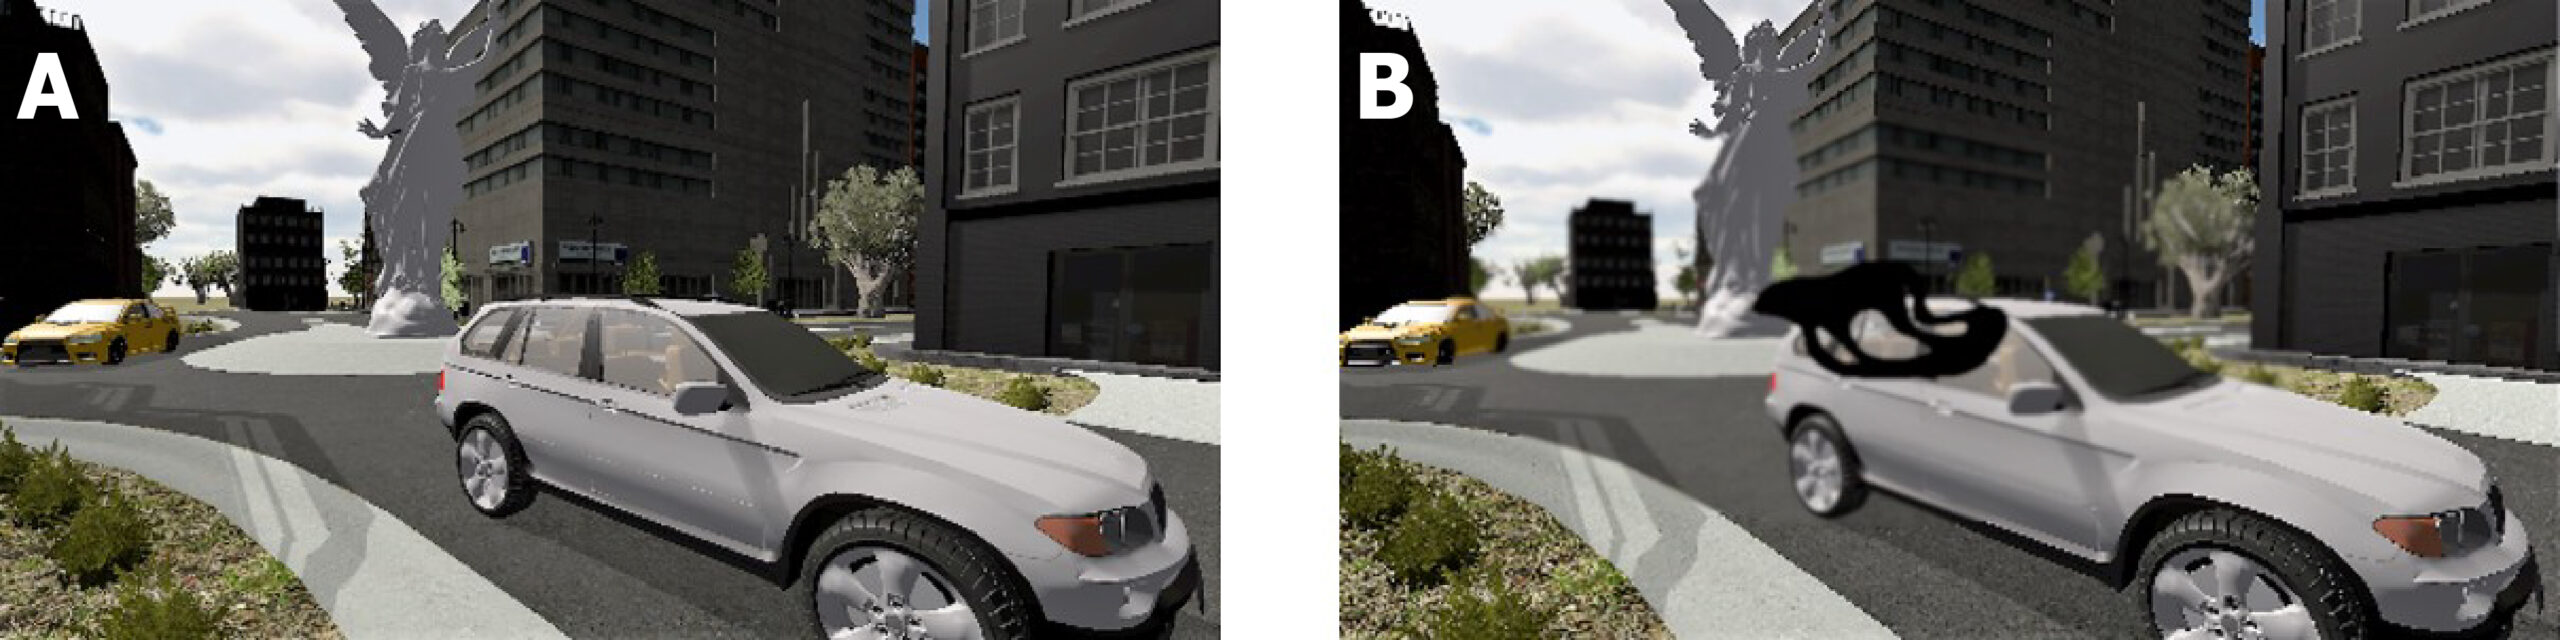
Figure 1. These images show the point of view from inside the HMD, under either central scotoma (B) or no scotoma (A) conditions.
We have improved upon these simple geometric simulations by producing accurate greyscale scotoma figures. Our algorithms stress the importance of accurately rendering obscure and abnormal scotomas (Figure 1). This will, in turn, produce a more immersive and realistic experiment. Subjects are now able to be exposed to actual scotomas, instead of their arbitrary depictions. This allows for anyone to experience the effects and difficulties of visual deficits.
Along with realistic scotoma simulations, buildings, car models, and vegetation were optimized based on the subjects POV to create a hyper-realistic environment for the experiment. This optimization involved detailed scaling which gave buildings the height and width one would expect them to have in the real world.
Performing such detailed scaling of the environmental features, including the scotoma simulations, helped to ensure the ecological validity of the scene. The goal of increasing ecological validity is to invoke a heightened sense of presence within the VE. Presence, or immersion, within a VE is attributed to the presentation of convincing stimuli to an individual. The more immersed a subject is, the more likely they are to behave as they would normally [9]. This will lead to data that is representative of actual street crossing behavior, thus creating a more robust experiment.
Figure 2 gives an overhead view of where the experiment takes place within the environment. For the purposes of the experiment, the subject will be walking from where the camera is initially placed (above the white car) to the middle of the road, or the median, and back. They will complete this action 20 times both with and without scotoma presence. In order to quantify how participants perform, data is gathered in the form of Curb Delays, Crossing Times, and Gap Thresholds. These metrics are needed to determine to what extent scotoma occlusion will affect an individual’s ability to properly cross the street.
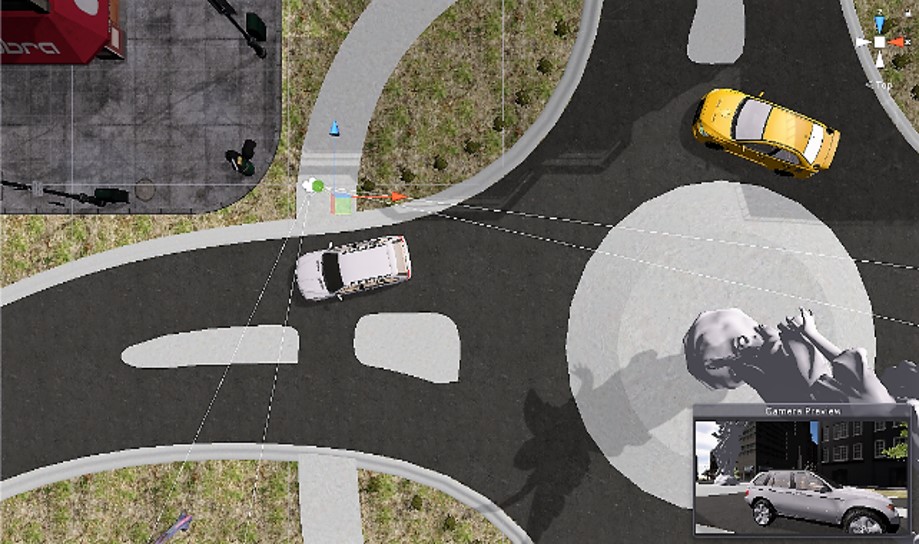
Figure 2. Overhead view of the location in the VE in which the experiment takes place.
It is hypothesized that as occlusion increases, all the metrics except crossing time will exhibit a positive correlation [2]. That is, as scotoma simulations become more obstructive, subjects will only cross during larger gaps between cars and hesitate longer before crossing. Crossing time is not expected to be affected due to the notion that visual impairments do not alter locomotion exclusively, but rather the hesitation to cross the street.
CONCLUSION.
Diseases that cause visual deficits, such as MD, are a growing concern in many countries. They can lead to safety concerns, occluded vision, or even total blindness. Visual impairments commonly lead to issues in heavily urbanized environments. Having to analyze traffic patterns, pedestrians, and other distractions can prove to be difficult for impacted individuals. This study aimed to create a simulation which quantitatively determines the effects these visual deficits have on subjects attempting to cross a street. This was completed using a recreated roundabout environment and realistic scotoma simulations. The roundabout environment was created using immersive flora designs and architectural models. Several metrics, such as Gap Threshold, Crossing Time, and Curb Delay, were developed for application during planned behavioral studies.
Future data gathered from this study may assist city planners and engineers to more effectively identify dangerous urban conditions threatening those suffering from visual deficits. This simulation is also a tool for clinical empathy. Medical professionals and family can now visualize a patient’s perspective of an impairment in VR. This will aid doctors in diagnosing an individual case of visual disorders because they will be able to experience the effects of the disease firsthand.
ACKNOWLEDGMENTS.
The authors thank Haoji Wu for her work with macular degeneration in VR, Christopher Muller, and the rest of the SSMV for their advice and guidance. This work was supported in part by NSF under grant 1422859.
REFERENCES.
- LaValle, S. Virtual Reality. (University of Illinois: Cambridge University Press).
- Wu, H., Ashmead, D. H. & Bodenheimer, B. Using immersive virtual reality to evaluate pedestrian street crossing decisions at a roundabout. Proceedings of the 6th Symposium on Applied Perception in Graphics and Visualization – APGV 09 (2009).
- Jin, B., Ai, Z. & Rasmussen, M. Simulation of Eye Disease in Virtual Reality. 2005 IEEE Engineering in Medicine and Biology 27th Annual Conference (2005).
- Draskovic, K. & McSoley, J. J. Automated perimetry: visual field defects in glaucoma and beyond. Review of Optometry (2016).
- Schroeder, B. J. Crossing solutions at roundabouts and channelized turn lanes for pedestrians with vision disabilities: a guidebook. (Transportation Research Board, 2016).
- Plumert, J. M., Kearney, J. K. & Cremer, J. F. Children’s Perception of Gap Affordances: Bicycling Across Traffic-Filled Intersections in an Immersive Virtual Environment. Child Development 75, 1243–1253 (2004).
- Nouri-Mahdavi, K. Selecting visual field tests and assessing visual field deterioration in glaucoma. Canadian Journal of Ophthalmology / Journal Canadiend Ophtalmologie 49, 497–505 (2014).
- Khoury, J. M., Donahue, S. P., Lavin, P. J. M. & Tsai, J. C. Comparison of 24-2 and 30-2 Perimetry in Glaucomatous and Nonglaucomatous Optic Neuropathies. Journal of Neuro-Ophthalmology 19, (1999).
- Slater, M. & Wilbur, S. A Framework for Immersive Virtual Environments (FIVE): Speculations on the Role of Presence in Virtual Environments. Presence: Teleoperators and Virtual Environments 6, 603–616 (1997).
Posted by John Lee on Tuesday, December 22, 2020 in May 2018.
Tags: Computer Science, Macular Degeneration, programming, Virtual reality, Visual Deficits