Providing Recommendations on Combating Climate Change Through Data Driven Analysis
ABSTRACT
As we continue to feel the worsening effects of climate change, it is important to understand what can be done to combat it. This paper focuses on using data driven research to determine relationships in what factors lead to lower levels of CO2 emissions in different countries. In order to conduct the analysis, publicly available data form reputable sources were used. Machine learning techniques such as a random forest regression and ordinary least squares (OLS) regression were used to achieve our results. The final random forest model was able to predict the CO2 emissions of a country with a 39.51% error. The OLS regression yielded an adjusted correlation coefficient of 0.832. Through our analysis it was found that in countries where the public had greater influence, the perception of climate change among the citizens had a definitive effect on CO2 emissions, and that industrial activity was the only industry that had a direct impact on CO2 emissions with a p value of 0.053. These results have cleared up previously unanswered questions and adds to our current understandings of how to combat climate change.
INTRODUCTION.
Climate change is the biggest threat to human health. The increasing intensity, and frequency of heat waves pose a significant health risk to the young and elderly. In addition to worsened air quality and increased spread of disease, climate change is also melting the Antarctic and Greenland ice caps to a rising sea level, threatening not only a multitude of habitats but also many of our cities [1]. Among this, climate change affects people’s ability to meet certain basic needs such as clean air, food supply, and shelter. Climate change is expected to cause 83 million excess deaths before 2100 [2]. Just in the US, from 2016 to 2020 natural disasters caused by climate change have already cost the US government $120 billion a year, and by 2100, the US government is projected to lose roughly $2 trillion annually to climate change related causes. [3]
Additionally, the global average SDG (sustainable development goals) Index score suggests that the potential effects of climate change to our societies have been extended since the COVID-19 pandemic hit. This score has stalled in the recent years leaving us to question what is in store for our future [4]. It is currently unclear how people’s perception of climate change is related to the amount of effort spent on sustainability. There is a significant lack of data driven research that justifies where to put efforts towards preventing climate change. Previous empirical research has shown that in a corporate environment, there is a correlation between a company’s environmental, social, and governance (ESG) score, and the number of employees that believe in climate change. [5] However, there is no conclusive research to support this effect at a community or national level.
The conclusions of this study can be used to come up with effective solutions towards improving sustainability at all levels, comparing where we should put our efforts towards to preserve the natural world.
This study hopes to explore relationships between different societal bodies and what encourages them to be more sustainable through machine learning-based dataanalysis. Based on previous research and trends in our society it is hypothesized that the economy will play a large factor impeding sustainability, and in democratic nations, an increase in acknowledgement of climate change will have a positive correlation with amount of effort spent by a government to be more sustainable.
MATERIALS AND METHODS.
Data Collection. This study was conducted using publicly available data from reputable sources such as the Pew Research Center and World Bank.
Table 1. Datasets and sources used in the study
| Name of dataset | Source |
| Concern that climate change will harm you personally at some point in your lifetime | Pew Research Center |
| Total greenhouse gas emissions without LULUCF (Land Use, Land-Use Change and Forestry) for non-Annex I Parties (Mt CO2 equivalent) | United Nations Department of Economic and Social Affairs Statistics Division |
| Total greenhouse gas emissions without LULUCF for Annex I Parties (Mt CO2 equivalent) | United Nations Department of Economic and Social Affairs Statistics Division |
| Extent to which global citizenship education and education for sustainable development are mainstreamed in national education policies | United Nations Department of Economic and Social Affairs Statistics Division |
| GDP – composition, by sector of origin | The World Factbook – CIA.gov |
| Population Data | World Bank Open Data |
| GDP Information by country | World Bank Open Data |
| Literacy rate data | World Bank Open Data |
| Government type by country | |
These datasets were downloaded directly from the sources shown in the Table above and cleaned by hand to simplify the coding process. We cleaned the datasets using the Pew Research Center perception dataset as reference. This step was important because there were multiple names for one country. For example, South Korea could have been written as S. Korea, South Korea, or Republic of Korea. If these names didn’t match, the record country was discarded during the merging process. From these datasets we were able to create a data frame with the full profiles for 37 countries. The data collected for each country is as follows:
- A perception score for how concerned the public is about climate change created by assigning numeric values to different responses ranging from “very concerned” to “climate change doesn’t exist” in a survey conducted by the Pew Research Center. (Conducted in 2015 and 2021)
- The percentage of respondents that chose very concerned in the same Pew Research Center survey.
- The difference in carbon emissions for every country from 2010 to 2018.
- The percentage of GDP composition from the industrial sector within years 2000 to 2017
- The percentage of GDP composition from the agricultural sector within years 2000 to 2017
- The percentage of GDP composition from the tertiary sector within years 2000 to 2017
- Population data from 2018
- Mean literacy rate from 2010 to 2018
- GDP per capita
10, 11, 12) Indicator for type of government (republic, provisional, constitutional/absolute monarchy)
13) CO2 emissions per capita from 2018 (dependent variable)
We decided on using CO2 emissions per capita as our dependent variable because it was an indicator of sustainability that could be applied and scaled to each country. CO2 emissions are something that have a direct impact on climate change. Carbon emissions are also a factor that a country can reduce with enough effort, making it a valid indicator of how actively countries try to combat climate change.
Due to the relatively small set of countries, the final dataset was then split with 80% of countries being used for the training model and 20% for a testing set to maximize the training set, and therefore, the accuracy. The split was made randomly.
Procedure. The main data analysis was conducted in a Google Collaboratory notebook using Python. Imported libraries include pandas, seaborn, matplotlib, and NumPy, SciPy, statsmodels and sklearn. The perception score was created by assigning values of 1, 0.5, 0, -0.5, and -1 to the respective answers in the survey. One-hot encoding was used to modify the data related to government bodies of countries. Analysis of the data was conducted using a random forest algorithm to predict CO2 emissions of a country based on other factors. As the data contained some outliers, we chose random forest as it is a model that is less affected by outliers. The data of 29 countries was used to train the model and 8 countries were used as a test. We also conducted an ordinary least squares (OLS) regression using statsmodels.api with CO2 emissions per capita as the target variable. An OLS regression model was chosen due to its able to clearly describe the relationship between the predictors and target.
RESULTS.
Random Forest. The random forest yielded an acceptable model that was able to predict CO2 emissions per capita based on the multiple factors with a mean absolute percentage error of 39.51%. Two countries had extremely high percentage errors which have skewed the overall error percentage. The most accurate CO2 per capita predictions would be Poland with an 11.6% error and Japan with a 13.8% error. The most inaccurate predictions were Burkina Faso with a -139.07% error and Pakistan with a -131.17% error.
Linear regression. The linear regression yielded an adjusted R-Squared reading of 0.63 and a Prob(F-statistic) of 0.000643 meaning there is a moderate to significant relationship between the independent variables and the CO2 per capita (see Figure 1).
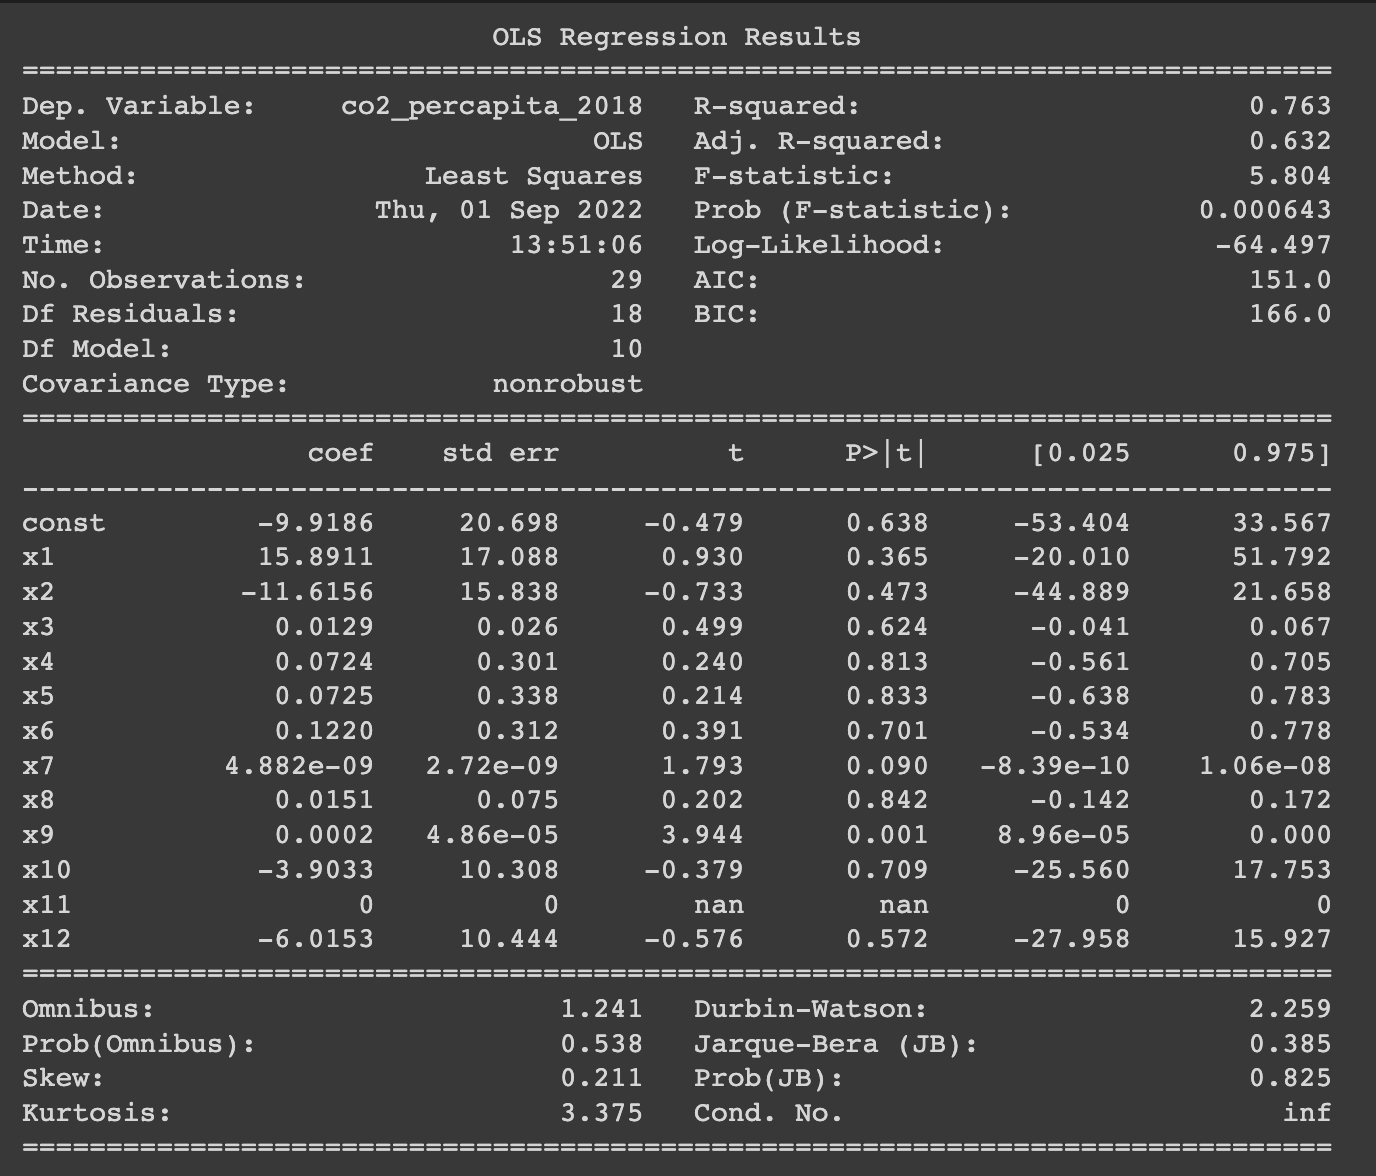
Figure 1. OLS Regression Results for all countries (In order without CO2 emission per capita)
Limiting dataset. To see the effects of these variables in a country where the population has more of an influence, we created a dataset of containing only the republic countries. We then ran the same random forest and OLS regression algorithms and were presented with the following results:
The random forest accuracy increased by 15.95% with an absolute percentage error of 23.56%. The most inaccurate being India with a 39.5% error, and the most accurate being Greece with a 4.14% error.
The OLS regression showed similar effects with the Prob(F-statistic) extremely close to 0 and an improved adjusted R-Squared value of 0.832 (see Figure 2). Although many of the correlations between the independent and dependent variables changed, the most noticeable change is effect of perception score on the dependent variable. The coefficient changed from -9.91 to a much more relevant value of -22.25, while the standard error decreased from 20.698 to 15.722.
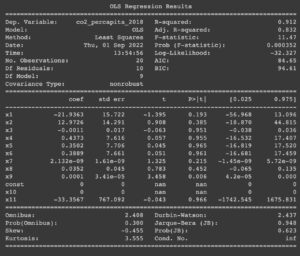
Figure 2. OLS Regression Results for republic countries (In order without CO2 emission per capita)
Another independent analysis was conducted to the relationship between percent GDP composition from each economic sector and total CO2 emissions. At first, there seemed to be a negative correlation between the percent of agriculture to the GDP and CO2 emissions. However, by removing the effect of GDP on the target variable and just taking the composition of each country’s industries through dividing by the GDP per capita dataset, we found that the amount of agricultural activity in country doesn’t have a significant impact on CO2 emissions. Rather, we found a positive correlation between GDP and CO2 emissions per capita. The original correlation was due to countries with a high GDP typically having less agricultural activity. Interestingly, after factoring out GDP, a correlation between industrial activity and CO2 emissions was revealed.
DISCUSSION.
The main objective of this research was to find correlations between different factors and how they affect a country’s contribution towards climate change.
The indicators were chosen to consider all three aspects of a country’s development: industry, government, and society. For example, the data on the public’s perception on climate change covers the society aspect, while the GDP composition by sector covers the industrial side.
The result of our analysis seems to be in line with our hypothesis of the difference between governments where the public has a greater impact. In countries where the public has more say, the models had the highest performance. The correlation coefficient of the perception of climate change being much larger in the republic countries shows that there is indeed merit to educating citizens of a country of climate change and its dangers.
Through the analysis of industry data, we were able to find that correlation between industry and CO2 emissions is largely due to the GDP of the country. The data first showing a negative correlation between the percent of the agricultural sector to GDP and CO2 emissions per capita. This correlation would bring the conclusion that more agriculture means lower CO2 emissions. However, after controlling for GDP, we found that there isn’t a correlation between amount of agricultural activity and CO2 emissions. Rather, the correlation is the effect of countries with higher GDP per capita typically participating in less agricultural activity. The only correlation shown after controlling the effect of GDP was a positive correlation between amount of industrial activity and CO2 emissions which makes sense.
This finding proves our hypothesis that the economic situation of a country is a big factor in their CO2 emissions and overall sustainability. From this we can learn and understand that further developed countries have a responsibility to become more sustainable as they are the ones causing more harm to the environment.
This research adds further empirical evidence that the more developed countries have a responsibility to work to lower their carbon footprint.
However, it is not conclusive and requires further experimentation with larger quantities of data. This research has set the foundation for further trend analysis towards reducing climate change.
LIMITATIONS.
Although the data was able to bring results there are vulnerabilities that need to be addressed. After running the OLS regression there seemed to be a few missing points of data registered as nan. The data is also relatively sparse and could yield different or better results with a larger sample size.
Due to the nature of the research, concerning not only natural and data sciences, but also social science aspects, there is naturally a higher error.
As each row represents a different country, the sample size of the data was not optimal. This could lead to skews in data. The random forest for all countries had a mean percentage error of 39.51%. However, when looking at the percentage errors of all countries except the significant outliers Burkina Faso and Pakistan, there was a mean error of 23% showing that these two outliers drastically altered the error percentage. This is a testament to the fragility of the model and requires further improvement. With these margins of error in mind, this research was still able to yield strong results.
ACKNOWLEDGMENTS.
I want to thank Mauricio Hernandez of Duke University for guiding me throughout the entire research process, providing me with important lessons, guidance, and knowledge in the field of Data Science. I also want to thank the entire Lumiere team for their support throughout the research process.
REFERENCES.
- Pörtner, H.-O., D.C. Roberts, H. Adams, I. Adelekan, C. Adler, R. Adrian, P. Aldunce, E. Ali, R. Ara Begum, B. Bednar-Friedl, R. Bezner Kerr, R. Biesbroek, J. Birkmann, K. Bowen, M.A. Caretta, J. Carnicer, E. Castellanos, T.S. Cheong, … B. Rama (eds.)]. Climate Change 2022: Impacts, Adaptation, and Vulnerability. Contribution of Working Group II to the Sixth Assessment Report of the Intergovernmental Panel on Climate Change. Cambridge University Press.
- Bressler, R.D. The mortality cost of carbon. Nat Commun12, 4467 (2021).
- Office of Management and Budget, Climate Risk Exposure: An AssesSment of the Federal Government’s Financial Risks to Climate Change, Rep. (Apr., 2022).
- Sachs, J., Lafortune, G., Kroll, C., Fuller, G., Woelm, F. From Crisis to Sustainable Development: the SDGs as Roadmap to 2030 and Beyond. Sustainable Development Report 2022. Cambridge: Cambridge University Press. (2022).
- Huang, Q., & Lin, M. Do climate risk beliefs shape corporate social responsibility? Global Finance Journal, 53, 100739 (2022).

Posted by John Lee on Friday, May 19, 2023 in May 2023.
Tags: climate change, Machine learning, Sustainability