Integrating Geographic Information Systems (GIS) and Historical Data to Justify the Placement of Forts Henry and Donelson
ABSTRACT
Fort Henry and Fort Donelson were Confederate-built fortresses that were constructed with the purpose of protecting the state of Tennessee and the essential mediums of transportation. Historical information and modern day technology was used to determine how ideally the forts were situated. Historical maps were collected from the Library of Congress website and georeferenced in ArcGIS Pro. Points were taken at the Fort Donelson National Battlefield and uploaded as points that can be used in ArcGIS Pro. Through the combination of various forms of historical data, field observations, and modern mapping technology similar conclusions can be made to support the position of both forts. Despite the forts being taken over by Union forces, the use of modern technology supports the expected historical justification for fort positions. While these forts seemed to be taken over by the Union with ease, the integration of historical letters, Civil War-era maps, on-site observation, and geographical analysis through ArcGIS Pro suggests that the forts’ locations are justified by their situations relative to areas of significance and logistical limitations.
INTRODUCTION.
During the American Civil War, the Union and Confederacy fought across the United States from 1961-1965. Fortifications, structures that were built to gain an advantage over the opposing side [1]. As the Civil War unfolded, forts became a necessity to protecting key features, including rivers and railways. One such location was in Tennessee where there were rivers and railways essential for transportation. Near Nashville, the Confederacy had to consider strategic placement of forts to protect these transportation lines but proximity to these transportation lines also are implicated in their defeat.
Tools are now available that can aid in contextualizing the construction of the forts based on geography, the natural landscape, and the integration of historical and modern-day maps. ArcGIS Pro is software used for creating and using maps, compiling geographic data, analyzing mapped information, discovering geographic information, and sharing those findings. By combining historical records and modern technology, this project examines the engineering decisions that lead to the placements of Forts Henry and Donelson. This data was analyzed and a StoryMap was created to communicate these engineering decisions to the public.
The importance of this project lies with the concept of recreating the past with the use of computer modeling, historical records and maps, and contemporary maps in the hopes to reveal information as to where and why fortifications were built relative to the area today. This resource has the ability to re-enact the past and further advance historiographical research on specific events and eras, specifically the Civil War [2]. The simulation of these forts from Civil War-era Tennessee plays an important role in the justification of fort placements, especially in cases in which the strongholds no longer exist [3].
MATERIALS AND METHODS.
Methods Overview.
The historical reconstruction of the geographical placements of the forts through GIS lends well to providing perspective but does not fully depict the full picture. To justify their locations, the integration of historical records, letters, maps, GIS, and on-site exploration was necessary to understand the thought process of each fort. Each facet complements the other to add depth to the justification. The information search began with The War of the Rebellion: a Compilation of the Official Records of the Union and Confederate Armies [4]. The letters exchanged by historically significant individuals from both sides of the war were researched.
Historical Record Search.
The .pdf files of Operations in Kentucky and Tennessee, were combed for information regarding the distance from the forts and other major landmarks or points of interest. Pages with salient information were found using the “find function” to efficiently look at records that had the word “Fort”. The sections about the captures of Forts Henry and Donelson were focused on. Knowing the distances, they had recorded granted insight into their logic of building the forts where they were. Most of the records didn’t include rationale as to why their distance from areas of significance was important but through inferences and piecing the written records to historical maps and GIS, this information gathering was a key precursor to making sense of the forts. The records read as points of view from both sides of the war and described the situational context of the war at the time. This acted as a reconstruction of the events as well. The records explain how both forts had been taken by the Union.
Mapping Historical Records Using ArcGIS Pro.
Maps lend well to simplifying information by depicting large areas through symbols and by highlighting certain geographical features. To begin, the Library of Congress website was used to find Civil War-era fort maps and apply them to modern-day maps. The maps add depth to the letters because of the elements and landmarks the cartographers decided to include. The natural features around the area of the forts were elements that were previously described or mentioned briefly in the letters. Their attention to the rivers and roads provided more context to complement the descriptions per the letters. Next, the images were superimposed over a modern-day map through the ArcGIS Pro mapping software. This process is known as Georeferencing. Georeferencing locks a fixed point on one map to the other and anchored that spot in place so the rest of the map could stretch and conform to the modern-day landscape. Control points were used so that features shown in both maps like specific roads or natural landmarks were used to stretch and modify the historical image. These points acted like anchors so the map could be transformed around these fixed points. This manipulated the map to a more accurate state. The adjusted map facilitates the comparison between time periods and reveals the continuity and change in the area. ArcGIS aided in recreating the environment through a digital medium. It also made analyzing the environment more methodical and it laid out the location of the forts relative to natural landmarks, forms of transportation, or cities.
Field Research.
On-site exploration took place at the Dover Hotel and the Fort Donelson National Battlefield to apply the information from letters and maps. Being on-site revealed a large amount about placement, line of sight, elevation, and other logistical factors. On-site, ArcGIS Collector was used to mark areas of significance. Seeing the location in person puts the reading as well as the maps in greater perspective and tied all the technology and history. On-site exploration furthered the evidence from the letters and maps and supported the idea that Fort Donelson was strategically placed in one of the most efficient locations despite it getting taken over.
RESULTS.
Georeferencing Forts Henry and Donelson.
The “Sketch showing the relative positions of Fort Henry and Fort Donelson: with the roads connecting the two places” map (1862) contributed by Lambecker, McPherson, and the United States War Department Corps of Engineers [5] was georeferenced using ArcGIS Pro to increase the geographical accuracy of the image to fit the modern landscape (Figure 1). The map has 6 control points with a forward error of 207.08 and an inverse error of 0.23. Forward error represents error in the units of the data frame spatial reference, whereas inverse error shows error in pixel units [6]. Error closer to zero is considered more accurate [6]. It shows the original map from the Library of Congress and the georeferenced map with additional locations marked with colored spheres. The map shows the location of Forts Henry and Donelson along with the city of Dover. Fort Henry is marked with a yellow sphere, Fort Donelson with an orange sphere, and the city of Dover with a purple sphere. It is also important to add that the Tennessee and Cumberland rivers are shown in blue towards the edges of the maps.
Fort Donelson and Accompanying Points.
 Figure 1. Georeferenced Map of Forts Henry and Donelson. The map has 6 control points with a forward error of 207.08 and an inverse error of 0.23. The scale is 1:145,014, so for every centimeter, according to the black and white bar on the map, is equal to 145,014 cm in the real world. The map shows the location of Forts Henry and Donelson along with the city of Dover. Fort Henry is marked with a yellow sphere, Fort Donelson with an orange sphere, and the city of Dover with a purple sphere. It is also important to add that the Tennessee and Cumberland rivers are shown in blue towards the edges of the maps.
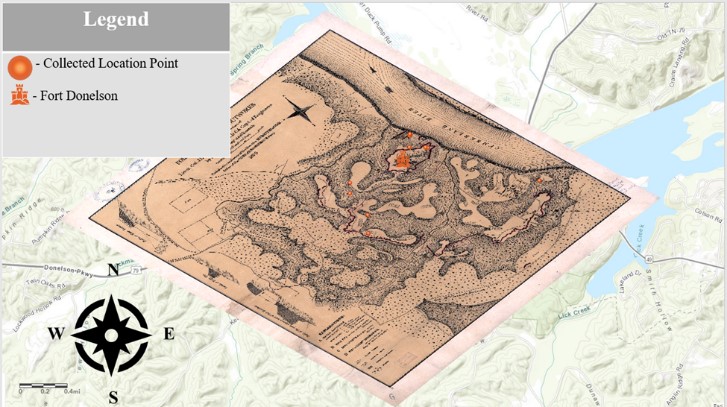
Plan of Fort Donelson and its outworks. [Feb.1862]” map (1875) contributed by McPherson [8] was georeferenced using ArcGIS Pro to increase the geographical accuracy of the image to fit the modern location of Fort Donelson (Figure 2). The map has 5 control points with a forward error of 69.19 and an inverse error of 67.22. The map shows two images. The one on left shows an overview of the image on the right. The image on the left was taken while in the field. There was a boat hauling coal about 543.53 meters away from the heavy gun. This value was determined by the measure function in ArcGIS Pro. Fort Donelson is marked with an orange castle. There are orange points on the map that will display a metadata pop-up. These points were collected in person using the Esri Collector app.
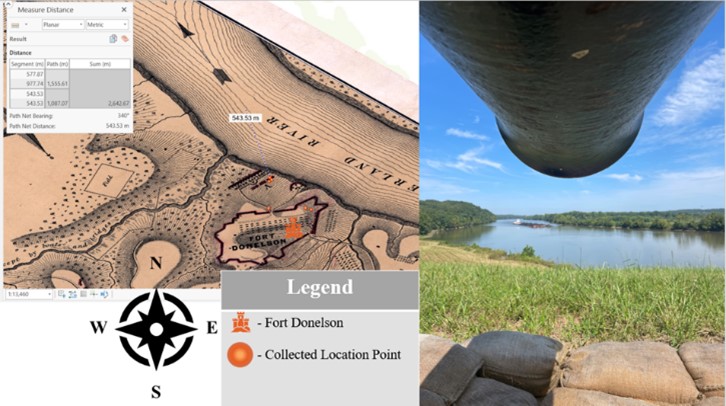 Figure 2. Comparing Map of Fort Donelson and Real-World Perspective. The map has 5 control points with a forward error of 69.19 and an inverse error of 67.22. The scale is 1:13,460, so every centimeter is equal to 13,460 cm in the real world. The map shows two images. The one on left shows an overview of the image on the right. The image on the left was taken while in the field. There was a boat hauling coal about 543.53 meters away from the heavy gun. This value was determined by the measure function in ArcGIS Pro.
Railroad and Rivers.
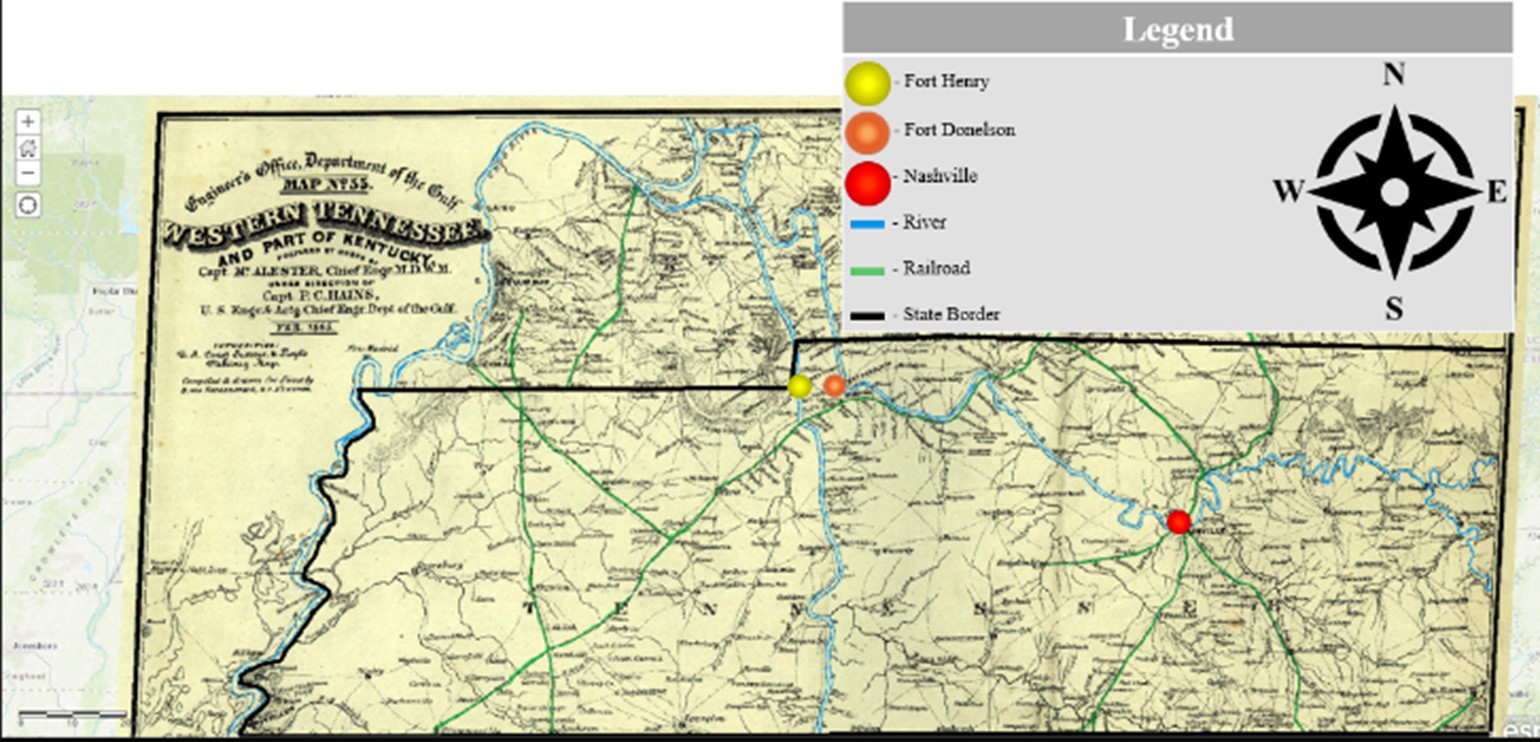
The “Western Tennessee, and part of Kentucky” map (1865) contributed by Von Reizenstein and D’Avignon [9] was georeferenced using ArcGIS Pro to bring attention to the significant mediums of transportation around the forts during the Civil War (Figure 3). The map has 13 control points with a forward error of 4747.02 and an inverse error of 0.29. The map shows Fort Donelson as an orange sphere, Fort Henry as a yellow sphere, the rivers outlined with blue, and the railroad highlighted green. Fort Henry and Fort Donelson were 12 miles apart. Fort Henry was 12 miles above the Memphis Louisville Nashville railroad system. Fort Henry and Fort Donelson are also placed in a position where the Cumberland and Tennessee rivers are very close to each other. They do not get closer within the state of Tennessee.
Figure 3. Georeferenced map of Forts Henry and Donelson with the Rivers and Railroad Highlighted. The map has 13 control points with a forward error of 4747.02 and an inverse error of 0.29. The scale is 1:2,638,188, so every centimeter is equal to 2,638,188 cm in the real world Fort Henry and Fort Donelson were 12 miles apart. Fort Henry was 12 miles above the Memphis Louisville Nashville railroad system. Fort Henry and Fort Donelson are also placed in a position where the Cumberland and Tennessee rivers are very close to each other.
StoryMap.
Historical maps were taken from the Library of Congress online resource. These maps were then georeferenced using ArcGIS Pro. Information from the Civil War letters and accounts of the captures of both forts with these georeferenced maps were used together to create a StoryMap (Figure 4). This StoryMap recounts the capturing of the forts by Union forces. It does so through text paired with interactive and visual aids. The research and justification is presented in such format to facilitate learning. Education with the aid of maps was the emphasis of the StoryMap. It recounts the route of Ulysses S. Grant and provides geographical details about both forts. The StoryMap is still being developed and an unfinished project.
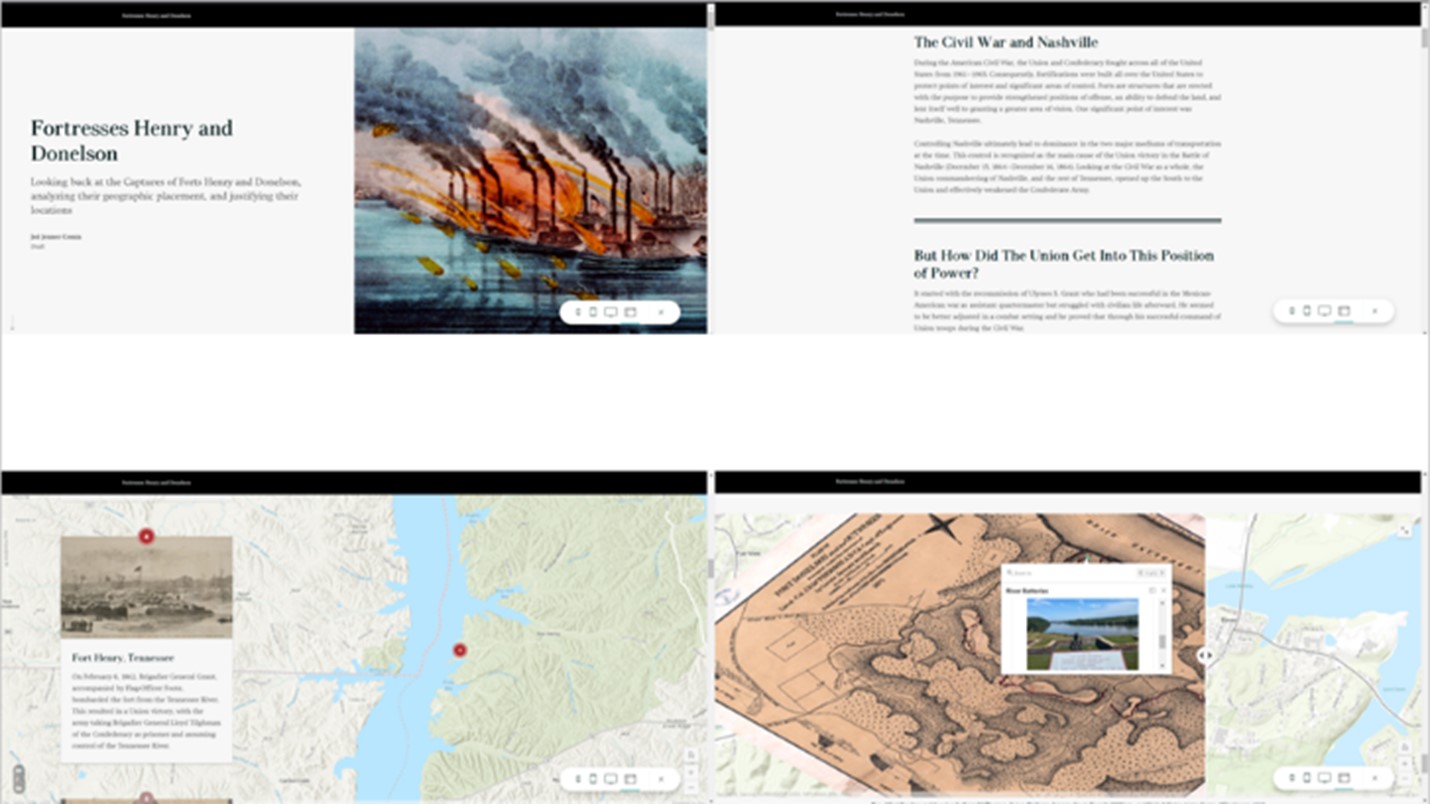 Figure 4. Fortresses Donelson and Henry Story Map. This StoryMap recounts the capturing of the forts by Union forces. It does so through text paired with interactive and visual aids. Shown is four images of the StoryMap. The top left is the landing page, the top right shows text that sets up expository information to contextualize the state of Nashville, the bottom left shows an example of the interactive map that moves along with the scrolling of the StoryMap, and the bottom right shows what happens when the user clicks on the interactive plotted points on the Fort Donelson Map.
DISCUSSION.
Fort Henry.
During the Civil War, Fort Henry was in its best possible position despite its current state. It was on the east bank of the Tennessee River right on the edge of the Tennessee border. The river allowed for easier transport of resources, soldiers, and weapons throughout the south. Traveling and transport by boat were more efficient than on foot. Though being so close to the river made it more susceptible to flooding whenever water levels rose, but if it was brought further inland those firing the heavy guns would have a much harder time shooting down enemy gunboats. This is because of the artillery technology at the time. It took draining effort from a firing crew to fire one shot out of their heavy guns. If they were further inland, they would have less time, and chances, to target the gunboat and adjust their firing to stop the attack because the visibility down the river would have been reduced. Henry’s location was also important because it was built 12 miles above the Memphis Louisville Nashville Railroad. The most efficient way resources got around during the Civil War was through the railroad system. They could carry more cargo and the system ran all throughout the south. The railroad road system allowed for more resources to be transported even when compared to travel by river.
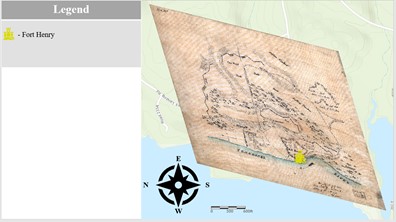
Fort Henry is currently underwater. This is due to the Tennessee Valley Authority (TVA) damming up the Tennessee River. Retelling the history of Fort Henry and integrating it into a medium of storytelling such as StoryMap is significant due to it being inaccessible and unviewable today. The simulation of these forts from the Civil War matched to the modern world play an important role in scientific discovery, especially in cases in which the forts no longer exist [3]. The combination of the historical map and the modern-day computer map allows for users to bridge the gap of inaccessibility. An interactive feature of the StoryMap includes a sweeping “Swipe” map that allows for users to drag a slider across the map to reveal and hide the “Plan of Fort Henry and its outworks” map [1864]. This feature is a useful tool to depict the changing landscape and better view the fort compared to a real-world visit.
Fort Donelson.
Today, Fort Donelson is preserved national battlefield site. Many original items and earthworks were preserved in an effort to protect history. Some parts of the land were hinted at being changed in order to restore it to its former state. This would include remaking earthworks, making new sandbags, and replacing old wooden structures.
Fort Donelson is also an important landmark to consider. One of the most significant factors is that the forts are placed 12 miles apart from each other. Also, they are built at points where the Cumberland River and the Tennessee River are the closest together in the state of Tennessee. They could not build the forts further north, where the rivers are much closer together, because that was not Confederate land. The forts are in the most ideal locations where they can be near each other, the railroad system, and both rivers.
Compared to Fort Henry, the Confederacy took a different approach when building Fort Donelson. It was built at a higher elevation from the Cumberland, already making it less susceptible to flooding. This also meant that if the Union wanted to invade through the Cumberland they would have literally had to fight an uphill battle. The engineers at Fort Donelson increased this advantage by using the earth on the bank of the river to create their earthworks and further their elevation advantage. Fort Donelson’s river placement is also ideal because their heavy guns are positioned to aim where there is a bend in the river. This means that the river had a natural bend, making those who had to go down it slow down to turn. The guns are facing this turn, making the boats more vulnerable and easier to target.
As shown in the georeferenced map of Fort Donelson (Figure 2), Fort Donelson is better conserved when compared to its counterpart. This allowed for data to be collected which allows for greater to detail to understand the past. An interactive feature of the StoryMap includes a pop-up information box that reveals itself when clicked. This pop-up includes geographical data about the specific points taken at Fort Donelson
As shown in (Figure 2), the perspective from the cannon is compared to the aerial view of the real-world location. These two pictures are two different views of the same place. It emphasizes the bend in the river. Luckily enough, a boat transporting coal arrived about 543.53 meters away from the heavy guns. The placement of these weapons maximizes the advantages of the natural landscape.
CONCLUSION.
Comparing the real-world elevation difference to what is perceived through the historical information would be a future direction when continuing this research. Elevation is an important factor to consider in the context of war especially because its effects on line of sight. Line of sight is the view from one point to another across terrain or surface [10]. It has also been used it analyze view from on top of tall buildings in a path of a sniper [11]. Analyzing the line of sight of different elevations at fort locations to further justify their positioning is another future direction for this study.
After being completed, the StoryMap can be referenced as an educational resource. The StoryMap will be available to anyone interested in Civil War-era Tennessee. It contains information about the unviewable Fort Henry. Its interactive nature and maps lend well to recreating history. Another path available would be to fully complete the StoryMap and study its effectiveness as an educational tool. This would be done through research to determine if the interactive nature of the maps and accompanying text can help students understand the then engineering decisions of the war in a more robust way.
Justifying the placement of these forts through narrative and maps presents the possibilities of GIS. By that, GIS allows for a wide audience to understand the thought process of engineers when building the forts in a format that is easier to digest due to it reading as a story and the accompanying visuals. The combination of historical records and information with a modern tool, such as GIS, adds to the possibility of developing other online resources for education.
SUPPORTING INFORMATION.
Figure S1. Georeferenced Map of Fort Henry and its Outworks
Figure S2. Georeferenced Map of Fort Donelson
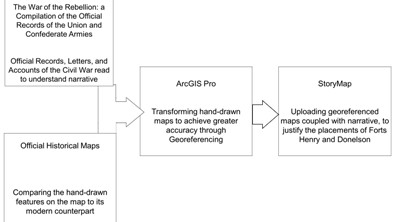
Chart S3. From the Historical Records to Map Making and Finally to StoryMaps
REFERENCES.
[1] “Fortification | military science | Britannica”
[2] N. Lercari, “Simulating History in Virtual Worlds,” in Handbook on 3D3C Platforms: Applications and Tools for Three Dimensional Systems for Community, Creation and Commerce, (Springer International Publishing, 2016), pp. 337–352.
[3] D. R. Mandel, Simulating History: The Problem of Contingency. Analyses of Social Issues and Public Policy, vol. 3, no. 1, 177–180, (2003)
[4] United States et al., “The War of the Rebellion: a compilation of the official records of the Union and Confederate armies” (Washington: Govt. Print. Off., 1880)
[5] “Sketch showing the relative positions of Fort Henry and Fort Donelson : with the roads connecting the two places,” Library of Congress, Washington, D.C. 20540 USA.
[6] “Overview of georeferencing—ArcGIS Pro | Documentation.”
[7] “[Plan of Fort Henry and its outworks.,” Library of Congress, Washington, D.C. 20540 USA
[8] “Plan of Fort Donelson and its outworks. [Feb. 1862],” Library of Congress, Washington, D.C. 20540 USA.
[9] “Western Tennessee, and part of Kentucky,” Library of Congress, Washington, D.C. 20540 USA.
[10] “Line of Sight in GIS – GIS Lounge.”
[11] J. E. VanHorn and N. A. Mosurinjohn, Urban 3D GIS Modeling of Terrorism Sniper Hazards. Social Science Computer Review, vol. 28, no. 4, 482–496, (2010)
Posted by John Lee on Saturday, May 7, 2022 in May 2022.
Tags: Civil War, GIS, Maps, Tennessee

