Impact of GFP Overexpression on CHO Cell Metabolic Phenotype Alongside a Gene of Interest in an IgG-producing CHO Cell Line
ABSTRACT
Monoclonal antibodies (mAbs) hold significant promise in biomedical research and therapeutic applications, with Chinese hamster ovary (CHO) cells being the predominant platform for their production. This study focuses on optimizing mAb production by engineering CHO cells to overexpress a “gene of interest” (GOI) using a cumate-switch PiggyBac (PB) transposon vector system, while also co-expressing Green Fluorescent Protein (GFP) for visualization and selection purposes. The modified vector selectively expresses GFP, allowing for the investigation of metabolic implications associated with GOI overexpression. Plasmid construction, DNA gel electrophoresis, and cell transformation techniques were employed to generate stable CHO cell lines expressing only GFP. Viability assays confirmed successful integration of the modified vector into the cell population under puromycin selection. Results indicate high viability rates and stable cell line establishment, suggesting effective integration of the expression cassette. This study lays the groundwork for future studies exploring the metabolic and gene expression profiles of IgG-expressing CHO cell lines engineered to express the GOI, paving the way for optimizing mAb production while maintaining cellular health. Future directions may involve fine-tuning gene expression levels to maximize productivity while ensuring cellular viability, thus advancing biopharmaceutical production and biomedical research endeavors.
INTRODUCTION.
Monoclonal antibodies (mAbs) are receiving more praise for their clinical applications in recent years. There have been 162 antibody approvals as of June 2022 [1]. The mAbs are identified in the top class of biopharmaceuticals and are being used within biomedical research to find treatments for cancers and other human diseases [2]. For example, Herceptin (trastuzumab) is a monoclonal antibody engineered in 1998 that is used to treat breast cancer [3]. Increasing antibody production is essential to meet the growing demand to treat human diseases.
Chinese hamster ovary cells (CHO) are the most prominent industrial hosts that account for 84% of recently approved cell lines for biopharmaceuticals and produce 71% of FDA-approved mAbs [4,5]. CHO cells are capable of carrying out post-translational modifications (PTMs) that closely resemble those seen in human cells [6]. PTMs are critical for the proper folding, stability, and function of proteins, including mAbs [7,8]. This similarity in PTMs ensures that the mAbs produced in CHO cells are more likely to be biologically active and safe for treatment in humans [9]. In addition, CHO cells thrive in serum-free media, offering defined conditions, improved reproduction definition, easier purification, and lower contamination risk [10].
Recent findings have shown that constitutive overexpression of a “gene of interest” increases mitochondrial metabolism and mAb specific productivity. However, the cell growth was attenuated when compared to the parent line. Here, we hypothesized that overexpressing the GOI at the stationary phase will promote maximal cell-specific productivity (qP) while enabling the culture to reach a high VCD during the growth phase. Our work uses an engineered cumate-switch PiggyBac (PB) transposon vector, allowing the co-expression of the GOI and GFP in the presence of cumate. The primary objective of this research is to modify the expression cassette to exclusively express GFP, thereby elucidating the metabolic consequences of GOI overexpression and its interplay with cellular metabolic responses.
GFP expression can be used as a selection marker that ensures expression cassette integration into the host genome [11]. Overexpression of the GOI has shown to increase mAb production and IgG productivity, and GFP identifies the expression levels of the GOI to help researchers visualize its effects. Here, we must identify whether the GOI or GFP is compromising cell growth. Co-expressing the GOI and GFP in an independent manner can help determine which, if not both, is limiting cell growth. Independently overexpressing GFP only is expected to have no negative effects on cell growth compared to the CHO parental line.
MATERIALS AND METHODS.
Construction of plasmid.
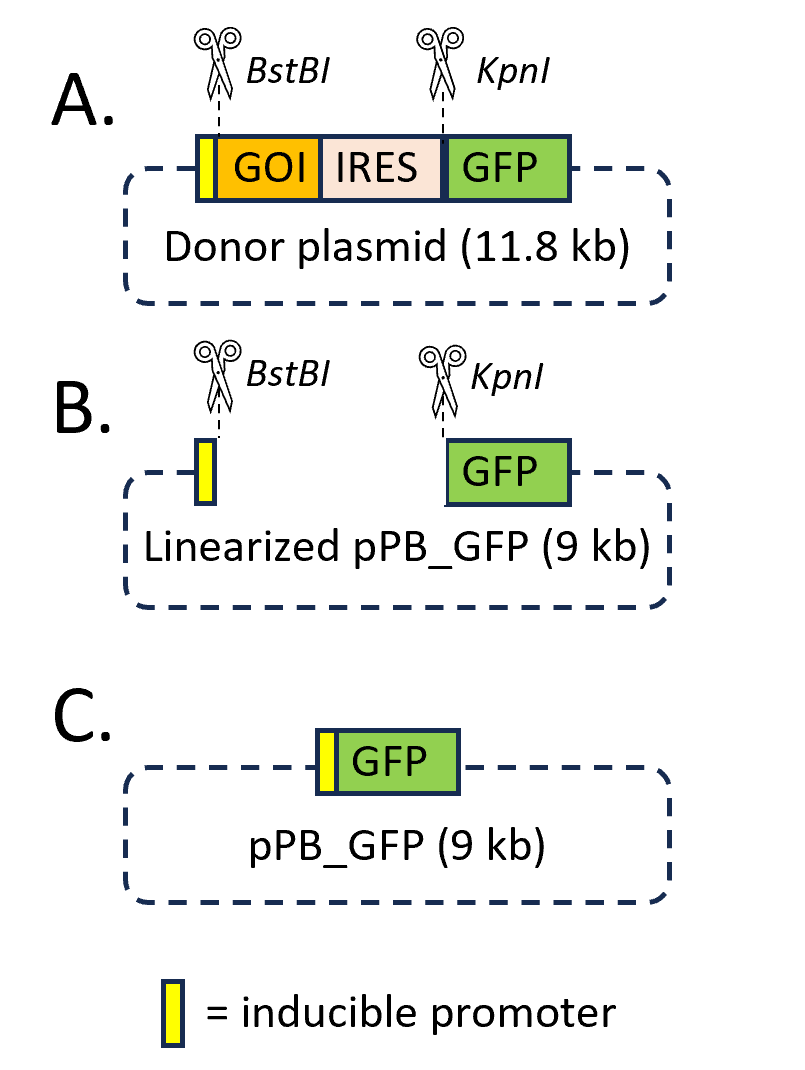
The piggyBac transposon (donor plasmid) co-expressing the GOI and GFP and the piggyBac transposase (helper plasmid) were obtained from System Biosciences (Palo Alto, CA, USA). For the construction of the donor vector overexpressing GFP-only (pPB_GFP), the GOI cDNA sequence was excised by restriction enzyme double digestion at the BstBI and KpnI sites, as shown in Figure 1. For this step, the BstBI and KpnI-HF enzymes were purchased from NewEngland Biolabs (Ipswich, MA, USA). Briefly, 1 μL (20 units) of KpnI-HF was added into the digestion reaction containing 1 μg of donor plasmid and 1X of rCutSmart Buffer in dH2O for a total reaction volume of 50 μL, including room for 1 μL (20 units) of BstBI. The reaction was incubated at 37 °C for 10 minutes. After 10 minutes, the 1 μL of BstBI was added to the tube. The new reaction was then incubated at 65 °C for 10 mins in accommodation to the newly added BstBI. The digested donor plasmid was run in a 1.0% Agarose DNA gel to confirm if the digestion occurred successfully. After obtaining the DNA fragment of interest by gel extraction, the linearized vector must be ligated together to form circular DNA. Before ligating pPB_GFP, the nucleic fragment ends must be compatible with one another. Since the BstBI and KpnI-HF enzymes cut in such a way that overhangs are created, without the Quick BluntingTM Kit, the ligation would not be achieved. The Quick BluntingTM Kit (NewEngland Biolabs, MA, USA) uses a blunt enzyme mix that can either add nucleotides to the overhanging ends, or it can cut off the overhanging ends to create a blunt end. If both sides have blunt ends, then they are compatible with each other to undergo self-ligation.
Agarose Gel Electrophoresis.
Agarose gel electrophoresis was employed to check the progression of a restriction enzyme digestion (Figure 1A) and to size fractionate the linearized vector (Figure 1B), which then could be purified from the gel. The DNA agarose gel was made by dissolving 0.5 g of solid agarose powder in the electrophoresis 1X buffer (Tris-AceticAcid-EDTA, TAE). To make the DNA visible in the gel, 2.5 μL of ethidium bromide was added to the gel solution. This positively charged polycyclic aromatic compound binds to DNA by inserting itself between the base pairs (“intercalation”). The 1-kb DNA ladder (NewEngland Biolabs, MA, USA) was co-electrophoresed with DNA samples for appropriate fragment size determination. After electrophoresis, the gel was imaged using a Li-Cor IR imager (Li-Cor Biosciences, Lincoln, NE). After imaging, the desired bands were visualized in the gel placed on a UV light box. The linearized vector for self-ligation of pPB_GFP plasmid construct was then extracted (Figure 1C). The DNA bands were seen by exposure of the gel to ultraviolet light, due to the large increase in fluorescence of the ethidium bromide upon binding to the DNA.
Cell Transformation and DNA Purification.
The pPB_GFP plasmid was amplified in Escherichia coli MAX EfficiencyTM Stbl2TM competent cells from ThermoFisher and purified using the DNA extraction kit (NewEngland Biolabs; Ipswich, MA) following manufacturer’s protocol. Following transformation, a 100 mM Ampicillin LB Agar plate was streaked with 100 μL of the transformed cells to allow colonies to grow overnight at 37°C. The Midiprep Plasmid kit from Qiagen (Qiagen; Germantown, MD) was used to amplify and purify the constructed vector following manufacturer’s protocol.
Stable Cell Line Development.
The IgG-expressing CHO cell line, provided from an external source, was transfected using Lipofectamine™ 3000 Transfection Reagent from ThermoFisher (Invitrogen, Carlsbad, CA). On the day of transfection, cells were centrifuged and resuspended at a density of 0.2 million cells/mL in chemically defined FortiCHO™ medium (ThermoFisher). The cell suspension was distributed in 24-well plates (0.5 mL/well). Three days after lipofection, 10 μg puromycin/mL was added to select the cells stably transfected with pPB_GFP. Viability of cultures was measured using the Vi-CELL BLU Cell Viability Analyzer (Beckman Coulter, Inc., Fullerton, CA). The selection medium was replaced every 3-4 days for 24 days when stable cell lines reached viabilities greater than 90%.
RESULTS.
Successful Generation of Vector Expressing GFP alone.
To assess the success of the double digestion of the donor vector with BstBI/KpnI restriction enzymes, a DNA gel electrophoresis was performed. Three distinct DNA samples were loaded into separate lanes of the gel, as shown in Figure 2. The lane #1 featured a DNA ladder, lane #2 contained the uncut donor plasmid, and lane #3 contained DNA fragments after the double BtsBI/KpnI digestion, which excised the gene of interest (GOI) fragment from the expression cassette.
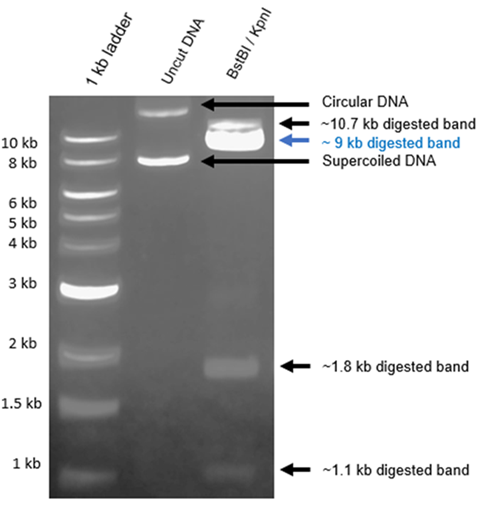
Notably, lane #2 exhibited the uncut plasmid, yet it revealed the presence of two distinct bands. This unexpected outcome can be attributed to the DNA purification process applied to the transformed cells. During this process, a substantial proportion of supercoiled plasmid DNA is obtained. Supercoiled DNA adopts a more compact, twisted configuration, representing its native conformation as commonly found in vivo. This conformation arises due to the introduction of additional twists into the double-helix structure. In plasmid DNA preparations, this superhelical tension remains unresolved, as the ends of the plasmid are interlinked. Consequently, supercoiled DNA exhibits faster migration in an agarose gel than expected for its size, as depicted in Figure 2, owing to its distinctive conformation.
This phenomenon can be elucidated by the fact that supercoiled DNA, due to its compact, coiled nature, experiences less retardation in migration through the agarose gel compared to its circular (non-coiled) counterpart of the same size. The subsequent digestion process is intended to resolve these differences by separating various DNA fragments, facilitating the efficient extraction of the GFP-only expressing vector (pPB_GFP). However, it is important to note that complete extraction of the 9-kilobase (kb) isolated DNA fragment is not guaranteed, as digestion efficiency is not always 100%, as demonstrated in Figure 2. Consequently, the isolated 9 kb DNA fragment from gel lane #3 underwent further scrutiny, including an evaluation of the compatibility of its ends and subsequent self-ligation.
The ligated DNA mixture was transformed into competent cells following the manufacturer’s protocol to select successfully ligated vector. Twenty-four hours post-transformation, colonies were observed on streak plates. Colonies from these plates were selected and cultured in 14-mL Falcon tubes to enhance the yield of plasmid DNA from each colony. For colonies to be observed following overnight culture, it was imperative for the taken-up plasmids to possess the ampicillin resistance gene, ensuring survival under antibiotic selection. This step effectively eliminated vectors lacking ampicillin resistance. From the grown colonies, six were chosen for further analysis to determine the presence of the cassette of interest.
In Table 1, two selected colonies were subjected to analysis to verify the correct vector integration. In lane #1, a negative control was included, which consisted of the donor plasmid, or the original vector used for digesting the GOI fragment. The use of the AgeI and AhdI enzymes for digestion at these sites resulted in the control vector being divided into three distinct fragments. After the excision of the GOI and IRES sequences from the control vector, a subsequent digestion using the same enzymes yielded only two fragments instead of one. This observation served as an indicator for confirming the presence of the purified plasmid from the colonies, with the excised GOI and IRES fragments. In the case of colony #1, the plasmid was separated into four fragments, with the uppermost fragment corresponding to the uncut plasmid. These fragment sizes matched those of the negative control, strongly suggesting that the plasmid obtained from colony #1 is identical to the negative control vector.
| Table 1. Confirmation of constructed GFP-expressing only plasmid by restriction enzyme digest. | ||
| Lane | Condition | Fragment size |
| 1 | 1 kb DNA ladder | – |
| 2 | Donor plasmid (AgeI/AhdI) | 11,985 bp (uncut); 9,036 bp; 2,764 bp; 2,107 bp |
| 3 | Colony #1 (AgeI/AhdI) | 11,985 bp; 9,036 bp; 2,764 bp; 2,107 bp |
| 4 | Colony #2 (AgeI/AhdI) | 11,985 bp; 9,036 bp; 2,764 bp |
However, for colony #2, two distinct fragments were observed in the digested plasmid. This discrepancy indicates that the enzymes, which cut at three sites in the negative control, only cut at two sites in the plasmid obtained from colony #2. This finding aligns with expectations, as one of the enzyme sites was removed during the excision of the GOI/IRES fragment from the donor vector. The purified plasmid sequences were confirmed by DNA sequencing, ensuring successful construction of GFP-only plasmid obtained from colony #2. These results provide valuable insights into the successful integration of the target vector into the colonies tested, confirming the presence of the plasmid of interest.
Transfection of Vector Expressing GFP alone.
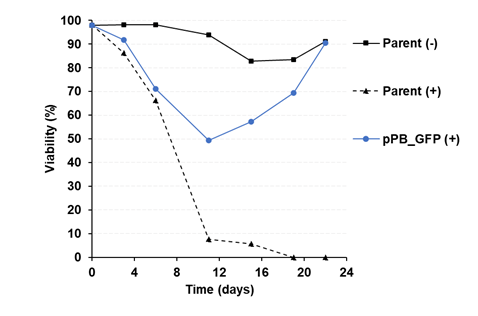
To stably transfect the pPB_GFP in the industrial CHO cell line, three experimental conditions were examined: the negative control (Parent -) without puromycin, the positive control (Parent +) with puromycin, and the experimental condition (pPB_GFP +) with puromycin. The viability of these cell lines was monitored over a specified time course, as shown in Figure 3. In line with expectations, the negative control cell line (Parent -) displayed consistent growth under standard culture conditions without puromycin. However, the positive control (Parent +) exhibited a decline in viability after 4 days of puromycin exposure, indicating sensitivity to the selection pressure. The experimental condition (pPB_GFP +) initially showed a similar reduction in viability, as anticipated due to a low transfection efficiency, resulting in a subset of cells that did not integrate the plasmid or had insufficient copy numbers to withstand puromycin-induced selection. Notably, a significant divergence in viability was observed between the positive control (Parent +) and the pPB_GFP condition after 11 days of puromycin exposure. The positive control continued to exhibit a decline in viability, ultimately failing to recover. In contrast, the pPB_GFP condition displayed a remarkable recovery in viability, signifying successful integration of the expression cassette into a substantial fraction of the cell population. The predetermined criterion for establishing stable cell lines was met on day 22, when the pPB_GFP condition achieved a viability threshold of 90%. Moving forward, the positively transfected cell pools will serve as the foundation for in-depth investigations. Specifically, we intend to examine the GFP-expressing cell line in isolation and compare its metabolic phenotype and gene expression profiles with those of the cell pool containing both the GFP and the target gene of interest (GOI).
DISCUSSION.
The successful modification of the vector to selectively express GFP is a crucial step in this research. Our results from DNA gel electrophoresis (Figure 2) revealed that the extraction of the 9-kb DNA fragment was not guaranteed. This could be attributed to incomplete digestion, which may have left some plasmids in a supercoiled conformation. Supercoiled DNA migrates more rapidly in an agarose gel due to its compact structure, which can lead to difficulties in extracting the desired fragment. Despite the suboptimal digestion efficiency, it is essential to highlight our achievement of successfully obtaining the excised fragment from the extraction. This success was further validated through DNA sequencing, confirming the presence of the GFP-only expressing vector.
The high viability rate observed in the pPB_GFP+ cell line (Figure 3), reaching a threshold of 90%, is indicative of the genome integration of our modified vector into a substantial proportion of the cell population. This accomplishment sets the stage for the next phase of our investigation, which will delve into the intricate aspects of the metabolic phenotype and gene expression profiles of these stable cell lines.
CONCLUSION.
This study demonstrates the successful modification of a vector to selectively express GFP in IgG expressing CHO cells, confirming the presence of the purified plasmid with the excised GOI. Moreover, it highlights the establishment of stable cell lines under puromycin selection, indicating the successful integration of the expression cassette. The findings suggest the potential for enhancing monoclonal antibody production in CHO cells by elucidating the interplay between genes, specifically between cell lines that express GFP and the target GOI. Future directions may involve in-depth investigations into the metabolic phenotype and gene expression profiles of these cell lines. Comparing these profiles between the GFP-expressing cell line and the cell pool containing both GFP and GOI could provide insights into their respective contributions to enhanced antibody production. Additionally, further studies might focus on optimizing the conditions for maximal monoclonal antibody production while maintaining cell growth and viability. This could involve fine-tuning the timing and level of gene expression to strike a balance between productivity and cellular health. In conclusion, this research sets the stage for a deeper understanding of the intricate mechanisms governing monoclonal antibody production in CHO cells, with potential applications in biopharmaceutical production and biomedical research.
ACKNOWLEDGMENTS.
We would like to give our thanks to the Young Lab for granting us this opportunity to learn and conduct research with their materials. We would also like to acknowledge the School for Science and Math at Vanderbilt for their guidance, and in particular Dr. Ana Villanueva for her devotion and support throughout our research.
REFERENCES.
- X. Lyu et al. The global landscape of approved antibody therapies. Antib. Ther. 5, 233–257 (2022).
- X. Geng et al. Research and development of therapeutic mAbs: An analysis based on pipeline projects. Hum. Vaccines Immunother. 11, 2769–2776 (2015).
- R. O. Dillman, Perceptions of Herceptin: a monoclonal antibody for the treatment of breast cancer. Cancer Biother. Radiopharm. 14, 5–10 (1999).
- W. P. K Chong et al. LC-MS-based metabolic characterization of high monoclonal antibody-producing Chinese hamster ovary cells. Biotechnol. Bioeng. 109, 3103–3111 (2012).
- G. Walsh, Biopharmaceutical benchmarks 2014. Nat. Biotechnol. 32, 992–1000 (2014).
- S. Fischer, R. Handrick, K. Otte, The art of CHO cell engineering: A comprehensive retrospect and future perspectives. Biotechnol. Adv. 33, 1878–1896 (2015).
- J. M. Lee, H. M. Hammarén, M. M. Savitski, H. S. Baek, Control of protein stability by post-translational modifications. Nat. Commun. 14, 201 (2023).
- Y. C. Wang, S. E. Peterson, J. F. Loring, Protein post-translational modifications and regulation of pluripotency in human stem cells, Cell Res. 24, 143–160 (2014).
- J. Dumont, D. Euwart, B. Mei, S. Estes, R. Kshirsagar, Human cell lines for biopharmaceutical manufacturing: history, status, and future perspectives. Crit. Rev. Biotechnol. 36, 1110–1122 (2016).
- F. Li, et. al., Cell culture processes for monoclonal antibody production. mAbs. 2, 466–479 (2010).
- M. Chalfie, et. al., Green fluorescent protein as a marker for gene expression, Science, 263, 802–805 (1994).

Posted by buchanle on Tuesday, April 30, 2024 in May 2024.
Tags: Gene overexpression, Green fluorescent protein, Metabolic Engineering, Molecular cloning