Enhancing Major Depressive Disorder Detection: A Robust Text-Classification Approach using Machine Learning
ABSTRACT
This research paper addresses the global issue of adolescent suicide, with a specific focus on Major Depressive Disorder (MDD) as a leading contributor, highlighting the need for early detection. In effort to overcome detection barriers, the study employs machine learning, specifically Transformer models BERT and RoBERTa, fine-tuned using social media data from Indian users. The research design includes text extraction, data pre-processing, labelling, model training, and testing. The results indicate that both datasets, one targeting students and the other more general, display similar results, despite a notably smaller population size of the student data. This may suggest that the models perform better with a more focused dataset.
INTRODUCTION.
Suicide is becoming a prevalent issue worldwide, ranked as the fourth leading cause of death among 15-29 year-olds globally as of 2019 [1]. More so, there is an especially critical increase in global rates post pandemic, as drastic changes in lifestyle hinder mental health. In particular, India has been experiencing a persistent rise in suicide rates, with the current figures indicating the highest global incidence, totaling 164,000 suicides. Notably, a significant portion, amounting to 35%, is accounted for by adolescents [2]. Within this trend, Major Depressive Disorder (MDD) stands out as the primary contributor to suicide; in fact, among those with MDD, younger age groups are generally more vulnerable to suicidal ideation [3]. Although there are known, effective treatments for depression, fewer than half of those affected in the world (in many countries, fewer than 10%) receive such treatments [4]. Ignorance and inadequate attention to these mental health concerns, frequently observed within Indian households, are key complications in early depression detection [5]. Timely depression detection is crucial for promoting remission, preventing relapse, and reducing its emotional and financial impact, and without early detection, there is a high risk for symptom escalation [6]. The widespread ignorance and lack of awareness about MDD, not only within India but worldwide underscores the significance of tackling the issue. In order to overcome such barriers to depression detection, it becomes necessary to adopt alternative approaches. Machine learning is a rapidly developing and supported field of data evaluation, and utilising this technique may help derive more precise results with comparatively low effort. While there exist validated laboratory tests for diagnosing depression, including the Center for Epidemiological Studies Depression Scale (CES‐D), Beck Depression Inventory‐II, Geriatric Depression Scale, Hamilton Rating Scale for Depression, Patient Health Questionnaire‐9, etc., the majority of diagnoses rely on self or family reports. Compared to such traditional approaches that incur high costs and rely on voluntary disclosure, the machine learning approach identifies latent depression symptoms, and enables individuals to undergo testing at their convenience without the fear of facing social stigma. The study encompasses the process of developing a text-classification machine learning model that detects MDD present in social media, obtaining results from both the wider sample population as well as within the specific scope of Indian adolescents. Individuals express more diverse ranges of honest emotion in social media [7], making it an apt source to extract text for depression detection. Specifically, Twitter and Reddit are used to gather data due to their advanced filtering abilities. Filtering is done so that only posts by individuals of Indian nationality are utilised. This data is processed and labelled by depression types and age category. Bidirectional Encoder Representations from Transformers (BERT) is used as a base model and fine-tuned to better address the target problem and audience. Results from training with posts collected from adolescents with posts gathered without age filtering are compared. These results are assessed through recall, more highly penalising false negatives over false positives. Broadly, this paper discusses the stages of research design and execution – including data preparation, training, and testing – and analyses the appropriate results and performance of various machine learning models through statistical evaluation. Through these processes, the paper ultimately aims to conduct a comparative analysis between the outcomes derived from narrowed data and those from a wider dataset, determining the potential performance enhancement afforded by this refined targeting approach. Understanding such effects of narrowing scope may contribute to the development of more precise models for the detection of depression in the future. This is particularly significant since the treatment methods for depression varies among different age groups, necessitating a nuanced understanding to tailor interventions and support for different age groups effectively.
MATERIALS AND METHODS.
Text based data is extracted from Indian users on Twitter and Reddit. In order to gather potentially depression-related data, specific keywords associated with depression symptoms are employed. Additional non-depression-related data is scraped by randomly selecting posts within the Indian demographic filter. The data collected undergoes a pre-processing stage, which includes: truncating longer texts (limit: 5000 characters), eliminating meaningless or blank posts, removing superfluous parameters (e.g. follower count and post count), and organising duplicate posts.
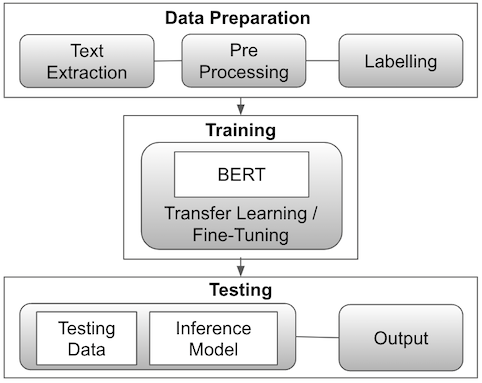
Subsequently, the data is labelled using two columns that indicate the age group and depression status. The appropriate criterion is as follows:
is_student
- 2 (Student): The post / user id / user description mentions that the author is a student (or was a student when the post was written) or it is implied that they are a student
- 1 (Identity Unknown): The post / user id / user description does not clearly mention identity or age
- 0 (Non-Student): The post / user id / user description mentions that the author is a non-student individual
*all individuals who are in school or have graduated college recently are eligible for a student
is_depressed
- 1 (Depressed): The post is written about oneself; the post discusses symptoms commonly associated with MDD or explicitly discusses depression
- 0 (Not Depressed): The post does not discuss symptoms commonly associated with MDD or depression that they themselves have
The labelled data is then put into the training model. Text tokenisation is conducted, during which the training model limits the count to 512 tokens. Padding is applied with an attention mask. For training, Huggingface’s transformers library is employed, with PyTorch as the backend framework. The main base model for data training is BERT, and results from Robustly Optimised BERT Pre-training Approach (RoBERTa) are also obtained to ensure an alignment in the trends observed for pattern generalisation across models.
BERT (Bidirectional Encoder Representations from Transformers) is a Google-developed NLP model which excels in understanding language context bidirectionally. RoBERTa (Robustly Optimised BERT Approach), an enhancement by Facebook AI, optimises BERT with more data and training time. The choice in the main base model is widely recognised by other papers that discuss text classification. Baghdadi et al. employ BERT for suicide risk assessment through Twitter text classification [8]. This choice is attributed to BERT’s utilisation of the transformer architecture besides several other training techniques, which yield state-of-the-art performance. Another paper utilises the BERT model for developing an attention depression detection model, highlighting its high accuracy due to fine-tuning that adapts hyper-parameters through additional training on unlabelled data [9]. They also emphasise BERT’s use of a transformer structure with attention, enhancing its stability compared to existing models, particularly regarding gradient loss and explosion. Other papers in regards to text classification – e.g. by Wang et al. and Inamdar et al. [10][11] – utilise BERT with similar rationale. The utilisation of BERT in numerous prior research papers with such objectives becomes motivation for its incorporation in this paper.
Within BERT, pre-trained checkpoint bert-base-uncased (the model does not distinguish cased and uncased text) by huggingface is implemented and fine-tuning is done on the base model. Results are collected separately for data with age filtering and without. Therefore, pre-processed data is split into 80%, 10%, 10%, for training, validation, and testing, respectively, for each 5,114 data without age filtering and 1,153 with age filtering (More detailed information about data distribution can be found online in Table S1. of the paper’s supplemental information). A cross entropy loss function is employed to assess the model’s performance throughout the training process, and AdamW is used as the optimiser. The cross entropy loss function serves as a key metric in model optimisation and evaluation in machine learning by quantifying the disparity between predicted and actual probability distributions in classification. AdamW is a variant of the Adam Optimisation Algorithm, which enable more efficient optimisation by dynamically adapting the learning rate for each parameter to improve convergence and stability in training models. AdamW differs from thee standard Adam algorithm as it incorporates weight decay directly into its update step, helping to prevent overfitting by regularising model parameters [12]. Hyper-parameters, including epoch and learning rate, are selected for each specific training model or type using a grid search tuning strategy.
RESULTS.
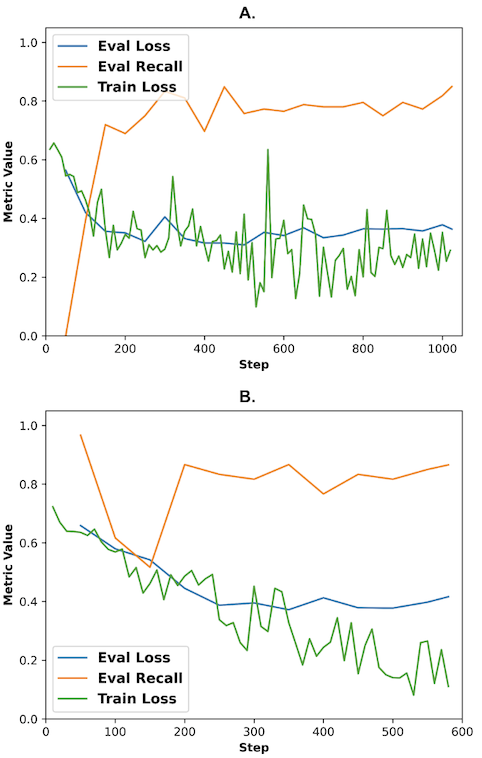
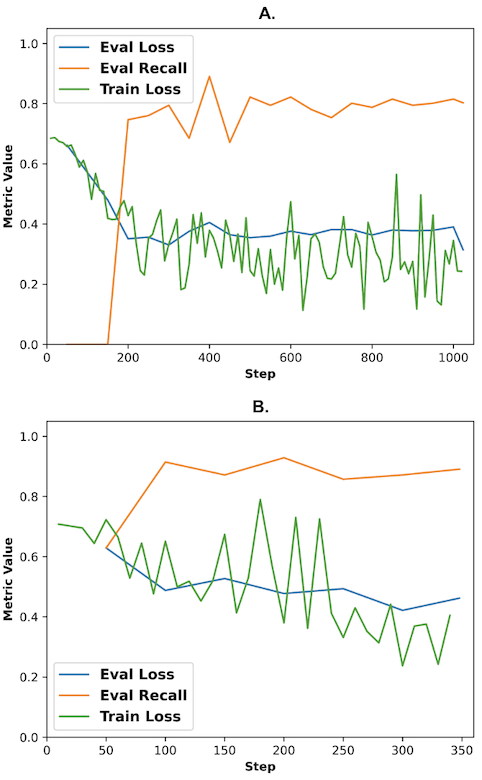
For result evaluation, the cross entropy loss is utilised with class weights due to the imbalance in data. Results are collected separately for data labelled as student and the total sample population for both BERT (Fig. 2) and RoBERTa (Fig. 3).
Results are assessed through confusion matrices. Confusion matrices are performance evaluation tools for classification models. A binary confusion matrix is composed of four distinct components: true positive, false positive, true negative, and false negative, each comparing actual and predicted values of the test case. Using these results, other matrices such as recall, accuracy, precision, f1 score may be derived. The test results of this study are evaluated through recall, though other matrices are also checked to ensure authenticity.
Recall, otherwise known as true positive rate or sensitivity, is calculated by dividing the number of true positives (positive samples classified as positive) by the total number of positive samples, representing the percentage of correctly identified positives. This approach of finding the “completeness” of the positive predictions proves particularly useful in depression detection, where the goal is to maximise the number of correct depression identification.
While similar, precision is calculated by dividing the number of true positives by all the instances that the model classified as positive. This provides information about the accuracy of positive predictions. The f1 score takes into account both false positives and false negatives, providing a single value that balances precision and recall. It is measured by dividing the product of precision and recall by the sum, and multiplying the total by 2. Lastly, accuracy measures the “overall correctness” of the classification model, calculating the proportion of correctly classified instances out of all instances. Table 1. lists the appropriate matrix results:
The training methods achieved the highest recall of 0.891, attributed to RoBERTa trained with student data. The graphs depict a stable pattern in both recall and loss, ignoring few pronounced fluctuations observed initially. The shapes generally indicate a positive gradient for recall and a negative gradient for loss, aligning with the desired training pattern. Through these figures, it can be observed that results pertaining to student data present a substantially higher if not similar recall than results from the entire sample population despite its significantly smaller dataset size; this trend can also be observed from precision and f1 score, both of which display higher values for data with a narrowed scope (refer to Table 1.). Meanwhile, the elevated evaluation loss observed in both student cases may be attributed to the limited dataset size in comparison to the size of the entire sample population.
| Table 1. Test Results (rounded to 3sf) | ||||
| Scope & Model | all_bert | student_bert | all_roberta | student_roberta |
| loss | 0.364 | 0.416 | 0.314 | 0.462 |
| accuracy | 0.860 | 0.836 | 0.893 | 0.862 |
| precision | 0.685 | 0.853 | 0.819 | 0.864 |
| recall | 0.850 | 0.866 | 0.803 | 0.891 |
| f1 score | 0.758 | 0.859 | 0.811 | 0.877 |
DISCUSSION.
In this study, pre-trained machine learning model BERT (and RoBERTa) was fine-tuned then applied to predict the depression risk based on data from Reddit and Twitter through text classification. The results display similar preferences towards both the dataset targeting students and the broader dataset despite the difference in the size of the population. This observation may suggest that the models’ efficacy in prediction is higher when applied within a more focused context, since a smaller training dataset hinders the model’s ability to generalise or more thoroughly learn the patterns present in the data, which often leads to lower results. A potential rationale for this outcome is that the unique prevalent causes for specific demographics create a clear pattern for the model to follow. In the case of the adolescent group examined in this study, a notable correlation was identified between depression and the heightened emphasis on academic achievement and familial expectations. By tailoring the dataset to specifically address this single group, the machine learning model gains the capacity to focus on these salient influential factors unique to this demographic. In essence, this approach filters out extraneous variables that may be present in a broader dataset, thereby enabling it to prioritise and weigh features most relevant to the specific demographic. Nevertheless, this study does not establish any definitive causal relationship between the narrowed scope and the heightened recall; this hypothesis may be tested further through an extension of this paper.
Refining the scope of depression detection can improve efficiency in tailoring treatment strategies to suit the unique characteristics and requirements of different age groups. This is particularly crucial since treatment approaches may vary significantly across age groups, primarily due to the differences in life experiences thus the underlying causes of their depression. For instance, adolescents often necessitate active involvement from parents or legal guardians, and family therapy is frequently integrated into their treatment. Their treatment focuses on issues such as peer relationships, academic performance, and family dynamics that are particularly relevant to their developmental stage. Medication, especially when dealing with the developing brain at this age, is handled cautiously due to the potential for certain medications to disrupt the brain’s natural maturation process, which may lead in lasting consequences.
Finally, it is essential to recognise the limitations of the study. Notably, a significant portion of the data is sourced from Reddit, which typically have longer text size (average of 934 characters per data) compared to other platforms. Thereby the fine-tuned model may not be ideally suited for shorter text content on posts from other social media platforms such as Twitter. Further, when obtaining training data, more than 60% of the data was gathered using specific keywords, potentially introducing bias into the model despite the diversified keyword selection. Moreover, the data labelling process involved two individuals, potentially resulting in inconsistencies or biases in the labelling process despite the set criterion. There are various ways in which these limitations can be improved upon. The issue of text length may be addressed by expanding the training dataset and scraping data from various social platforms with shorter text content. Implementing keyword-less filtering techniques during data acquisition may help reduce potential biases introduced by keywords. Improving data quality can be achieved through expert review or crowdsourcing to ensure a more consistent and unbiased labelling process.
ACKNOWLEDGMENTS.
I extend my sincere appreciation to Mr. Gavin Kwon for his integral role in the data gathering phase of this study. His proficiency and collaborative efforts significantly enhanced the project’s quality and efficiency.
SUPPORTING INFORMATION.
Additional supporting information includes:
Table S1. Data Distribution.
Table S2. Training Hyperparameter Configuration.
REFERENCES.
- Suicide worldwide in 2019. World Health Organization (2021), (available at https://www.who.int/publications/i/item/9789240026643).
- Chiang et al., The relationship between depressive symptoms, rumination, and suicide ideation in patients with depression. International journal of environmental research and public health, 19(21), (2022).
- P. Singh, Startling suicide statistics in India: Time for Urgent Action. Indian journal of psychiatry, 64(5), (2022).
- World Health Organization (2023), (available at https://www.who.int/india/health-topics/depression).
- Thomas, Charted: India’s shocking attitudes towards mental illness. Quartz (2018), (available at https://qz.com/india/1237314/fear-and-apathy-how-indians-look-at-those-suffering-mental-illnesses).
- Halfin, Depression: The benefits of early and appropriate treatment. AJMC, 13(4), 92-97 (2007).
- F. Waterloo, S. E. Baumgartner, J. Peter, P. M. Valkenburg, Norms of online expressions of emotion: Comparing Facebook, Twitter, Instagram, and WhatsApp. New media & society, 20(5), 1813–1831 (2018).
- A. Baghdadi et al., An optimized deep learning approach for suicide detection through Arabic tweets. PeerJ Computer Science, 8, 1070 (2022).
- Park, N. Moon, Design and implementation of attention depression detection model based on multimodal analysis. MDPI, 14(6), 3569 (2022).
- Wang et al., Depression risk prediction for Chinese microblogs via deep-learning methods: Content analysis. JMIR Medical Informatics, 8(7), 17958 (2020).
- Inamdar, R. Chapekar, S. Gite, B. Pradhan, Machine learning driven mental stress detection on reddit posts using natural language processing – human-centric Intelligent Systems. Human-Centric Intelligent Systems, 3, 80-91 (2023).
- Chen, ADAMW and adabelief: Optimizers based on and better than adam. Medium (2020), (available at https://cy96.medium.com/adamw-and-adabelief-optimizers-based-on-and-better-than-adam-3682c12bffc7).

Posted by buchanle on Tuesday, April 30, 2024 in May 2024.
Tags: BERT, Depression, Machine learning, Major Depressive Disorder, Text-classification