Enabling Far-Infrared Nanophotonics with 2D Materials
ABSTRACT
Infrared light is utilized in everyday devices, such as cell-phones. Currently, longer wavelengths of infrared light cannot be used in such applications due to lower quality materials and the diffraction limit of long wavelength light. Therefore, the infrared optical properties of new materials must be studied to identify novel approaches to advancing technology in this spectral range. To understand the optical properties of different materials, a dielectric function must be extracted for the spectral range of interest. For many materials, the dielectric function was originally measured several decades ago, when the measurement technology and the dielectric material quality were not as advanced. This study seeks to generate new, revised dielectric functions for several transition metal dichalcogenides. In order to extract the dielectric function, a reflectance spectrum of each material was generated and fit employing equations that describe crystalline behavior. Based on the reflectance spectra and dielectric functions, HfS2 has a broad Reststrahlen band (a highly reflective spectral band), while MoS2 and WS2 have narrow Reststrahlen bands. It was also determined that HfS2 is birefringent from 490 cm-1 to 600 cm-1. Consequently, this research provides the tools to scientists studying infrared light and nanophotonics to perform the necessary predictive calculations for appropriate devices.
INTRODUCTION.
Infrared light, or light with a wavelength of approximately 0.8-100 μm, provides an alternative view of the world. Infrared light interacts with materials in ways that visible light does not. For instance, while light in the visible spectral range is of an energy appropriate for exciting electronic excitations, infrared light interacts with molecular and crystal vibrations and rotations. This means that the resulting response to infrared light can be drastically different than visible light for the exact same material. While near infrared light (0.8-3 µm wavelength) is used in many common commercial devices, such as within cellular phones for facial recognition and remote controls, longer wavelengths (3-100 µm – the mid- and far-infrared) are inaccessible with common optical components. Specifically, many applications of interest are limited by poor quality materials and the long-free space wavelengths of light in the infrared (which limits the sensitivity of optics). Therefore, it is necessary to study infrared optical properties of new materials to identify novel approaches to advancing technology in this spectral range. Specifically, nanophotonics, or the study of light interactions with matter at the nanoscale, is widely desired for this goal.
In order to understand how nanophotonics can be achieved with infrared light in various materials, it is necessary to generate a dielectric function for these materials within this spectral range. The dielectric function is a mathematical description of how a material responds in the presence of an electromagnetic field at a given frequency [1]. The dielectric function is provided in terms of the permittivity, represented by ε, as a function of the incident light frequency, which can be measured in wavenumbers. Permittivity has a real and an imaginary component, usually denoted by Re(ε) or ε1 and Im(ε) or ε2, respectively. These components relate to the reflective and refractive properties of the material (real component) and the absorption within the material (imaginary component), with positive values for Re(ε) correlating to dielectric (transparent and refractive) behavior, while negative values represent metal-like (highly reflective) behavior. The dielectric constants, Re(ε) and Im(ε), once extracted, can be used to predict how light will interact with the material and for the predictive design of optical components and devices [2].
For many materials, the dielectric function was originally quantified decades ago, when the technologies used to measure and grow these materials were not as advanced as they are today. This can lead to significant errors in the predictive nature of the dielectric function. For instance, Geick and Perry extracted the dielectric function of hexagonal boron nitride (hBN) in 1966 [3]. However, at the time, the best hBN crystals were polycrystalline with the c-axis (perpendicular to the crystal surface) misoriented between each sub-wavelength crystal grain. Furthermore, at this time, the quality of infrared spectroscopic methods and equipment was very rudimentary. Thus, the dielectric function they extracted, while indicative of the properties of the polycrystalline material they measured, could not be used to describe the highly aligned, high purity single crystals available today. In 2014, Prof. Joshua Caldwell remeasured the infrared properties and extracted the dielectric function for hBN [4]. These results were dramatically different from the dielectric function measured by Geick and Perry. This new dielectric function predicted a new type of behavior, which has subsequently been used to create new types of infrared optical components [4,5].
This study seeks to generate new or revised dielectric functions for several different two-dimensional (2D) materials which have recently become easy to isolate and study. Two dimensional materials are characterized by strong in-plane and weak van der Waals out-of-plane bonding, allowing single-atom thick layers to be isolated, giving rise to exceptional electronic, mechanical and optical properties [5-9]. One sub-class of 2D materials is the transition metal dichalcogenides (TMDs), including MoS2, WS2, and HfS2. TMDs consist of a transition metal element and two Group 16 elements. Due to their polar chemical structure, TMDs have highly reflective spectral regions, known as Reststrahlen bands, that occur due to the infrared excitation of polar optic phonons (vibrations) in the crystal. Because of the high anisotropy in the bond strengths in versus out of the crystal plane, TMDs have an anisotropic optical response (their reflectivity depends strongly on angle). The Reststrahlen band is highly reflective because, within this spectral range, the Re(ε) becomes negative. This negative real part of the permittivity allows for coupling between light and polar crystal vibrations, forming phonon polaritons. These allow light to be confined to dimensions well beyond what can be achieved in typical dielectric materials, which are inherently subject to a diffraction limit of approximately one-half the wavelength of incident light [10]. The realization of phonon polaritons in these materials would open up doors for making new types of components in the infrared. Despite the excitement surrounding these TMD materials, the infrared response, especially in the mid- to far-infrared, is not well quantified with modern quality materials. This work’s goal is to rectify this issue and perform infrared spectroscopic measurements to extract the dielectric function so that quantified, predictive calculations can be realized for TMD based infrared devices.
In addition to TMDs, this study seeks to calculate dielectric functions of various materials whose optical constants have been recently measured in the literature and report them in an online, publicly accessible database. Thus, this research provides the required tools to scientists studying infrared light and nanophotonics, allowing them to perform the necessary predictive calculations for appropriate devices.
MATERIALS AND METHODS.
Variable Angle Reflectance Measurements.
Fourier Transform Infrared (FTIR) Spectroscopy was used to measure the reflectance of MoS2, WS2, and HfS2. In order to determine the dielectric function of these materials, the variable angle reflectance at 30˚, 40˚, 50˚, 60˚, and 70˚ incident angles was measured utilizing the VeeMax III attachment available from Pike Technologies in conjunction with the Bruker Vertex 70v FTIR spectrometer (spectral resolution 0.5 cm-1) and a QCM superconducting, close-cycle Nb-bolometer. A polyethylene wire grid polarizer was used to measure each material in both the s- and p-polarization states; the polarization of light describes the shape of an electric field (in the s-polarization state, the electric field is oriented perpendicular to the plane of incidence, while in the p-polarization state, the electric field is parallel).
Data Processing.
The separate data files for each angle and each material were compiled in Microcal OriginPro. Wollam Variable Angle Spectroscopic Ellipsometry for Windows (WVASE) was then used to fit the reflectance spectra (graphs which display the reflectance of a material as a function of frequency – shown in Figure 1) and generate the dielectric functions for the materials studied.
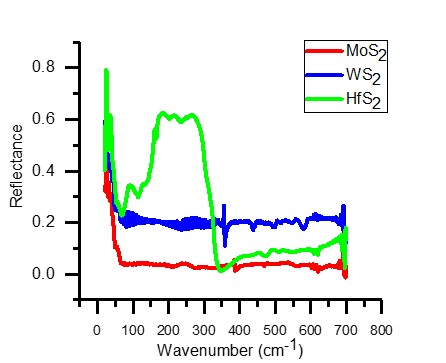
Figure 1. Reflectance spectra of HfS2, WS2, and MoS2 at 50˚ in the p-polarization state from 0 cm-1 to 700 cm-1. Although HfS2, WS2, and MoS2 are similar chemically, they behave very differently when exposed to infrared light, especially in the 150 cm-1 to 400 cm-1 range; a broad Reststrahlen band is present for HfS2 in the 150 cm-1 to 300 cm-1 range, while MoS2 and WS2 have narrow Reststrahlen bands in the 350 cm-1 to 400 cm-1 range.
Using WVASE, several oscillator equations (Lorentz, Eq. 1a; Drude, Eq. 1b; TOLO, Eq. 1c), which model various behaviors of a material, were utilized to fit the reflectance spectra in order to extract the dielectric function [1]:
\[\varepsilon \left( \omega \right) =\frac { { (\omega _{ p }) }^{ 2 }\gamma \omega }{ \left( \left( \omega _{ 0 } \right) ^{ 2 }-\omega ^{ 2 } \right) ^{ 2 }+\omega ^{ 2 }\gamma ^{ 2 } } \tag{1a}\]
\[\varepsilon \left( \omega \right) =1-(\frac { { (\omega _{ p }) }^{ 2 } }{ \omega ^{ 2 }+i\omega \gamma } )\tag{1b}\]
\[\varepsilon \left( \omega \right) =\varepsilon _{ \infty }(\frac { \left( \omega _{ LO } \right) ^{ 2 }-\omega ^{ 2 }-i{ \Gamma \omega } }{ \left( \omega _{ TO } \right) ^{ 2 }-\omega ^{ 2 }-i{ \Gamma \omega } } )\tag{1c}\]
where ε∞, ω, ωTO, ωLO, Γ, γ, ω0 and ωp represent the high-frequency permittivity, the incident frequency, the transverse (TO) and longitudinal (LO) phonon frequencies of the material, the phonon damping (scattering rate), the resonance frequency, and the plasma frequency. The Lorentz functional form (Eq. 1a) is a generic model that is used for molecular vibrational modes. The Drude and TOLO forms are both derived from the Lorentz oscillator model, with the Drude (Eq. 1b) being specific to the optical response of free electrons and holes within metals and semiconductors, and the TOLO (Eq. 1c) used to describe the infrared response of polar optic phonons (which accounts for the effects of both the transverse (TO) and longitudinal (LO) optical phonons). The variable angle reflectance spectra data were fit using these functions, allowing the dielectric function of the material to be defined.
Tabulation of Known Dielectric Functions.
In addition to measuring the infrared response and extracting the dielectric function of materials, this work aims to collect dielectric function data for various materials in the literature and corresponding references in an online database that could be easily accessible to researchers in the field [11]. In order to tabulate the values of known dielectric functions, MatLab was utilized. In MatLab, the Lorentz, Drude, and TOLO functional forms were input to mathematically calculate the complex dielectric function of various materials. Optical constants, such as the TO and LO phonon frequencies and high-frequency permittivity, which had been reported from published dielectric functions in the literature, were used to generate these dielectric functions. Once generated, a table of values was created and reported on the online database.
RESULTS.
Reflectance Spectra.
The reflection spectra of MoS2, WS2, and HfS2 were measured at various incidence angles and polarization states, with data shown for the 50˚ incidence angle and p-polarization in Figure 1. Reflectance spectra provide key information about the response of a material to incident light, such as the frequency of the Reststrahlen band(s) and therefore TO and LO phonons, among other characteristics. Whilst all three materials are part of the class of the TMD materials, they behave differently in the infrared. As shown in Figure 1, a very distinct, broad Reststrahlen band is present in the ~150 cm-1 to 300 cm-1 range for HfS2. In contrast, the Reststrahlen bands for MoS2 and WS2 are present in the ~350 cm-1 to 400 cm-1 range and are significantly narrower than that of HfS2. Thus, MoS2 and WS2 are not as reflective in their respective Reststrahlen bands when compared to the Reststrahlen band of HfS2 (Figure 1). This also makes MoS2 and WS2 less useful for far infrared applications.
Dielectric Functions of TMDs.
Once the reflectance spectra were fit, it was possible to obtain the dielectric function for each material. As shown in Figures 2a and 2b, the dielectric functions for MoS2 and WS2 are quite similar; the real and imaginary components of the permittivity are centered around slightly different wavenumbers. For instance, the imaginary component (εz) on the c-axis of MoS2 peaks at 470 cm-1, while the imaginary component on the c-axis of WS2 is peaks at 440 cm-1 (Figure 2a and Figure 2b). In contrast, the dielectric function for HfS2 differs from that of MoS2 and WS2. For instance, the imaginary component of the permittivity of HfS2 on the xy-plane (parallel to the crystal surface), Im(ε)xy, is centered around 160 cm-1, and the magnitudes of the components of the permittivity are significantly greater than those of MoS2 and WS2 (Figure 2c).
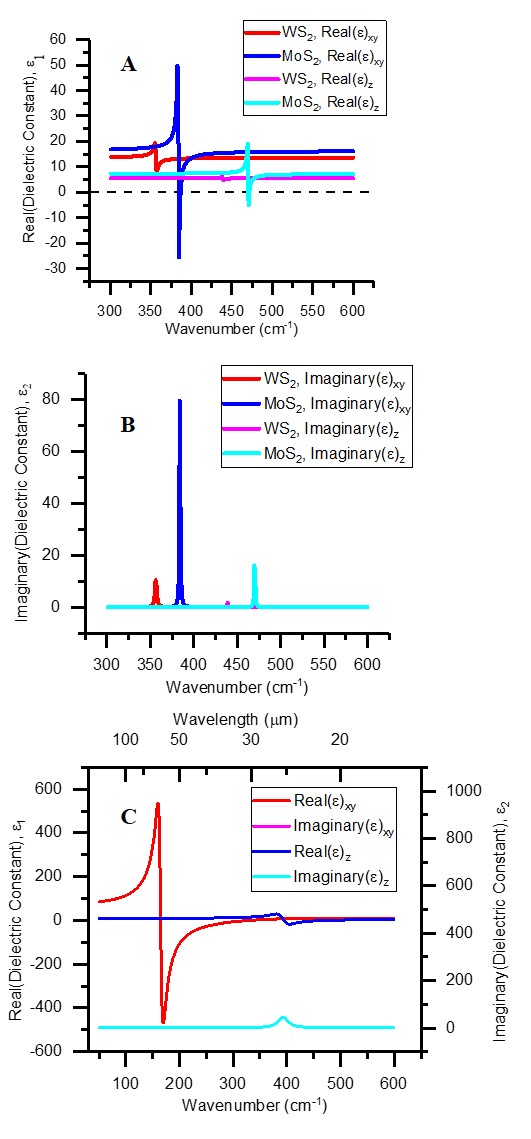
Figure 2. Dielectric functions of transition metal dichalcogenides. A) The real component of the dielectric function of WS2 and MoS2. Each material is labeled as shown. B) The imaginary component of the dielectric function of WS2 and MoS2. Each material is labeled as shown. C) The dielectric function of HfS2. The real and imaginary of the dielectric function are labeled as shown.
Determination of Optical Constants.
Because of its broad Reststrahlen band, HfS2 has extremely interesting properties. The refractive index on the xy-plane and z-axis, nxy and nz, were plotted, along with the change in these two values (Figure 3a and Figure 3b). As shown in Figure 3b, Δn, or the change in the index of refraction, is greater than 1 from 490 cm-1 to 600 cm-1. As a result, HfS2 is birefringent in this region, meaning that light propagates within the material along one direction at a different speed and a different wavelength than it does in other directions.
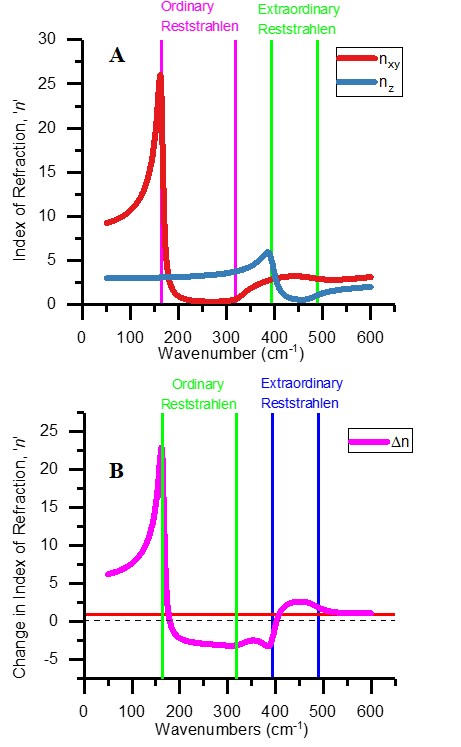
Figure 3. The index of refraction and change in the index of refraction in xy-plane and z- axis for HfS2. A) The index of refraction in the xy-plane and z-axis for HfS2. The Ordinary Reststrahlen refers to the Restrahlen band present in the real component of the dielectric function, while the Extraordinary Reststrahlen refers to the Reststrahlen band present in the imaginary component of the dielectric function. B) The change in the index of refraction for HfS2, represented by Δn. Because Δn is greater than 1 after 490 cm-1, HfS2 is birefringent from 490 cm-1 to 600 cm-1.
DISCUSSION.
The reflection and dielectric constants for each TMD studied provides key information about each material. For instance, an extremely broad Reststrahlen band is present in the reflectance spectrum of HfS2, while MoS2 and WS2 have narrow Reststrahlen bands. HfS2 has a bond length of 0.363 nm, while MoS2 and WS2 have bond lengths of 0.3161 nm and 0.315 nm, respectively [12-13]. As a result, HfS2 has a higher transverse effective charge, which is directly proportional to the Reststrahlen bandwidth [10]. Also as a result, the corresponding dielectric functions for WS2 and MoS2 are very similar (containing two relatively weak phonon vibrations), whilst HfS2 shows an extremely strong phonon vibrations. Within the Reststrahlen band, surface phonon polaritons can exist, enabling the realization of nanophotonics. Thus, a broad Reststrahlen band, such as in HfS2, enables phonon polaritons to exist in a broader spectral region, leading to far more applications than a material with a narrow Reststrahlen band, such as MoS2 and WS2.
The dielectric function for HfS2 is particularly noteworthy because it is different from the dielectric function measured by Lucovsky, et. al [6]. While the real component of the dielectric function is similar, the imaginary component of the dielectric function of HfS2 found in this study is much greater than that of Lucovsky, et. al.
Furthermore, based on the plotted Δn values, it was determined that HfS2 is birefringent from 490 cm-1 to 600 cm-1, which has not been measured in previous studies of HfS2. As a result, the birefringence of HfS2 provides a new approach to advancing technologies in this spectral range, especially for components for polarizing light.
Future Directions.
The extracted dielectric function can be used to determine the refractive index and extinction coefficient of a material at a given frequency, thus enabling individuals to achieve an enhanced understanding of how a certain material behaves in the presence of an electromagnetic field. In addition, the Reststrahlen bands provide key knowledge the frequencies in which polaritons can exist. This information is incredibly useful in determining which materials can be functional in advanced optical devices and new, non-diffraction limited infrared optical applications. In addition, knowing the dielectric function of a material enables the study of infrared nanophotonics.
In future studies, it would be beneficial to extract the dielectric function from a wider range of materials that have not been studied or have not been sufficiently characterized, such as boron carbide. In addition, the continued study of additional TMDs would help determine how slight variations in the structure of a material impact the reflectance spectrum and the dielectric function. Finally, the dielectric function of muscovite mica (H2KAl3(SiO4)3), a much more complex material, is currently being extracted. Muscovite mica is frequently used as a substrate, but its dielectric function has never been generated before. Thus, its infrared optical properties are unclear. Greater knowledge of how light, specifically infrared light, interacts with materials provide researchers the opportunity to create exciting new applications of nanophotonics using 2D materials.
ACKNOWLEDGEMENTS.
The author would like to thank the members of the Vanderbilt Infrared Nanophotonic Materials and Devices Lab and Dr. Jordan Grigor for their continual guidance, support, and help. In addition, the author would like to thank the School for Science and Math at Vanderbilt and Prof. Joshua Caldwell for the opportunity to work in Prof. Caldwell’s lab.
REFERENCES.
- T.G. Folland and J.D. Caldwell: Chapter 12 Semiconductor Nanophotonics Using Surface Polaritons, in Quantum Nano-Photonics, edited by B. Di Bartolo, L. Silvestri, M. Cesaria and J. Collins (Springer Netherlands, Dordrecht, 2018), pp. 235.
- M. Fox, Optical Properties of Solids (Oxford University Press Inc., Oxford, England, 2010).
- R. Geick, C. H. Perry, Normal modes in hexagonal boron nitride, Physical Review 146, 543-547 (1966).
- J. Caldwell, et. al, Sub-diffractional volume-confined polaritons in the natural hyperbolic material hexagonal boron nitride, Nature Communications 5, 5221 (2014).
- A. Giles, et. al, Ultralow-loss polaritons in isotopically pure boron nitride, Nature Materials 17, 134-139 (2017).
- G. Lucovsky, et. al, Infrared-reflectance spectra of layered group-IV and group-VI Transition-Metal Dichalcogenides, Physical Review B 7, 3859-3870 (1973).
- T. J. Wieting, J. L. Verble, Infrared and raman studies of long-wavelength optical phonons in hexagonal MoS2, Physical Review B 3, 4286-4292 (1971).
- R. D. Luttrell, et. al, Dynamics of bulk versus nanoscale WS2: local strain and charging effects, Physical Review B 73, 035410 (2006).
- J. W. Jiang, et. al, Raman and infrared properties and layer dependence of the phonon dispersions in multilayered graphene, Physical Review B 77, 235421 (2008).
- J. D. Caldwell, et. al, Low loss, infrared and terahertz nanophotonics using surface phonon polaritons, Nanophotonics 4, 44-68 (2015).
- “Dielectric Functions,” 2018. [Online]. Available: https://my.vanderbilt.edu/caldwellgroup/dialectric-functions/. [Accessed: 31-May-2018].
- J. Kang, et. al, Mechanical properties of monolayer sulphides: a comparative study between MoS2, HfS2, and TiS3, Physical Chemistry Chemical Physics 17, 27742-27749 (2015).
- W. Zhao, et. al, Evolution of electronic structure in atomically thin sheets of WS2 and WSe2, ACS Nano 7, 791-797 (2013).
Posted by John Lee on Thursday, December 24, 2020 in May 2019.
Tags: 2D materials, dichalcogenides, dielectric function, infrared, nanophotonics