Digitization of Pathology: Determining Catalyst for Degradation of Kidney through Modern Quantification
ABSTRACT
With the rise of digital pathology and analysis within medical fields, the large-scale analysis of tissue samples has been explored, even being tested in conjunction with AI, primarily CNNs (Convolutional Neural Networks). In renal pathology, diseases seem to affect older people at a more severe rate than younger people. In this research, the renal pathology between aged and middle-aged kidneys is analyzed with the use of a WSI (Whole Slide Image) dataset that was thoroughly annotated (In QuPath) for 3 lesions: intimal fibrosis, hyalinosis, and afferent/efferent hyalinosis. In addition, an adapted U-Net Segmentation model (CNN) named “Tiki-Taka Net” was evaluated on the pathological dataset. It was found that the aged WSIs contained a significantly higher occurrence of (p = 0.0035) afferent/efferent hyalinosis, than middle-aged WSIs. It was found that the lesional area was significantly greater (p < = 0.001) in the fibrotic areas versus the hyalinosis areas. Between the control and aged group, the control group had a greater area of hyalinosis (p < = 0.05). Clinical data was used to analyze the differences in renal function, revealing the control group had significantly greater Creatinine Clearance compared to the aged group. Tiki-Taka Net had a mask accuracy of 71% under a dataset of only 84 WSIs. CNNs are observed to be effective at identifying lesions. Ultimately, though aged organs are thought to be drastically more susceptible to disease than younger organs, it’s found in this research that disease concentrations vary a minimal amount outside of afferent/efferent hyalinosis.
INTRODUCTION.
From Physical to Digital Pathology.
The evaluation of tissue at a microscopic level, such as in the kidney, is vital for pathologists in order to diagnose a patient and determine possible causes of the disease. Within the kidney there are various lesions that must be evaluated such as narrowed or widened glomerular vessels [2]. Renal pathologists, who diagnose diseases in the kidney, historically have used methods like light microscopy, electron microscopy, immunofluorescence, and immunohistochemistry to diagnose a patient before sending information over to a team of nephrologists for transplant. Pathology, going back to its origins, always had a physical means to its ends. Though, as technology has progressed, its potential in the field of medicine has been both implemented and hesitantly evaluated.
As of recent, renal pathology has been adapted into a digitized format known as Whole Slide Imaging (WSI). It’s done through a process that turns a biopsy of tissue into 2D slices of tissue pathology. The digitization of pathological slides facilitates a more permanent storage of data pivotal to a patient’s diagnosis and enables a more thorough statistical analysis of diseased areas [1]. With the application more extensively of WSI, this has the potential to accelerate the diagnosis process of pathologists, making screening immediate. The trends identified in such analyses could not only be used to help with the prediction of disease in a singular patient, but also with predictions of clinical outcome in other relevant cases [3].
Rangan and Tesch describe how with the advancement in image analysis technology, the quantification of many things at the microscopic level is possible. They lay the foundation of how to effectively analyze an image and quantify results which can lead to identification of causes of lesional buildup in some pathological images. However, a big limitation to the method of image analysis is the time it consumes, limiting its use in exigent circumstances [3].
Use of AI in Pathology.
To counter this, statistical analysis can be expedited and become more accurate with the utilization of image classification models. U-Net, a convolutional neural network, is specifically a biomedical image segmentation model that can capture a medical image and classify every pixel rebuilding it into the classified image [4]. This model has been a notable example of how AI is able to assess medical images by pixel and reveal pivotal information through a series of neural network layers. However, there still remains uncertainty about whether or not pathologists should rely on AI to identify lesions, being both an ethical question and question based on the accuracy of AI.
Measuring Kidney Degradation.
The catalyst for kidney degradation is up to debate for many researchers. Many suggest that it is due to elderly kidneys being more susceptible to diseases such as diabetes, while others argue it may be due to the structural changes that occur as a kidney ages [5]. With aging there are changes to the arterial intima (innermost layer of blood vessels) that may stop the kidney from transporting substances. efficiently.
In my research, I explore the lesional differences between aged and middle-aged kidneys with the use of WSI in order identify trends that do or don’t appear between these demographics. Specifically, the lesions analyzed were intimal fibrosis in general vessels, hyalinosis in general vessels, and hyalinosis in afferent/efferent vessels. Organs fundamentally become less effective as they age. The kidney is an organ that may experience different concentrations of lesions in different locations, perhaps due to age. With the statistical analysis potential of WSI I identified trends that arise in lesional concentrations between middle aged and elderly kidneys.
Furthermore, I tackle the uncertainty of using AI models for pathology, by evaluating their accuracy and efficiency on identifying intimal fibrosis within a WSI, using a personally developed model based on the credible U-Net model. This may expedite the process by which statistical analysis is done and eliminate human error, resolving AI as an assistive tool to be used by pathologists when determining clinical outcome.
MATERIALS AND METHODS.
Dataset.
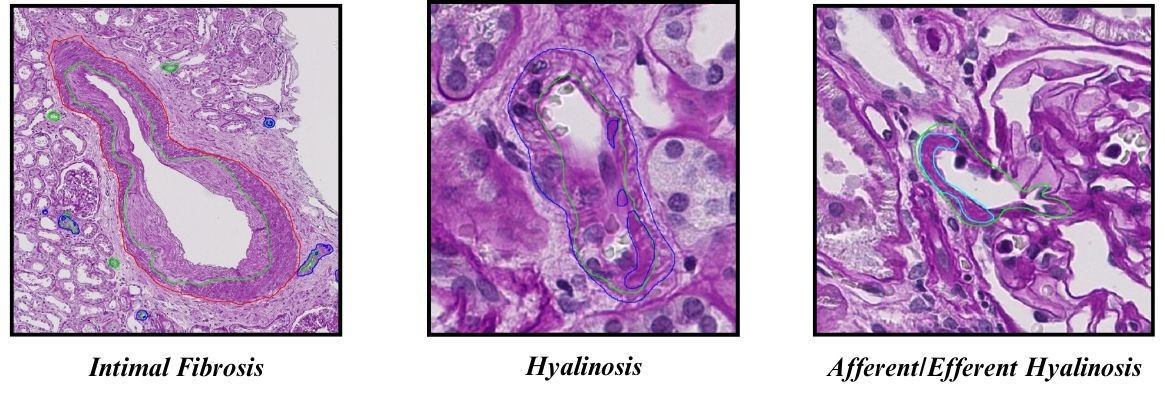
To advance with the statistical analysis, a dataset of 20 WSIs from 20 patients was obtained from the Department of Pathology, Microbiology, and Immunology at Vanderbilt University. 10 of the WSIs were from the aged group having a mean age of M = 71.8. The other 10 WSIs were for the middle-aged group, control group, having a mean age M = 58. The ages of the group were significantly different, using a 2 tailed unpaired T-Test. (p = 0.00001). Each WSI was annotated for 2 vascular components. These components were afferent/efferent arteries found near glomeruli (Fig. 1). Another component was the arteries found throughout the whole kidney. In the afferent/efferent arteries, hyalinosis was annotated automatically adding it to the tally for lesional arteries with the use of QuPath. For the “regular” arteries, they were annotated for hyalinosis and intimal fibrosis (Fig. 1). The data on total normal arteries and lesional arteries for each WSI was compiled into a table.

Statistical Analysis.
3 major columns were added from the initial tallying of fibrotic vessels and vessels with hyalinosis (Fig. S1). First, a column for the percentage of intimal fibrosis among all vessels in the WSI was created. Then a column for the percentage of hyalinosis and afferent/efferent hyalinosis was created. Percentages were calculated through the division of the total vessels by the lesions corresponding to the totals. Two Tailed Unpaired T-Tests were then run to compare between the aged and control group percentages. From QuPath, data was additionally exported on lesional areas by exporting the area sizes of the annotations. Graphs were then produced with the whole dataset through the use of Prism (Data analysis software).
Clinical Data.
A datasheet of relevant clinical data (Fig. S2) on renal function for each patient was provided by the department under which this research is being done. Renal function was measured by Serum Cr. (Level of Creatinine in Blood), BUN (Blood Urea Nitrogen), Cr. Clearance (Measures Rate of Filtering of Creatine in Blood), and Glucose Level (Amount of Glucose in Body). All of these measurements can help to evaluate the condition of the kidney as it filters through creatine, glucose, nitrogen, and other bodily compounds. This dataset was utilized to reveal any significance in the differences between the aged-group and control group’s renal function. The data was split into 7 columns, which detailed the age, gender distribution, Serum Cr., BUN, Cr. Clearance, and Glucose levels of each patient. There was a significant difference in renal function in the Cr. Clearance, indicating the control group had greater functioning in the Cr. Clearance. The age was significantly different.
Tiki-Taka Net.
I adapted an untrained U-Net model architecture (Fig. S3) in PyTorch with major adjustments to the architecture of the model and image size taken. Adjustments include adjusting input and output channels to expedite training speeds while decreasing the image size. There is also an increase in the amount of layers in my AI model to make up for the decreased image size, from 572 pixels squared to 320 pixels squared. With a lack of pixel features for the model to loop through, an increase in the complexity of the model was necessary to produce optimal results on the limited dataset. Training parameters were also heavily modified to increase accuracy of the model within 20 Epochs.
Training Dataset.
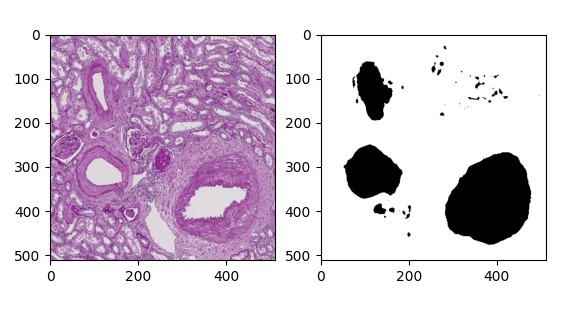
I created a training dataset consisting of 84 images of intimal fibrosis found in the middle-aged group (n = 61) and elderly group (n = 23). Each image was annotated in QuPath to create an ROI (Region of Interest). This ROI was then transformed into a binary, semantic segmentation mask with the use of the QuPath built-in script editor. Semantic segmentation takes an image and assigns a class, in this case being the intimal fibrosis or background, to each pixel. Each pixel is color coded, traditionally with black and white, hence a binary mask (Fig. 2), to segment an image. The dataset was then organized into two separate folders, one labeled “Images”, and another “Masks” under a broader directory named “ObjectDetection”. “Images” were saved as JPEG files while “Masks” were saved as PNG files.

Training Parameters.
The images from the dataset were trained for 100 Epochs (cycles through images). The optimizer used was AdamW, and the loss function (evaluates error in model) was BCEwithoutLogitsLoss. For the 100 Epochs, the batch size (images in each epoch) was 2, with a learning rate (how quick a model defines a trend) of 0.00007. Data augmentation was kept to a minimum, with the removal of horizontal flips in the testing period.
Testing for Accuracy.
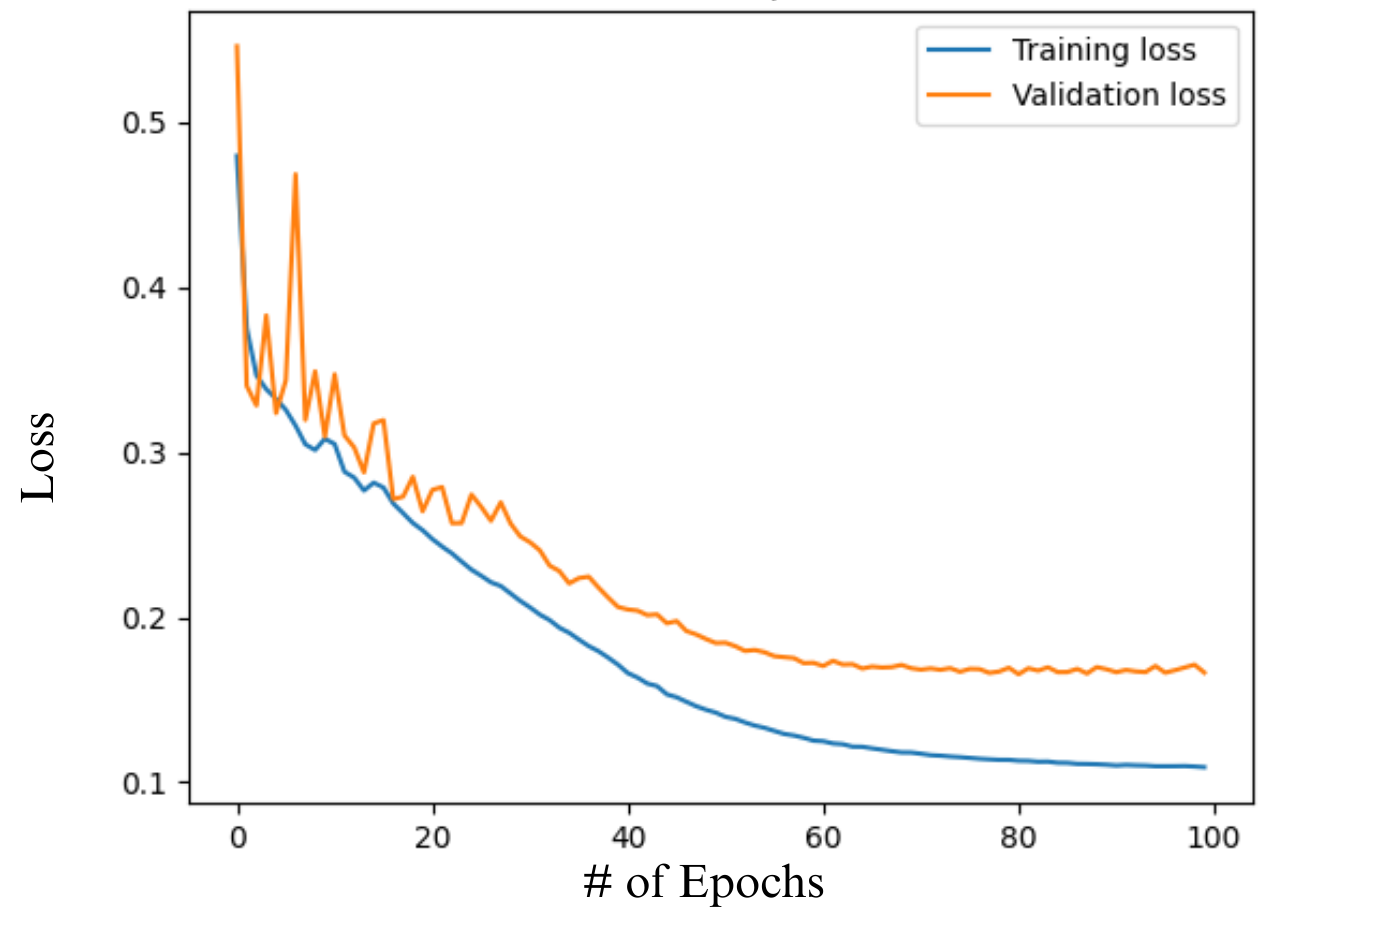
To test the accuracy of this semantic segmentation model on the images of intimal fibrosis, loss per epoch was tracked for both Training and Validation loops. Training pixel accuracy was also tracked for 100 Epochs. Learning parameters were fine-tuned to optimize efficiency of the AI model. All records of accuracy were then graphed initially with matplotlib package (Fig. 3).

RESULTS.
Lesional Percentages.
Between the control and aged group there was extremely minimal variation in the percentage of intimal fibrosis (Fig. S4). The p-values were not significant and visually they average approximately the same percentage.
Moreover, the aged and normal group no significant difference between the hyalinosis percentage is observed in non-afferent/efferent vessels, though the control group does have a greater percentage (Fig. S5). There are multiple outliers in each group for this percentage, minimizing significance.
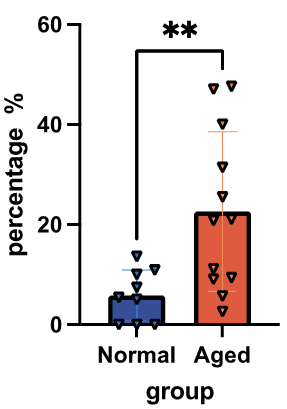
Within afferent/efferent blood vessels, the aged group has significantly (p <= 0.01) greater hyalinosis percentage. There are several outliers in the higher percentages for the aged group to note, suggesting that some kidneys may experience a greater lesional percentage based on a currently unknown factor.
Area of Intimal Fibrosis versus Area of Hyalinosis.
The fibrotic area is consistently significantly greater than the area of hyalinosis in both groups (Fig. S6). Fibrosis usually occurs at a far greater scale than hyalinosis, so this is an expected result. Between the control and aged group, there is a significantly (p <= 0.05) greater area of hyalinosis in the control group. The younger group is more inflicted with hyalinosis in general versus the aged group, unexpectedly.
Accuracy and Loss of Tiki-Taka Net.
Within 20 epochs the accuracy of Tiki-Taka Net had an accuracy of approximately 71%. The training and validation started to plateau at 0.1 and 0.17 loss respectively.
DISCUSSION.
Though renal function does decline in the aged group there is a minimal 7% difference in hyalinosis concentration in non-afferent/efferent blood vessels and no statistically significant difference in intimal fibrosis concentration between the control and aged group. This suggests that there is less drastic change in disease build up as one’s kidney ages, going against many experts’ beliefs. However, there is a significant difference in hyalinosis percentage in afferent/efferent vessels between these two groups. The aged group experiences a significantly greater (p < 0.01) amount of hyalinosis in these specific blood vessels that connect to the glomeruli, having approximately 15% more afferent/efferent hyalinosis (Fig. 4). Though the amount of the disease varies little between these groups, the type of blood vessels getting targeted varies, suggesting that aged kidneys may suffer from lesions in more vulnerable locations. In addition, we see that the control group has a significantly greater area of hyalinosis than the aged group (Fig. S6), yet the renal function is still greater. This further extends the idea that aged kidneys, though having a similar lesion concentration as younger, middle-aged kidneys, are threatened more due to the types of blood vessels targeted. This suggests a priority on the location of lesions rather than quantity, which provides valuable insight to pathologists for more factors that contribute to clinical condition. Pathologists may be able to prioritize targeted arteries during pathological procedures in order to give accelerated diagnoses, bringing pivotal information to a patient’s condition. The implications of these results, however, may need to be supported by a larger dataset to solidify major conclusions.

CONCLUSION.
Conclusion.
The power of statistical analysis here to make inferences about clinical condition, in relation to primary factors such as age, is exemplified by the results in this statistical analysis. WSI, being the core of this analysis, reveals the ability to identify novel trends due to the modernization of pathology. In conjunction with assistive AI technologies, diagnoses on a patient’s health can be expedited with long term training of pathological AI models.
Future Research.
A future direction within this research would be the development of a more extensive instance segmentation-based AI model. An instance segmentation model could not only classify individual pixels but also predict the amount of objects in a given class. If applied to Tiki-Taka Net or U-Net’s capabilities this would allow AI to count how many vessels with intimal fibrosis there are in an image expediting the process of statistical analysis. A more extensive model may contain more classes for vessels in general, and various other lesions like hyalinosis in different areas. A less extensive model may also be able to prioritize certain arteries to identify and analyze, allowing for specific conditions to be diagnosed faster. This may include prioritizing afferent/efferent arteries which have been revealed to have a greater amount of hyalinosis in aged kidneys. In addition, a larger dataset of images above the 84 used in this paper would benefit the accuracy of the model to be sufficient for medical analysis. This would allow for the automation of statistical analysis, previously done in a lengthy time-period, increasing the feasibility of using WSI data in more urgent scenarios. Research in this direction would help to make AI an assistive technology for pathologists to explore trends that may arise that previously could not be determined, statistically, such as the connection between age and lesional location.
SUPPORTING INFORMATION.
Supporting information includes the clinical dataset used to compare the kidney groups, a supporting visual of the U-Net architecture and its layers, the lesional quantification dataset, an accuracy graph per Epoch of the Tiki-Taka Net model, and graphs with insignificant lesional comparisons and lesional area comparisons.
ACKNOWLEDGMENTS.
I’d like to acknowledge the School for Science and Math at Vanderbilt (SSMV) for giving me this opportunity to engage in and create my own research. I’d like to acknowledge my Principal Investigator Dr. Huo for helping me gather information on Machine learning and teaching me about many topics within my research. I’d like to acknowledge my mentors Dr. Yin and Dr. Yang for teaching me how to identify and annotate lesions within the kidney and for checking my annotations to maintain accuracy within the study. I’d like to acknowledge my advisor at the SSMV, Dr. Popp, for helping me during the writing process of my paper to ensure quality. Lastly, thanks to any students in the lab, from high school to college, that helped answer my questions and make time in the lab engaging.
REFERENCES
1 J.P. Houghton, C.P. Wilson, M.J. Dolaghan, Digital pathology imaging offers more benefits than glass slides and microscopes. BMJ: British Medical Journal, 354. (2016)
2 J. Brod, Study Of Renal Function In The Differential Diagnosis Of Kidney Disease. The British Medical Journal, 3(5767), 135–143 (1971)
3 G.K. Rangan, G.H. Tesch, Quantification of renal pathology by image analysis (Methods in Renal Research). Nephrology, 12(6), 553-558 (2007)
4 O. Ronneberger, P. Fischer, T. Brox, U-net: Convolutional networks for biomedical image segmentation. Springer International Publishing, In Medical image computing and computer-assisted intervention–MICCAI 2015: 18th international conference, Munich, Germany, proceedings, part III 18, 234-241 (October 5-9, 2015)
5 A.H. Abdelhafiz, S.H. Brown, A. Bello, M. El Nahas, Chronic kidney disease in older people: physiology, pathology or both?. Nephron Clinical Practice, 116(1), c19-c24. (2010)
6 O. Ronneberger, P. Fischer, T. Brox, U-Net: Convolutional Networks for Biomedical Image Segmentation. ArXiv.org (2015), (available at https://arxiv.org/abs/1505.04597) .
Posted by buchanle on Tuesday, June 24, 2025 in May 2025.
Tags: Artificial Intelligence, Lesion, Renal, Whole Slide Image

