Detection of cyberbullying comments in tweets
ABSTRACT
With the rise of social media platforms and increased interactions, cyberbullying has become very common. There are many negative effects of cyberbullying, which could be partially solved by detection. Using the dataset “Cyberbullying Classification” from Kaggle, we extracted the following features: intensity of tweet, sentiment, parts of speech, and other basic features. We trained and tested a model using these features and analyzed the results. We found that due to the content of the dataset, the model has minor difficulties in differentiating between cyberbullying and non-cyberbullying.
INTRODUCTION.
With the recent events of the pandemic, the Internet is being used more than ever. People of all ages use social media for entertainment and academic purposes, like school or work. With increasing social media interactions, cyberbullying becomes a frequent problem. UNICEF describes cyberbullying as bullying that uses digital technologies like social media with the intent to agitate, hurt or spread rumors about an individual [1]. This constant torment has lasting emotional, physical, and psychological effects on the victim. Cyberbullying victims are at higher risk of developing mental illnesses like depression, skipping school, having frequent physical problems like headaches, and committing suicide [2]. Bullies stay anonymous on the Internet, making it hard to pinpoint the bully in real life. When an account gets blocked or reported, the bully can easily create a new account and continue bullying. Contrary to in-person bullying, cyberbullying has access to the internet 24/7, allowing them to bully anytime and anywhere. A combination of all these factors makes life unbearable for the victims, making cyberbullying an important issue that needs to be addressed.
Cyberbullying is notoriously difficult to detect. Speech is continuously evolving, so a detection approach based on machine learning would need to train a model often while taking into consideration modern slang. Another challenge is that users may use different terminologies depending on which social media platform they are on. Additionally, online posts aren’t only text-based, but can also be other types of content such as images, videos, etc. Moreover, social media is not only limited to English speakers, and therefore cyberbullies could also use other languages to terrorize their victims. Based on these challenges, a machine learning-based model would need to be trained on all types of content and languages, to be effective. More specifically, we would need a Natural Language Processing (NLP) model that can process and identify human language based on the content of the text.
The first step in combatting cyberbullying is to effectively detect it. This is the objective of this paper. In Figure 1, we provide an overview of our machine-learning pipeline. We identify text-features of cyberbullying text posted online in Twitter posts. We extract the following feature groups: 1) sentiment based, 2) extensive use of bad words, and 3) parts of speech. To test the features, we use a publicly available dataset, and trained and tested a machine-learning model. The publicly available dataset includes multiple cyberbullying categories, and therefore our NLP model detects these different text-based cyberbullying behaviors. We work with multiple challenges that our dataset has: 1) The dataset is unbalanced in terms of cyberbullying and non-cyberbullying tweets, with many more cyberbullying example tweets. 2) Most of the cyberbullying tweets contain profanity words, causing an increased number of false positives, where the model flags some tweets as cyberbullying just because they may contain inappropriate words. Finally, we: 1) evaluate our model to understand which features are more important for distinguishing between cyberbullying and non-cyberbullying tweets, 2) train and test the model using only a portion of our features, and 3) plot ROC curves based on different training and testing scenarios. A ROC curve is a curve that plots the false positive rate with the true positive rate. Finally, in our analysis, we find that the bad words feature family is the strongest when predicting the model’s accuracy. Overall, our model performs well with an 80% true positive rate, and a 30% false positive rate.
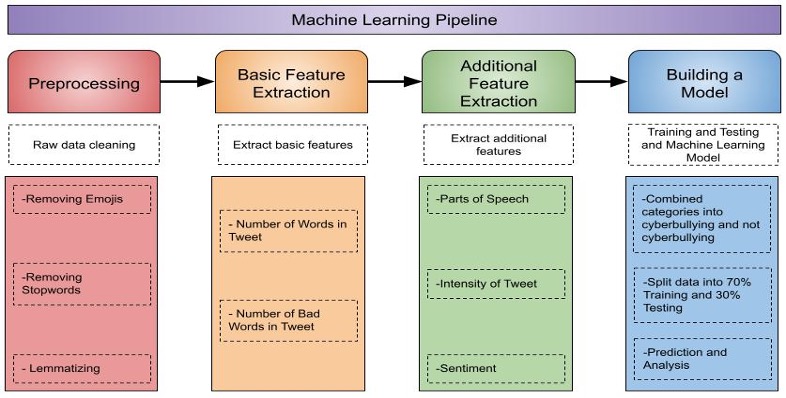
Figure 1. Machine Learning Pipeline. The machine learning pipeline shows the process on how the model was created. First, we preprocessed the data into a form that the model would be able to classify easily. We extracted basic features of the dataset. From this, we calculated the intensity, parts of speech (POS), and found the sentiment score for the tweets. We combined the features based on two categories and inputted them into the model. Last, we evaluate and analyze the model’s results. This process is explained in detail in the ‘Our Approach’ section.
MATERIALS AND METHODS.
Dataset. In the following section, we describe our dataset from the social media platform Twitter.
The dataset is publicly available over Kaggle [3]. Twitter posts are called tweets. These tweets are collected after UNICEF issued a warning that cyberbullying may rise due to Covid-19. There are two columns in the data set: tweets and category. There are six categories of cyberbullying: age, ethnicity, gender, religion, other types of cyberbullying, and non-cyberbullying. The dataset contains more than 47,000 tweets with both non-cyberbullying and cyberbullying tweets, with about 8,000 tweets per category. We converted the categories into numbers for easier representation: Age → 1; Ethnicity→ 2; Gender → 3; Religion→ 4; Other types of cyberbullying→ 5; Not cyberbullying→ 6.
Challenges in the dataset. In this section, we describe a few challenges in the dataset.
Missing information per user. There isn’t information about the users, so we can’t see if there is a particular user who cyberbullies more than other users. We also can’t see if users are following each other, or if these users are targeting a specific user.
Missing information per discussion thread. We don’t know if all of the data collected comes from a single Twitter thread. We don’t have much context behind each tweet, which makes it harder to double-check if the tweet is cyberbullying or not. We don’t know the initial topic of the tweet, so we can’t determine if the entire discussion was made with the purpose of cyberbullying or started off as a harmless tweet but turned into a cyberbullying thread.
Our approach. In this section, we explain our approach on how we preprocess, extract features, and input them into a model to train and test our dataset for cyberbullying detection.
Step 1. We use the packages nltk and emoji to preprocess our data. We use the package emoji to remove emojis from the text and the package nltk to remove stop words. We remove emojis because they aren’t as important as the content of the text during testing and training. We remove stop words because they are words in a sentence that help the sentence flow better rather than adding substantial information. Then, we lemmatize the tweet using the package nltk. Lemmatizing is important because it reduces text redundancy and changes the original word into its base word. For example, the root of ran and running is ‘run’.
Step 2. We use the preprocessed data to collect how many words and how many bad words are in each tweet (using the better profanity package). Both of these features aid in finding the intensity of the tweet (explained in Step 3). The better profanity library uses a dictionary of bad words. When we input our tweets, the package checks if the word is in the package and counts it as a bad word if it is. The dictionary contains modified spellings of bad words which is good because the dictionary covers a wider range of bad words that could be used in a tweet. We find how many bad words are in each tweet to compare categories with their bad words. An Empirical Cumulative Distribution Function (CDF) represents the proportion or count of observations falling below each unique value in a dataset. We input the data into a CDF (Figure 2B) and find out that the ethnicity category has the greatest number of bad words on average. This makes sense because there are numerous slurs for each ethnicity around the world.
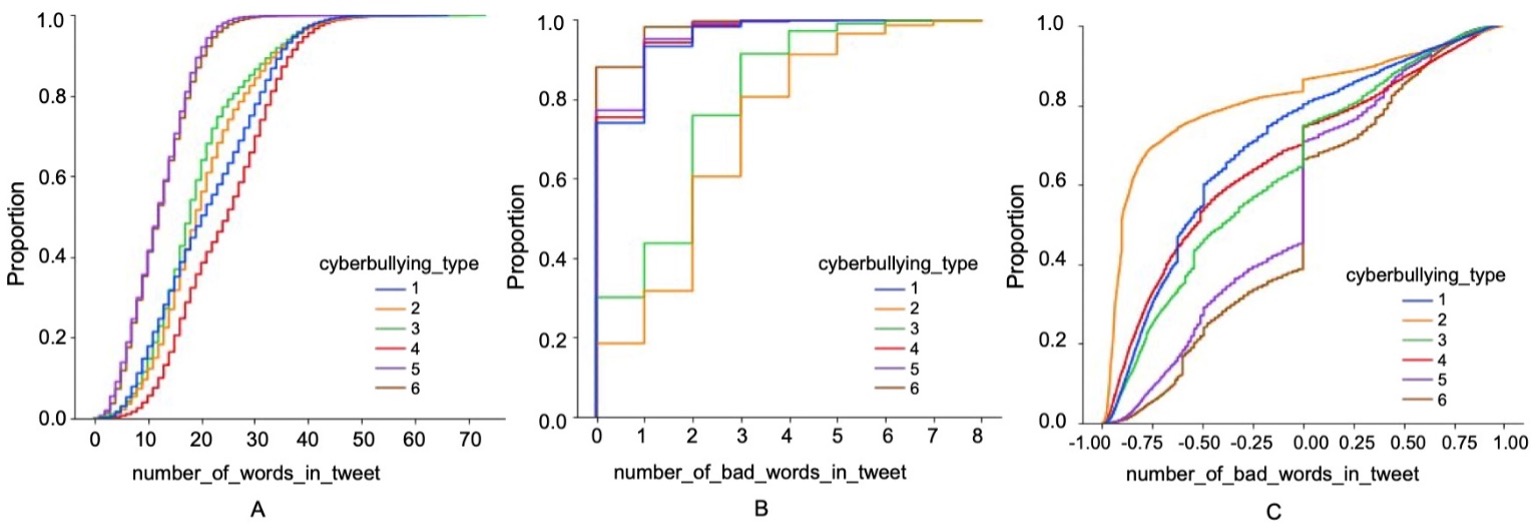
Figure 2. Empirical Cumulative Distribution Function (CDF) Curves. (A) A CDF of the number of words in a tweet per category, (B) A CDF of the number of bad words in a tweet per category, (C) A CDF of sentiment score in a tweet per category. The category other cyberbullying (cyberbullying type 5) had the least number of words on average, while the category religion (cyberbullying type 4) had the most words on average. The category not cyberbullying (cyberbullying type 6) had the least number of bad words, while ethnicity (cyberbullying type 2) had the most bad words on average. The category ethnicity had the most negative sentiment, while the not cyberbullying had the most positive tweets compared to the other categories.
Step 3. We were able to extract additional features from the dataset.
Intensity/Bad words Feature Family: We define intensity as the fraction of the number of bad words in a tweet over the total number of words in the tweet. The higher the percentage value is, the more intense the tweet is. We collect this information to see if there are major differences in profanity across the categories. After reviewing the results, we see that the ethnicity category has the highest intensity percentage, which makes sense because this category also has the most profanity in comparison to the other categories. These are the following features in this feature family: total number of words in tweet, total number of bad words in tweet, and the intensity percentage.
Sentiment Feature Family: We get a sentiment value for each tweet with the help of the package Vader Sentiment. A sentiment value represents the writer’s feelings or emotion behind the text. The results are within the range of -1 to 1; getting a -1 sentiment value means that the entire tweet is negative or has all (or mostly) negative emotion; getting a 1 sentiment value means that the entire tweet was positive or has all (or mostly) positive emotion. Figure 2C shows the sentiment results for each of the categories. Ethnicity has the most negative tweets overall, while the non-cyberbullying category has the most positive tweets overall. Since we know that ethnicity has the most bad words and strongest intensity percentage, it makes perfect sense that this category has the most negative emotions associated with it. If the tweet isn’t cyberbullying, it makes sense that it would not have many negative feelings towards anything, making it either slightly negative, positive or remains neutral like the CDF shows. There is only the vader_sentiment category in this feature family.
Parts of Speech Feature Family: Using the package spacy (a library for NLP), we find the parts of speech (POS) in each tweet. We thought that calculating parts of speech may provide insight into which category used which POS the most. We calculate the following POS: adjectives, adverbs, interjections (a word or phrase used to express a feeling), nouns, pronouns, proper nouns, and verbs. We extract the parts of speech to evaluate if POS can be a good indicator to detect cyberbullying. These are the following features in this feature family: count_of_adjectives, count_of_adverbs, count_of_interjections, count_of_nouns, count_of_pronouns, count_of_proper_nouns, and count_of_verbs.
Step 4. We combined the cyberbullying categories into cyberbullying and non-cyberbullying. We split the newly formed categories into 70% for testing and 30% for training the model. We then re-combined the data into testing and training datasets to train and test our model.
RESULTS.
XGBoost library is highly efficient by implementing machine learning algorithms. It provides scalable and distributed gradient boosting to solve many data science problems in a fast and accurate way. It works on regression, classification, ranking, and user-defined prediction problems. We used a XGBoost Classifier as our model to detect cyberbullying. GridSearchCV is a built-in algorithm in the XGBoost library that finds the best possible combination of parameters over specific parameter values. We create ROC curves to evaluate the performance of the features when inputted into the model. The area under the curve (AUC) is a value that can summarize the model’s accuracy for that graph. The closer to 1 the AUC is, the better the model performs. We create ROC curves based on the grid search (Figure 3), Intensity/Badwords Feature Family (Figure 3), and Parts of Speech Feature Family (Figure 3) to analyze which features the model predicts accurately.
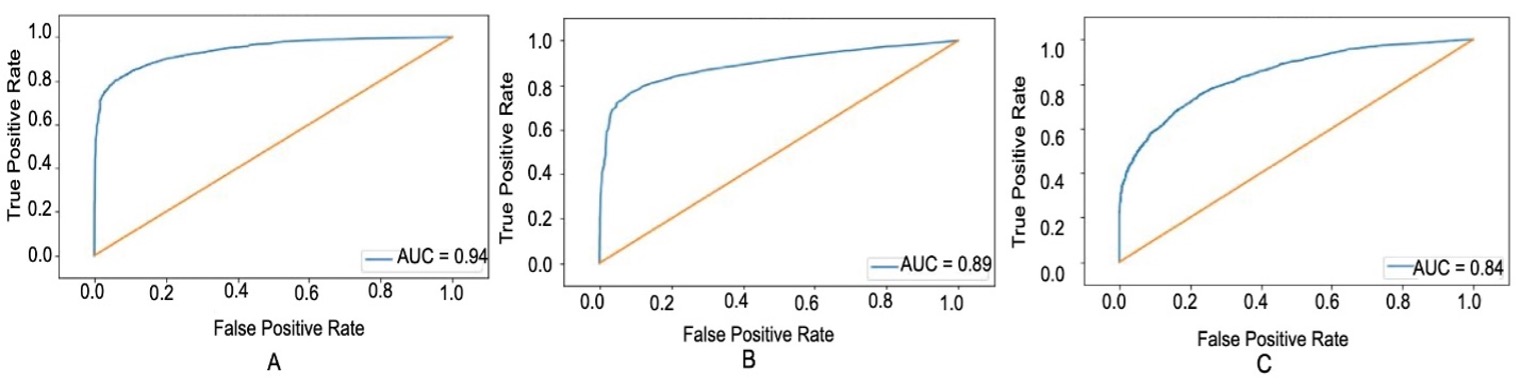
Figure 3. ROC Curves. (A) ROC curved based on GridSearchCV parameters, (B) ROC based on Intensity/bad words feature family, (C) ROC based on POS feature family. The ROC for GridSearchCV parameters had the curve closest to 1, showing that the model predicts cyberbullying tweets most accurately with these parameters. The ROC based on the POS parameters had the graph that was the farthest away from 1 showing that the model can’t accurately predict cyberbullying in a tweet based on this feature family alone.
The grid search ROC (Figure 3) has the best results because its AUC was the closest to 1 compared to the other ROCs. Figure 3A is roughly 75% true positive rate for a 0% of false positive rate. The GridSearch is designed to have the maximum accuracy from the total features so it will have the highest true positive rate when inputted into the model. The intensity/bad words feature ROC (Figure 3) has the highest AUC score out of the feature families. Figure 3B is roughly 70% true positive rate for a 0% of false positive rate. This indicates that intensity is a good feature family to accurately predict the model’s outcome. The POS feature family (Figure 3) has the lowest AUC compared to the other feature families. Figure 3C is roughly 40% true positive rate for a 0% of false positive rate. This indicates that POS is not a good feature family. Then, we use a function that is built into XGBoost library to understand which features are more important. By calling this function, we get the rankings shown in Table 1.
| Table 1. Feature Importance | ||
| Ranking | Feature | F score |
| 1 | Vader_Sentiment | 1206 |
| 2 | Number_of_Words_per_Tweet | 475 |
| 3 | Count_of_Proper_Nouns | 339 |
| 4 | Count_of_Nouns | 334 |
| 5 | Count_of_Verbs | 307 |
| 6 | Count_of_Adjectives | 259 |
| 7 | Intensity_Percentage | 193 |
| 8 | Number_of_Bad_Words_in_Tweet | 79 |
| 9 | Count_of_Interjections | 63 |
| 10 | Count_of_Pronouns | 46 |
Evidenced by the table, sentiment is the most important feature as identified by the XGBoost Classifier. This makes sense because emotion makes the biggest impact on the meaning of the text.
DISCUSSION.
We call the model’s results as TP or true positives, FP or false positives, TN or true negatives, and FN or false negatives. Based on our results, we conclude that the model characterizes a tweet as cyberbullying if there is profanity or other negative words in the tweet. If there isn’t any profanity or negative words, the model considers the tweet as non-cyberbullying. This might be a disadvantage of the dataset. Since most of the cyberbullying tweets in the dataset have profanity, the model was trained that any tweet with profanity is cyberbullying and without profanity, the tweet is non-cyberbullying.
After combing through the results, we find instances of TP, TN, and FP. FN: The tweet “amazon terrible place buy clothing sock” is classified incorrectly as cyberbullying. This result may have occurred due to the word ‘terrible’. ‘Terrible’ might have given a negative sentiment, which the model classifies the tweet under cyberbullying. TP: The tweet “mathewswag bruhh see free anti bullying bracelet” was classified correctly as non-cyberbullying. This result may have occurred is because of the phrase ‘anti bullying’ in the tweet. Bullying has a negative conotation, but due to the word anti in front of it, the model was able to successfully classify this as noncyberbullying. FP: The tweet “one n’t want fight ur staning u black won’t mind” was incorrectly classified as non-cyberbullying, which may be due to the lack of profanity. TN: Due to profanity, we will not provide a example of TN.
CONCLUSION.
In this paper, we create a model that classifies cyberbullying tweets. We use multiple features of a dataset to train and test an XGBoost Classifier model. Based on the results, we conclude that the XGBoost model has trouble classifying cyberbullying with the intensity of bad words, sentiment, and parts of speech alone. With more features, the accuracy might improve yielding better results. If the dataset had more information, we would have been able to extract more features. A large portion of the cyberbullying tweets mainly contained profanity and slurs, which may have disrupted acquiring accurate results. The ideal dataset would contain more information that could be extracted, for example users mentioned, context of each tweet, location of tweet etc. Using additional datasets could help enrich this paper and using a multi feature classifier would allow our results to be of greater accuracy. In doing so, our research could help create a future without cyberbullying.
REFERENCES.
- “Effects of cyberbullying.” https://americanspcc.org/impact-of-cyberbullying/ (accessed Jul. 20, 2022)
- “Cyberbullying: What is it and how to stop it.” https://www.unicef.org/end-violence/how-to-stop-cyberbullying (accessed Jul. 20, 2022)
- Zhao, R., Zhou, A., & Mao, K, Automatic detection of cyberbullying on social networks based on bullying features. International Conference on Distributed Computing and Networking. 43, 1-6 (2016).
- Hani, J., Nashaat, M., Ahmed, M., Emad, Z., Amer, E., & Mohammed, A, Social Media Cyberbullying Detection using Machine Learning. International Journal of Advanced Computer Science and Applications, 10(5). (2019).
- Talpur, B. A., & O’Sullivan, D, Cyberbullying severity detection: A machine learning approach. PLOS ONE, 15(10), e0240924 (2020).

Posted by John Lee on Tuesday, May 30, 2023 in May 2023.
Tags: Cyberbullying, Machine learning, NLP, Vader Sentiment, XGBoost