Crime and Grocery Store Density using Spatial Statistics in ArcGIS
ABSTRACT
Food deserts consist of low-income census tracts in urban areas where residents live more than 1 mile from a grocery store. As a result, low grocery store density is correlated with the presence of food deserts. Furthermore, food insecurity places a strain on local communities. Previous studies have found that food insecurity and crime rates are directly correlated with lower incomes and higher unemployment. As a result, this study sought to examine the relationship between socioeconomic status, crime, and food deserts and more specifically determine where localized pockets of high crime intersect with food deserts and low socioeconomic status. Nashville, Tennessee was chosen for this study due to its rapid population growth and socioeconomic diversity. Spatial statistics in ArcGIS were used to identify the spatial clusters of crime and grocery stores. Then, geographical correlation was used to explore associations between grocery store density and socioeconomic status. A web app was created to visualize these analyses between food deserts, crime, and socioeconomic status. A better understanding of the effects of food insecurity could play a role in preserving lives and infrastructure.
INTRODUCTION.
According to The Tennessean, Nashville, TN has seen a population increase of almost one hundred people per day since 2015 [1]. Because of its rapid population growth, urban planning efforts, which involve meetings between public officials and the private sector on land use, have been outpaced. As an urban area, Nashville has a great range of socioeconomic diversity.
A necessary component of maintaining public health standards in urban areas includes access to fresh produce. However, previous research indicates that urban areas experience an uneven distribution of grocery stores [2]. Socioeconomic status, measured using quantitative variables such as income and unemployment, are correlated negatively with crime. Previous studies found that areas with robust urban planning, which resulted in elevated population densities, drive down crime and unemployment while increasing income [3]. Robust urban planning allows for government services to be evenly distributed, chief among these are food banks and grocery stores.
Low-income census tracts that reside more than 1 mile from a grocery store in urban areas are called food deserts. Food deserts are more likely to occur in poorer areas that have higher rates of crime and lower population densities. Furthermore, an increase in property crimes is correlated with lower land values and local business investment [4]. The prevalence of violent crime, drug offenses, and property crimes are all correlated with lack of access to food and health services [5, 6, 7]. One solution could be to increase access to fresh produce in areas of high crime. Determining areas of overlap between food deserts and crime can help to establish a correlation with socioeconomic status and provide the government with more data to determine which areas of Nashville require more targeted, business-focused, relief. The goal of this project was to visualize correlations between food insecurity and socioeconomic factors. The hypothesis of the current study was that it would follow trends from previous research, which suggest that food insecurity correlates with high rates of crime and other socioeconomic factors [6, 7]. The approach was to use spatial statistics in ArcGIS to map distributions of crime and grocery store density and determine significant correlations with socioeconomic status.
METHODS.
Crime Data Collection.
The study included the area within a 9.5-mile radius of 36.1620° N, 86.7767° W. The area is referred to throughout this paper as Nashville. Data on 376,355 cases of crime were reported by the Metropolitan Nashville Police Department in Davidson County from January 1, 2019 to April 4, 2021. The coordinate system was defined using the Universal Transverse Mercator (UTM). Data were analyzed at the census tract level. Since the census tracts provided were significantly different in size, the centroids of the census tracts were used in calculating crime density.
Statistical and Geographical Analyses.
The extracted crime data contained incident number, latitude, longitude, street, and census tract. A spatial scan statistic implemented in a software program, ArcGIS Pro [8], was used to test for the presence of crime spatial clusters and to identify their approximate locations. Identification of spatial high or low-rate clusters was done using the Getis-Ord Gi statistic, which given a set of weighted features identifies statistically significant hotspots and cold spots. This test utilizes the False Discovery Rate correction (FDR), which reduces the p-value threshold from 0.05 to a value that better reflects the 95 percent confidence interval given the number of replications.
Grocery Store Data Querying and Mapping.
An API is a type of software used to access a data source. To procure data on where grocery stores existed in Nashville, a Google Maps API was used. The Google Maps API accesses data from Google Maps, a mapping and navigation application available on the web. The raw data was called from the API and filtered to include grocery store name, latitude, and longitude.
First, the grocery store data was extracted from the filtered Google Maps API query and inputted into ArcGIS online. The primary difference is that ArcGIS Desktop is hardware based, whereas ArcGIS online is based in the cloud. Using ArcGIS online is more convenient because it allows for wider access to ESRI-compiled data on socioeconomic status.
Grocery Store Heat Map Creation.
A heat map refers to a method of geographically visualizing locations that shows patterns in density. A heat map was created by interpolating discrete points to create a continuous figure, also known as a density surface. When calculating a density surface, three main parameters were analyzed. First, the cell size of the map determines the degree of precision of how the map is featured. A smaller cell size results in a smoother map. Cell size was set at 70 cells per density unit. Secondly, the search radius determines the area around each grocery store that ArcGIS factors into its density calculation. The search radius was set to 1 mile, as per the definition of a food desert. Finally, the number of grocery stores within each mile was calculated using Inverse Distance Weighting (IDW), where more weight is assigned to grocery stores closer to the centroid of a census tract than those that are farther. Once the grocery store heat map was created, it was overlaid with feature layers imported and filtered from ArcGIS online. These feature layers include crime, income, and unemployment.
RESULTS.
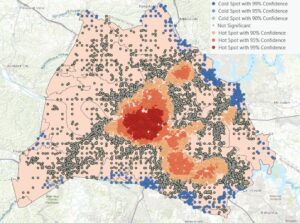
The distribution of spatial high-rate and low-rate clusters of crime and the high-rate and low-rate outlier clusters are presented in Figure 1. Visual examination of Figure 1 reveals the presence of crime clusters in areas surrounding downtown Nashville. Formal cluster analysis using the Getis-Ord statistic revealed statistically significant hot-spots in downtown and East Nashville. The largest cluster, with 99 % confidence, was in the area surrounding downtown Nashville. The second largest cluster included parts of East and North Nashville with 95 % confidence. Four clusters with significantly low rates of crime were also identified. The clusters of low crime rates were spread across the Southeast, Green-Hills Midtown, Madison, and Donelson-Hermitage areas with ninety-nine percent confidence.
Figure 1. Identification of spatial high rate and low -rate clusters of violent crime. Red and orange areas indicate clusters of high-rate crime. Dark blue areas indicate clusters of low rates of crime.
With significant clusters of high and low crime rates found in the preliminary analysis, it was necessary to further explore correlation with other variables throughout Nashville.
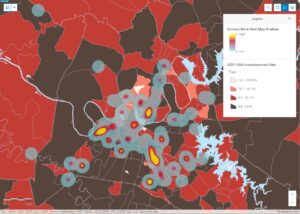
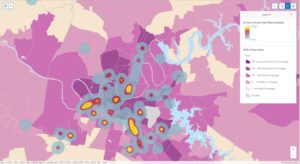
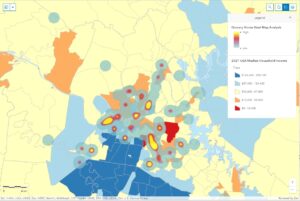
A web app was successfully created with the ability to map relationships between the crime clusters, grocery store density, and socioeconomic status. Three maps, overlaid with a grocery store heat map, were used. Figure 2 displays the unemployment rate by census tract. Figure 3 displays the USA Crime Index by census tract, which is a comparison of Nashville’s crime rate to the national average. Figure 4 displays the median household income by census tract.
Figure 2. Grocery store Heat Map overlaid with 2021 USA unemployment rate. Dark red regions indicate census tracts with an unemployment rate between 0.0 % and 3.5 %. Light red regions indicate census tracts with an unemployment rate between 3.5 % and 10.1%. Orange regions indicate census tracts with an unemployment rate between 10.1 % and 16.7 %. Yellow regions indicate census tracts with an unemployment rate between 16.6 % and 100.0 %.
Figure 3. Grocery store Heat Map overlaid with USA Crime Index. Light Purple areas indicate a US Crime Index between 1 and 50. Darkest Purple areas indicate a US Crime Index above 401.
Figure 4. Grocery store Heat Map overlaid with 2021 USA median household Income. Red Regions indicate census tracts with income between $0 and $13,400. Orange regions indicate census tracts with income between $13,400 and $50,400. Yellow regions indicate census tracts with income between $50,400 and $87,400. Light blue regions indicate census tracts with income between $87,400 and $124,400. Dark blue regions indicate census tracts with income between $124,400 and $200,100.
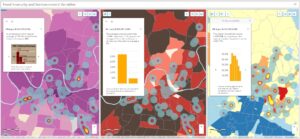
The web app was successfully built with the ability to examine the processed data (Figure 5). Three maps were used in the creation of this web app. Each map is interactive and allows the user to hover over a point and display the TN census tract and a bar graph that compares Nashville data to the national average. Users have the ability to zoom in and out of the graph to focus on specific census tracts.
Figure 5. Interactive web app that compiles three grocery store heat maps. Users can hover on census tracts to display data on crime, unemployment, and income compared to the national average.
DISCUSSION.
To examine the link between food insecurity and crime, maps were created in ArcGIS. These results suggest that there are hotspots of food insecurity throughout the Nashville metropolitan area. The distribution of clusters of low concentrations of grocery stores in North, East, and South Nashville coincided with socioeconomic variables, namely higher crime and lower income. Figure 2 shows a negative correlation between grocery store density and unemployment rate. Food insecurity was accompanied by rising crime rates within each census tract. Upon visual analysis, there is a significant negative correlation between crime and grocery store density (Figure 3). Examination of Figure 4 shows a significant positive correlation between grocery store density and 2021 median household income. Taken together, these hotspots of food deserts and crime show a possible relationship with population density. Nashville has experienced a significant increase in population, coupled with an increase in crime [9]. A better understanding of the effects of increased crime on low-income areas lacking access to fresh produce could play a role in preserving lives and infrastructure. Because the results of the Getis-Ord statistic reject the null-hypothesis with significant clusters, they emphasize the potential for crime to continue increasing already existing food insecurity in Nashville (Figure 1).
Previous studies in the city of Calgary, found that food deserts were located primarily at the fringe of cities, in low-income neighborhoods with limited access to healthcare and large populations of senior citizens [10]. This study suggests that the distribution of crime within urban areas is correlated with more than just socioeconomic status, but also access to necessities such as fresh produce. As part of this study a web app was developed to model trends in crime, food insecurity, and socioeconomic status. This web app could provide Nashville residents with equitable access to information regarding rising crime and food insecurity to ensure that all Nashvillians have equitable access to fresh produce. The visualization of the data may make certain trends relative to significant changes in crime and food insecurity more apparent. These maps can be used by other researchers to learn and make decisions about fighting food insecurity and its impacts on the city of Nashville. Future studies could help determine if this web app is effective in helping cities like Nashville make decisions about addressing food insecurity that may lead to increased crime.
To better interpret correlations between crime, grocery store density, and socioeconomic status, more factors could be measured, such as comparing crime distributions with other metrics of socioeconomic status, including disability status and education level. The Google Maps API was used but had some scaling issues in identifying the grocery stores. Some grocery stores were not able to be queried through the API due to scaling issues; thus, this data is not available for usage.
Spatial statistics were instrumental in identifying relationships between crime, grocery stores, and socioeconomic status. The geographical correlation between grocery store density and socioeconomic status showed crime as a correlated variable. This web app was created to visualize the analyses between food deserts, crime, and socioeconomic status. A better understanding of the effects of crime could play a role in ensuring that all Nashvillians have equitable access to fresh produce.
ACKNOWLEDGMENTS.
I would like to thank Dr. Angela Eeds and Dr. Stacy Curry-Johnson from Vanderbilt University for giving me the tools to learn about GIS and supporting my efforts in scientific communication.
SUPPORTING INFORMATION.
Web App Available At: https://www.arcgis.com/apps/dashboards/6d34ce7f32114febaea1875ef7b4ded1
REFERENCES
- Garrison, “New data: Nashville Region still growing by 100 people a day,” The Tennessean, (2017).
- Christens, P. W. Speer, Predicting Violent Crime Using Urban and Suburban Densities. Behavior and Social Issues, 14, no, 113–128, (2005 )
- Barone, G. Narciso, Organized crime and business subsidies: Where does the money go?, Journal of Urban Economics, 86, 98–110, (2015).
- Hendrickson, C. Smith,N. Eikenberry, Fruit and vegetable access in four low-income food deserts communities in Minnesota, Agriculture and Human Values, 23, 3, pp. 371–383, 2006.
- R. Dong, A. Must, A. M. Tang, T. J. Stopka, C. G. Beckwith, Food Insecurity, Morbidities, and Substance Use in Adults on Probation in Rhode Island, Journal of Urban Health: Bulletin of the New York Academy of Medicine, 95, 4, 564–575, (2018).
- B. Jackson, J. Newsome, M. G. Vaughn, K. R. Johnson, Considering the role of food insecurity in low self-control and early delinquency, Journal of Criminal Justice, 56, 127–139, (2018).
- Larson, A. Haushalter, T. Buck, D. Campbell, T. Henderson, Development of a Community-Sensitive Strategy to Increase Availability of Fresh Fruits and Vegetables in Nashville’s Urban Food Deserts, 2010–2012, Preventing Chronic Disease, 10, 2013.
- Esri 2021. ArcGIS Desktop and Online Applications. Redlands, CA: Environmental Systems Research Institute.
- S. Census Bureau quickfacts: United States.
- Lu and F. Qiu, Do food deserts exist in Calgary, Canada?, The Canadian Geographer / Le Géographe canadien, 59, 3, 267–282, (2015).
Posted by John Lee on Saturday, May 7, 2022 in May 2022.
Tags: Crime, Food Deserts, Geographic Information Systems, Income, Unemployment

