Concrete Printing System Construction and Characterization of 3-D Printed Cement-based Materials
ABSTRACT
Additive manufacturing processes have gained popularity in the last decade. One of these processes, 3-D printing, allows for virtually unlimited freedom of design, shorter manufacturing time, and increased personal customizability. In this study, an extrusion system for the 3-D printing of cement-based materials was designed and constructed. After construction, the conditions of the printing system were optimized using a simple cement mix composed of cement powder and water. Superplasticizer and other additives, including dry densified silica fume, colloidal silica, and blast furnace slag were then introduced to control the viscosity of the cement mix, which was quantified in terms of shear strength as measured by a shear vane test. Results showed that a mix with a water to cement (w/c) ratio of 0.28 to 0.30 was optimal in the printing setup designed. A shear strength of 9 – 12 kPa was also identified as optimal, and could be achieved through introduction of additives: 5% dry densified silica fume or 10% colloidal silica. After printing, a cross-sectional sample and fracture surface were examined using scanning electron microscopy to characterize the interfilament region.
INTRODUCTION.
In recent years, due to an increased interest in sustainable design and customization, interest in innovative manufacturing has grown significantly. Additive manufacturing techniques (extrusion, jetting, and powder bed fusion), which form objects by depositing successive layers of materials (1, 2), use advanced technology (computer-controlled deposition, CAD software, etc.) to optimize already existing manufacturing processes, making them more efficient and less costly. These techniques are already being used in many fields, from biomedical to automotive and aerospace/defense to energy (3). There are many advantages to additive manufacturing over conventional fabrication processes: elimination of the need for tooling, virtually unlimited freedom of design, shorter manufacturing time, and increased personal customizability at no extra cost to the manufacturer (2, 4).
The specific additive manufacturing process that will be examined in this research is concrete printing (5), which uses a 3-D printing head on a mobile triaxial setup to extrude concrete material (6, 7). Printed concrete has been shown to have no loss of strength (8) and exhibits many of the optimal properties of fresh concrete (9), while being a more efficient process than conventional mold-casting. Currently, 3-D printing of high-performance concrete is still wrought with difficulties, especially in the design of mix parameters that are appropriate to the extrusion system that is used. Parameters for the extrusion system are usually tested and set prior to mix development (7, 9), which makes it difficult for mix development to be standardized industry-wide. Mixes must have characteristics that balance fluidity and solidity and maintain a high viscosity while remaining extrudable (6, 10). To regulate extrusion, additives such as retarders, accelerators, and viscosity modifiers must be used (11–13).
To regulate extrusion, these additives must be used: those chosen in this study all change hardened strength as well as regulate the viscosity of the mix. Addition of silica fume and ground granulated blast furnace slag (GGBFS) both will increase viscosity; however, as both interact differently with cement particles, the increase in viscosity with the addition of GGBFS should not be as large as that with a similar quantity of silica fume (11, 12). Although the same particle as silica fume, colloidal silica is in solution, which will decrease its viscosity-increasing effect (13).
The present work analyzes various properties of fresh Portland cement pastes, focusing on qualities that impact a paste’s ability to be extruded in a 3-D printing setup (9). In order to extrude filaments, an automated extrusion device was constructed, which regulates extrusion rate, build plate speed, and other printer conditions. An optimal cement mix for this printing setup was designed, using additives such as silica fume, colloidal silica, and ground blast furnace slag . Samples were images in an SEM to characterize the area between filaments.
MATERIALS AND METHODS.
Mix Design.
Type I/II Ordinary Portland Cement (OPC) (Lafarge, Nashville, Tennessee) was used as the cementitious material, and a polycarboxylate-based high-range water reducer (superplasticizer), Glenium 7700 (BASF, Ludwigshafen, Germany) was used to reduce the water-cement (w/c) ratio and increase fluidity of the liquid cement paste (14). Five mixes were developed with varying w/c ratios (by mass) from 0.2 to 0.4 in increments of 0.05 and tested via manual extrusion. Once a suitable w/c ratio was identified, additional tests were conducted from -0.04 to +0.04 of that ratio in increments of 0.02. In the event that any sample could not be properly extruded, a dose of superplasticizer was added in increments of 0.5% by weight of binder. The mix with the lowest w/c ratio that exhibited flow properties and no blockages or segregation in the syringe was considered optimal for extrusion.
Additives including dry densified silica fume, colloidal silica (40%), and GGBFS were added to the cement powder in order to determine the most effective mix design for extrusion. During all additive testing, the w/c ratio was constant at 0.30. Percentages of silica fume and colloidal silica were varied from 2.5%-20% (2.5%, 5%, 10%, 20%), while percentages of GGBFS varied from 0% to 45%(0%, 15%, 30%, 45%). Mixes were tested both with and without superplasticizer, which was added at 0.5% by weight of binder. The workability of mixes was assessed through shear vane testing (ASTM D2573 / D2573M – 15) (15) and results were analyzed using GraphPad Prism 7 (a statistical analysis and graphing software, GraphPad, La Jolla, California, USA).
Extrusion Setups.
A syringe setup consisting of a 50 mL syringe with a nozzle approximately 2mm in diameter was constructed for manual extrusion tests, which facilitated initial mix testing due to the simplicity of the testing method. Although pressure could not be regulated and controlled, movement speed and extrusion rate could be kept roughly constant. In all manual extrusion tests, filaments were extruded from a 50mL syringe in three equal 300mm segments, for a total length of 900mm.
To construct the printer, a MakerBot Cupcake CNC 3-D Printer was deconstructed and parts of interest were salvaged for use in the construction process. An X-Y motor setup was constructed using toothed belts as well as 1.8° 14V bipolar stepper motors salvaged from the MakerBot CNC and controlled using an Arduino Duemilanove microcontroller connected to a variable 12V power supply. The motors were used to control a build plate, which moved in the X and Y directions at speeds dictated by the rotation speed of the motors.
An extrusion setup was constructed to push cement paste out of a syringe at a constant rate: syringes were inserted into a tube to keep them in a fixed position and the tube was bolted down to a 24” segment of 6105-T5 aluminum alloy 80/20 T-threaded bar (Figure 1). A Meritor LVS DC motor powered by a 24V-40A variable power supply was connected to the threaded rod, which rotated through the 1” segment of the 80/20 T-threaded bar, causing the rod to move translationally at a constant rate directly proportional to the motor’s speed. The rod directly abutted the end of the syringe, which also moved translationally, depressing the plunger and extruding the cement paste inside the syringe.
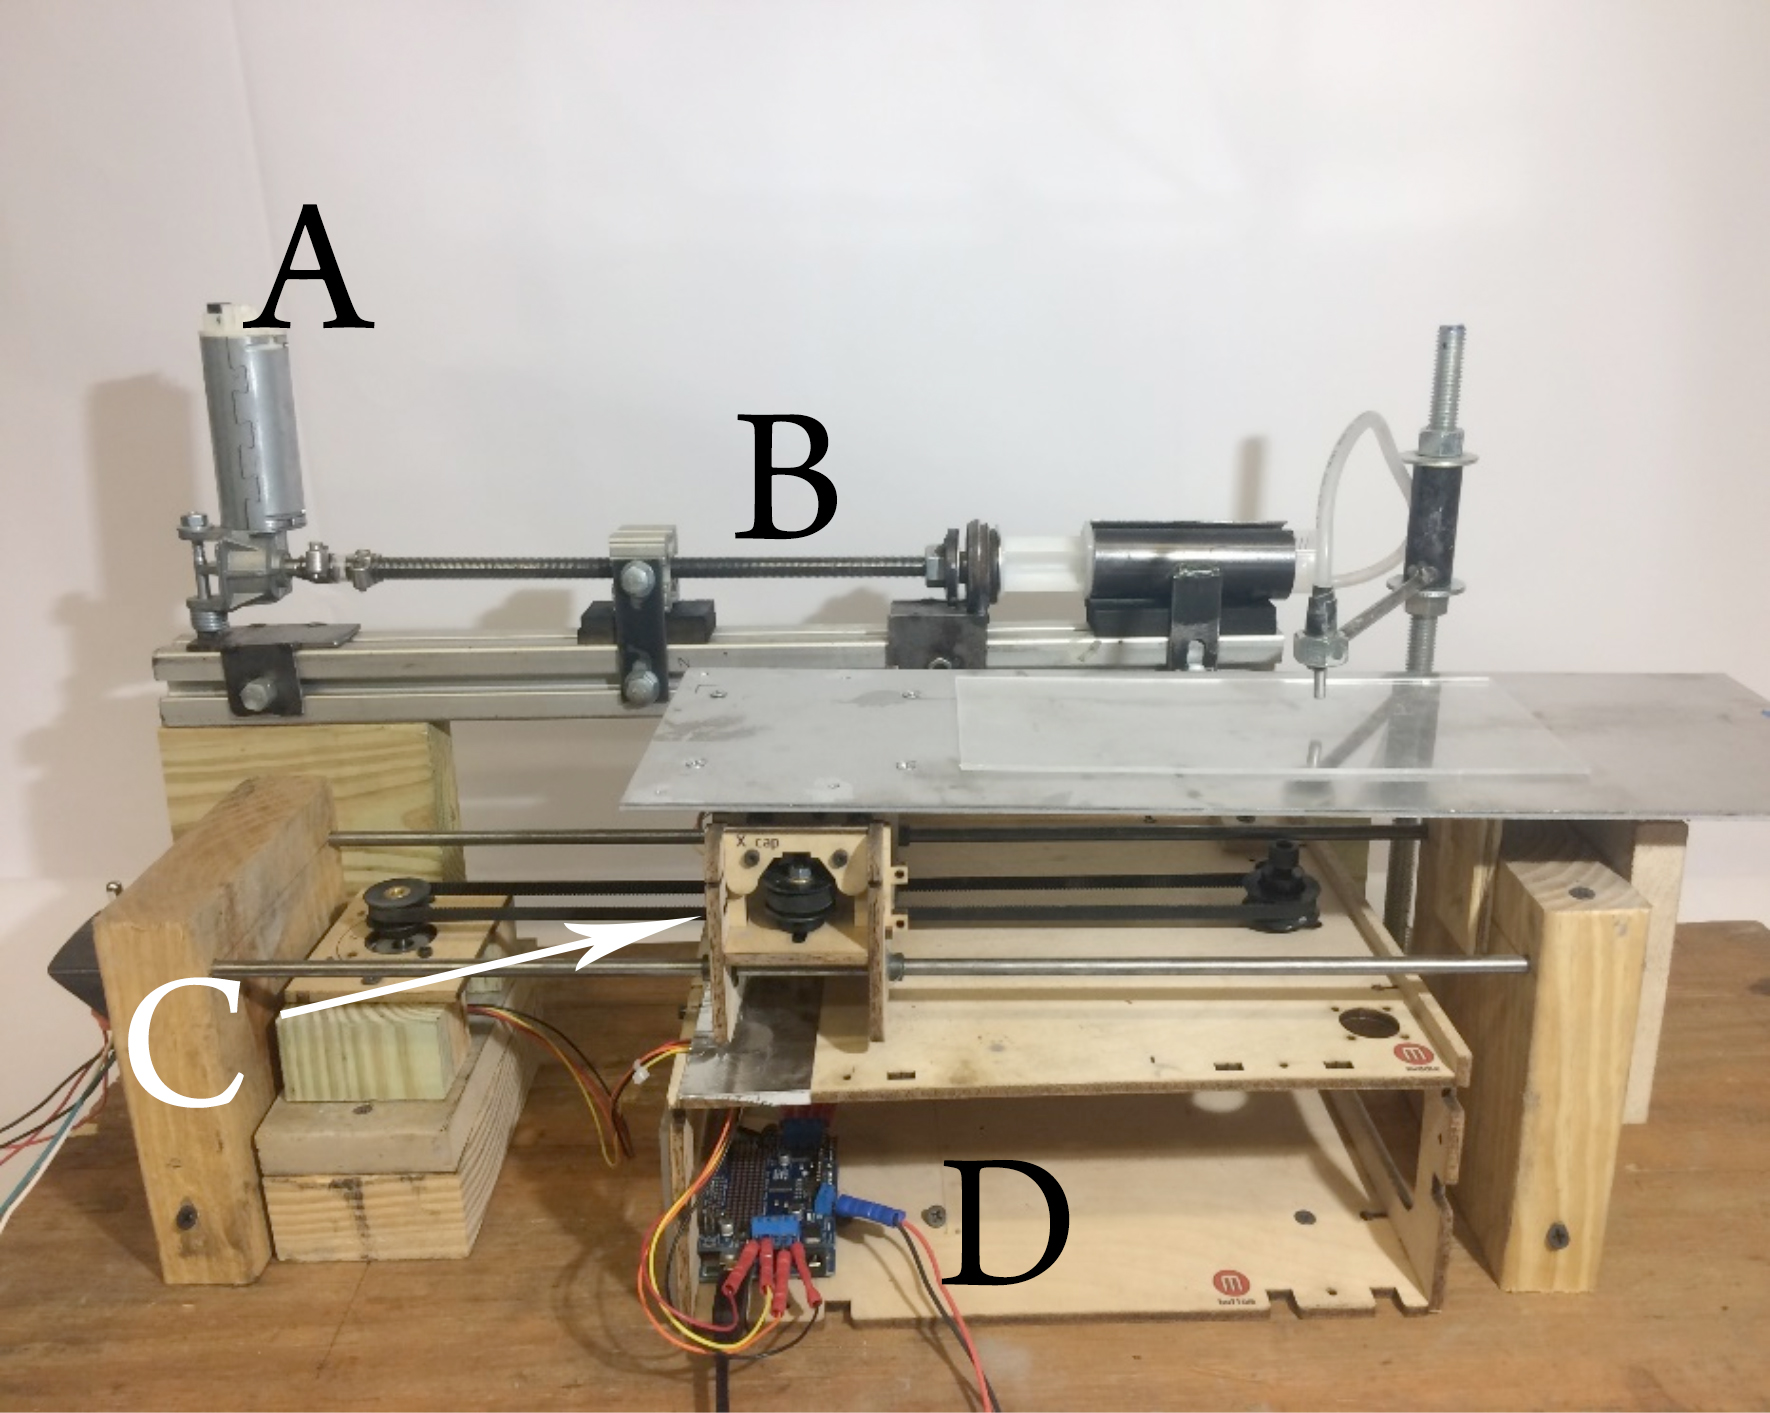
Figure 1. Final printer design. The motor (A) and extrusion setup (B) are seen in the background, while the X and Y-axis motor systems (C) are seen in the foreground, as well as the Arduino microcontroller (D), which drives the motor systems.
Extrusion Conditions.
Following the completion of the construction process, the printer was calibrated to optimal extrusion conditions using the mix design identified as optimal during initial mix testing using manual extrusion. The relationship between motor RPM and build plate speed was analyzed using a GraphPad 7 quadratic regression, which fits the data to a quadratic equation. The relationship between input voltage and extrusion rate was analyzed using a linear regression.
Sample Imaging.
Following the printing of optimal samples, they were cured approximately 120 days. To more accurately simulate real-world curing conditions, samples were sprayed with water periodically for the first 14 days, then left to cure without disturbance until the 120-day period had elapsed. After curing, samples were prepared for imaging. Samples were imaged in an environmental FEI Quanta FEG 650 high resolution scanning electron microscope (ESEM) equipped with a gaseous analytical detector (GAD) and gaseous secondary electron detector (GSED). Images were taken, both in montage and high-resolution, of areas of interest on the fracture surface (F) and the cut cross-section (C). Images were taken at varying magnifications ranging from 46x to 1,234x so that areas of interest could be studied more closely. An accelerating voltage of 10 kV and a spot size of 3.5 were used for digital imaging. A pressure of 130Pa was maintained throughout imaging.
RESULTS AND DISCUSSION.
Mix Design.
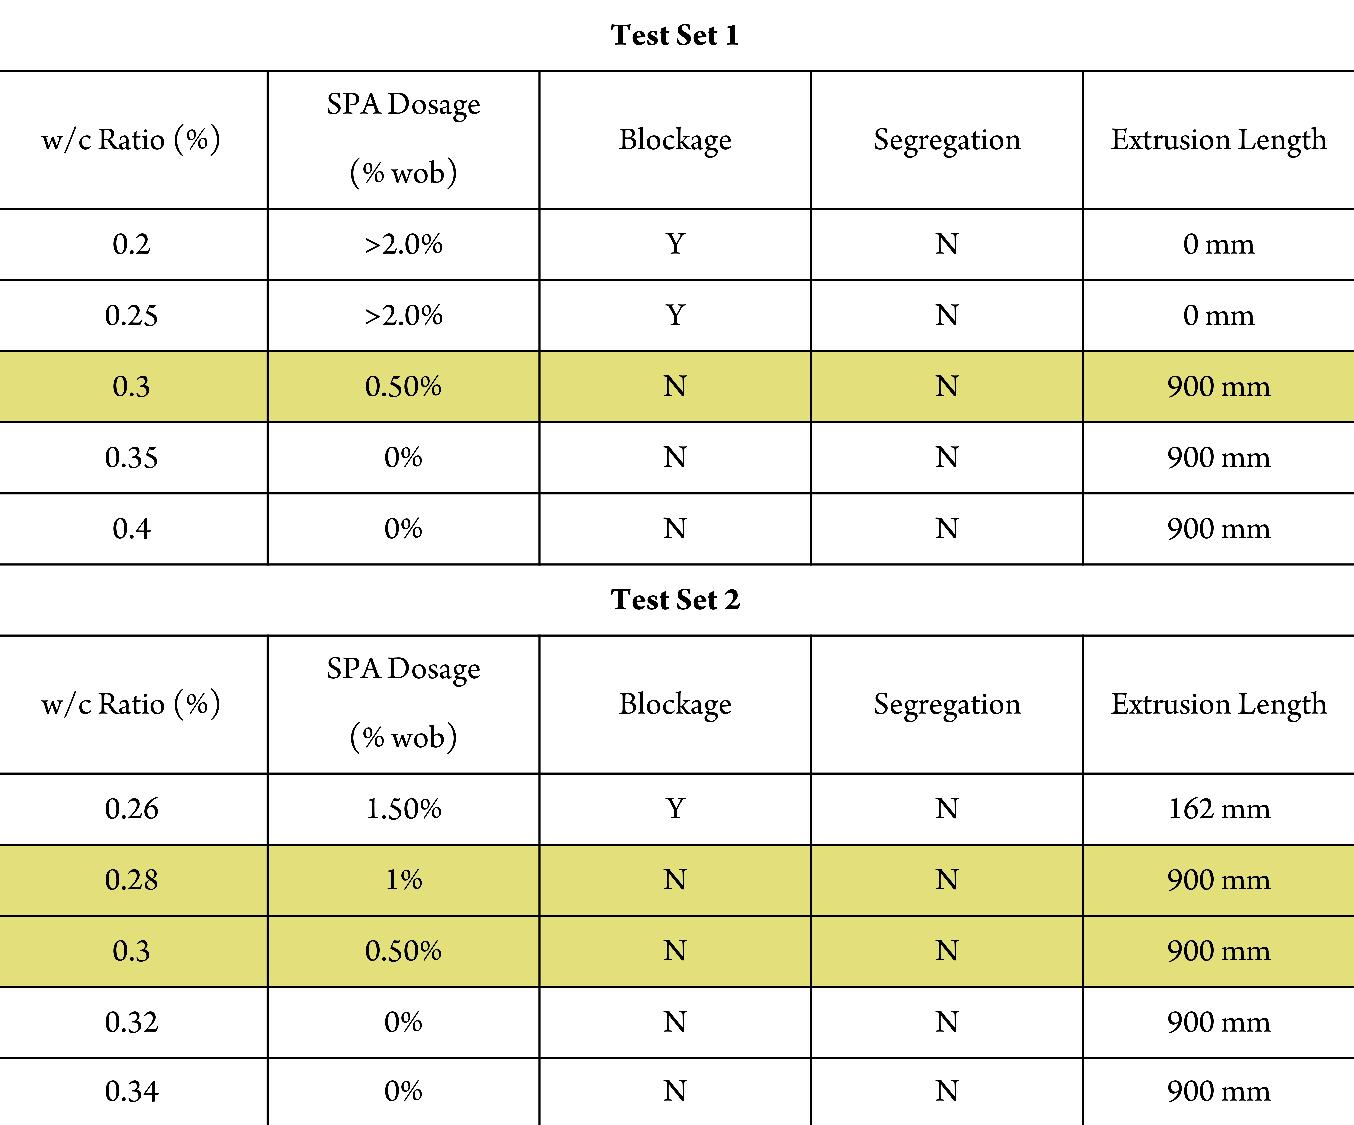
The optimal water/cement ratio range was assessed through manual extrusion tests (Table 1). “Optimal” was defined as the lowest possible w/c ratio that still maintained steady extrusion without blockages or segregation in the syringe or tube. Samples that extruded less than 900mm were automatically disqualified from the optimal range. It was found that below a w/c ratio of 0.28, cement mixes were not fluid enough to be extruded without large amounts of superplasticizer, while above a w/c ratio of 0.40, cement pastes were so flowable that their extrusion could not be properly regulated. In the optimal range, pastes were fluid enough to be properly extruded, yet not so fluid that they would escape the syringe unaided. This combination proved perfect for the printing system designed.
Table 1. Testing parameters for determining the optimal w/c ratio range. Optimal w-c ratio values are shown in the highlighted rows. Superplasticizer (SPA) dosage is measured by proportion to the weight of binder, cement powder.
Optimal Extrusion Conditions.
In order for the printing setup to function efficiently and print thin filaments, it must be calibrated to the correct settings that dictate the extrusion speed as well as the speed at which the build plate moves, both of which impact the filament size. The ranges of voltage and motor RPM tested corresponded to the voltage and motor RPM of the variable power supply and motor that were used in the study. Identified as optimal for this printing setup was a motor RPM of 120, corresponding to a build plate speed of 1711 mm/min, and a voltage of 5V, corresponding to an extrusion rate of 0.30 mL/sec. This voltage was identified as optimal because when coupled with the build plate speed of 1711 mm/min, it extruded the thinnest filaments (approximately 2mm in diameter) that remained consistent with no separation or blockages in the tube or syringe.
Influence of Additives on Shear Strength.
The optimal range in shear strength (9-12 kPa) was identified through the testing of optimal extrusion parameters. It was found that a mix with w/c ratio of 0.30 and no additives was able to be consistently successfully extruded. That mix demonstrated a shear strength of 10.6 ± 1.5 kPa.
Optimal dosages of each additive, along with superplasticizer, were identified. Dry densified silica fume led to the greatest increases in shear strength, while the addition of GGBFS did not change the shear strength significantly from the original levels. The addition of colloidal silica also increased the shear strength, but not as much as the addition of dry silica fume, most likely because colloidal silica is water-based.
Characterization and Imaging.
After printing, both a fracture surface and cross-sectional sample were imaged using the ESEM. Both imaged samples had a w/c ratio of 0.30 with no additional additives to control shear strength. When tested, the mix used to print both samples had a shear strength of 10.7 ± 0.25 kPa. Both backscatter (GAD) and secondary electron (GSED) images were taken of both samples. In the fracture surface (Figure 2), the interface between filaments is clearly visible, as shown in Figure 2A. This filament interface is also demarcated by the white line in Figures 2B and 2C. This obvious frontier demonstrates that the circular shape of each filament is conserved in the curing process.
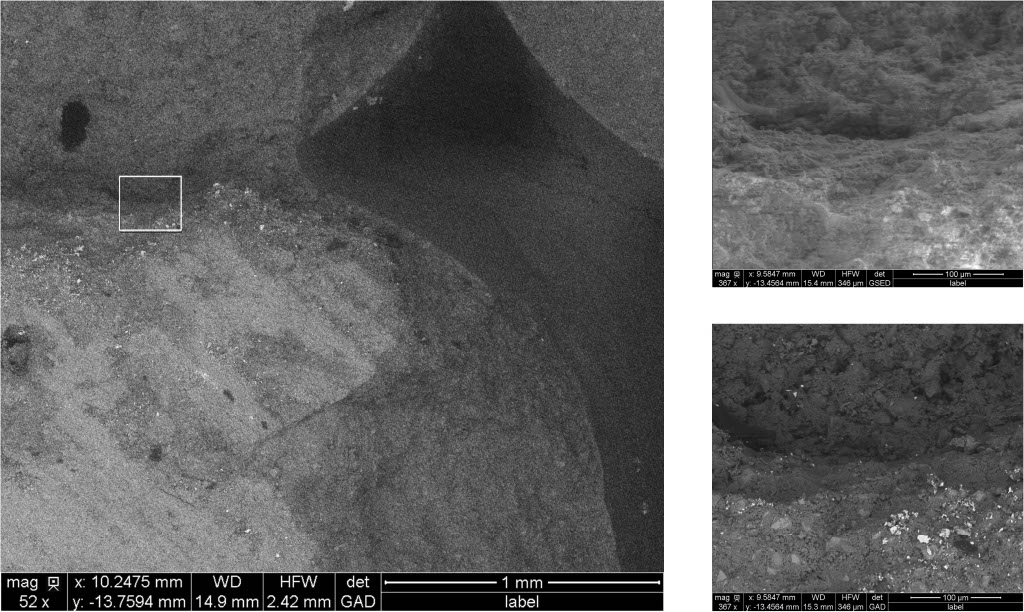
Figure 2. Scanning electron microscope image of the interface between 3 filaments in the fracture surface at 52x (A) and 367x (B and C). The boxed area in Figure 2A is magnified to create Figures 2B and 2C. Figures 2A and 2B are backscatter images, while Figure 2C is a secondary electron image.
In the cross-sectional sample, microstructural flaws were more apparent than in the fracture surface. Microstructural cracking occured close to the filament interface, most likely due to the lack of cohesion between cement particles as air penetrated the printed sample in the dry curing process. Although the crack fell close to the interface between the filaments, the cause was most likely not the interactions between particles at the interface – if that was the case, it would be expected that the cracking took place along (at) or normal to the interface; however, cracks were parallel to the interface approximately 100mm away.
CONCLUSION AND FUTURE DIRECTIONS.
Construction of both a manual and automated extrusion system was successful. Manual extrusion allowed for simple and easy testing of cement mixes when quantitative data was not required, but did not control key extrusion conditions like extrusion rate, pressure, or build plate speed. An automated extrusion system was built to control these extrusion conditions and calibrated for optimal printing performance. A biaxial build plate system was designed and constructed so that cement pastes could be extruded into a set rectangular form.
Further, an optimal mix was developed for this printing setup, incorporating cement paste as well as additives. This mix design utilized additives to achieve optimal extrusion, which was characterized through shear strength in the range of 9-12 kPa. Optimal extrusion was eventually achieved through a specific combination of additives (10% colloidal silica or 5% dry densified silica fume) as well as extrusion conditions, which had to be optimized to this specific printing system because each printing setup was unique and therefore required specific calibration. Additionally, printed samples were imaged with an ESEM to characterize the boundary region between filaments. In the fracture surface, images were taken using secondary electron and backscatter detectors to view the topography and characteristics of the sample. In the cross-sectional sample, images were taken focusing on microstructural cracking that occurred near the filament interface, which could be due to the interactions between filaments. These flaws could be rectified through the addition of nanoparticles or fibers.
Additional objectives for the automated extrusion system include the addition of Z-axis control so that multiple layers can be seamlessly printed, as well as the installation of Arduino-controlled sensors for constant data collection while samples are being extruded. Further imaging with the scanning electron microscope should be performed in order to relate the results from mechanical testing to the microstructural development and to investigate the interface between filaments.
ACKNOWLEDGMENTS.
I would like to thank Dr. Sanchez for being a gracious and willing host, teacher, and mentor. I would also like to thank Rich Teising for his assistance and encouragement during the construction process and Dr. Lesa Brown for her advice and support. Funding for the Sanchez Lab is provided by NSF CMMI 1563389.
REFERENCES.
- M. Mularoni, “U.S. Construction moves steadily forward to finish off a strong 2016” (JLL Construction, 2016)
- R. A. Buswell, R. C. Soar, A. G. F. Gibb, A. Thorpe, Freeform construction: mega-scale rapid manufacturing for construction. Autom. Constr. 16, 224–231 (2007).
- S. Lim, R. A. Buswell, T. T. Le, S. A. Austin, A. G. F. Gibb, Developments in construction-scale additive manufacturing processes. Autom. Constr. 21, 262–268 (2012).
- C. Gosselin, R. Duballet, P. Roux, N. Gaudillière, Large-scale 3D printing of ultra-high performance concrete–a new processing route for architects and builders. Mater. & Des. 100, 102–109 (2016).
- J. Pegna, Exploratory investigation of solid freeform construction. Autom. Constr. 5, 427–437 (1997).
- S. Lim et al., Fabricating construction components using layered manufacturing technology. Glob. Innov. 512–520 (2009).
- S. Lim et al., Development of a viable concrete printing process. Proc. 28th Int. Symp. Autom. Robot. Constr. 2, 665–670 (2011).
- T. T. Le et al., Hardened properties of high-performance printing concrete. Cem. Concr. Res. 42, 558–566 (2012).
- T. T. Le et al., Mix design and fresh properties for high-performance printing concrete. Mater. Struct. 45, 1221–1232 (2012).
- S. A. Austin, C. I. Goodier, P. J. Robins, Low-volume wet-process sprayed concrete: pumping and spraying. Mater. Struct. 38, 229 (2005).
- Y. C. Flores, G. C. Cordeiro, R. D. Toledo Filho, L. M. Tavares, Performance of Portland cement pastes containing nano-silica and different types of silica. Constr. Build. Mater. 146, 524–530 (2017).
- C. C. Castellano, V. L. Bonavetti, H. A. Donza, E. F. Irassar, The effect of w/b and temperature on the hydration and strength of blastfurnace slag cements. Constr. Build. Mater. 111, 679–688 (2016).
- G. Quercia, H. J. H. Brouwers, Application of nano-silica (nS) in concrete mixtures. 8th fib PhD Symp., 431–436 (2010).
- J. Björnström, Effect of superplasticizers on the rheological properties of cements. Mater. Struct. 36, 685–692 (2003).
- ASTM, Standard Test Method for Field Vane Shear Test in Cohesive Soil. Astm. 96, 1–8 (2015).
Posted by John Lee on Tuesday, December 22, 2020 in May 2018.
Tags: 3-D Printing, Additive Manufacturing, Cement, Microstructure, Mix Design