Building a Konstanz Information Miner (KNIME) pipeline to assess the utility of immunofluorescence computational analysis of ALCAM in bladder cancer
ABSTRACT
Because 50% of bladder cancer patients recur or metastasize within two years, even after complete surgical removal of the bladder, biomarkers that can help identify patients requiring aggressive therapy compared to surveillance are necessary. While immunohistochemistry (IHC) staining has traditionally been used to test for markers, IHC is limited to testing one antigen at a time. In addition, the semi-quantitative method of IHC lends itself to arbitrary classifications of marker positivity, which can lead to inadequate diagnosis and treatment recommendations based on subjectivity. Therefore, to address these limitations, we built an image analysis pipeline using Konstanz Information Miner (KNIME) with the following goals in mind: 1) integrate >8 different immunofluorescent stains, which can test for multiple antigens on a single tissue section, 2) perform single-cell segmentation to account for the heterogeneity of tumors and quantify signal on a per cell basis, and 3) calculate the amount of intact Activated Leukocyte Cell Adhesion Molecule (ALCAM) in each cell. ALCAM is a cell surface protein involved in cell-cell adhesion and was previously demonstrated to be a prognostic biomarker in bladder cancer. We were able to successfully construct a KNIME pipeline, perform a pilot analysis (n=10 cores) and validate the pipeline with a larger cohort (n=165 cores). Future directions would be to utilize the percentage of intact ALCAM positive cells, as analyzed through the KNIME pipeline, to improve prediction of patient outcome and aid treatment decisions for bladder cancer patients.
INTRODUCTION.
Bladder cancer (BCa) is the 9th most common cancer worldwide [1] and 4th most common for men in the US, with an estimated 79,030 new cases in 2017 [2]. Although about 80% of patients with bladder cancer are initially diagnosed with non-invasive disease, up to 50% will experience repeated recurrence of non-invasive disease, and up to 15% will progress to muscle invasive disease [3]. Furthermore, patients that develop muscle invasive bladder cancer require complete surgical removal of the bladder, and unfortunately, 50% will still recur or metastasize within 2 years after surgery [4]. This highlights the need for markers to fully characterize the cancer at presentation, predict recurrence, detect invasive disease, and monitor for recurrence and/or metastatic spread.
Bladder cancer, along with many other cancers, is diagnosed by first performing a biopsy, the removal of a small sample of tissue from the patient. Then, a haemotoxylin and eosin (H&E) stain is performed, which allows the pathologist to visualize cellular, nuclear, and extracellular matrix features. Additional immunohistochemistry (IHC) stains might be performed to obtain more information about the tumor, such as identifying markers that differentially diagnose between two similar diseases or cancers, as well as markers that might help aid in treatment decisions or indicate poor outcome [5]. IHC uses antibodies linked to an enzyme or dye to test for specific antigens and has the ability to determine the tumor subtype, as well as identify the primary tissue of origin in the case of metastasis. This information can greatly help with critical treatment decisions and thereby improve clinical outcome.
However, while IHC staining has the ability to convey important information about a tumor, it is still lacking in some ways. Firstly, it is only able to test one antigen at a time, so it can be quite limiting and use up much of the available tissue when there is a large number of antigens to be tested. Secondly, IHC is not always clearly positive or negative. A faint stain might cause one pathologist to classify it as positive, while another negative. As a result, there is a degree of subjectivity involved in interpretation and clinical scoring of IHC stains, leading to ambiguity and differential diagnosis and treatment recommendations based on the pathology report [6]. Third, stains can cause arbitrary classifications (e.g. low, medium, and high) and result in patients not receiving the most effective and targeted treatments for their tumor.
In addition to challenges on classifying the existing tumor, it is also important to identify patients who are at a high risk for recurrence or metastasis, which is the leading cause behind cancer-related deaths, with 50% of BCa patients recurring with metastases within 2 years following surgical removal of the bladder (cystectomy) [4]. Therefore, discovery of prognostic biomarkers that can help predict patient outcome is critical, especially since BCa has few prognostic indicators and none that are employed in the clinic. Prognostic markers can aid treatment decisions by identifying patients with invasive cancer or patients who require aggressive therapy compared to surveillance, monitoring treatment response, and/or predicting patient outcomes such as recurrence, metastasis, and death.
Activated Leukocyte Cell Adhesion Molecule (ALCAM) is a cell surface protein that participates in cell-cell adhesion, which, when disrupted, leads to normal and tumor cell migration [7,8]. Its disruption occurs when the extracellular domain of ALCAM is cleaved from the surface of cells by metalloproteases such as ADAM17 [7]. This extracellular domain “shedding” is increased in invasive and metastatic tumor cells and can be released into nearby biofluids, such as urine, making it a possible biomarker of invasive cancer [7,8]. Shed ALCAM has previously been identified as a potential prognostic biomarker in bladder cancer, where elevated levels of shed ALCAM in biofluids correlates with poor patient outcome and survival [7]. This research has set the precedent of using a dual immunofluorescent (IF) stain against both the intracellular domain (ICD) and the extracellular domain (ECD) of ALCAM to distinguish intact from cleaved ALCAM within tissues to measure “intratumoral” shed ALCAM [8]. Utilizing this dual IF technique, it was shown that shed ALCAM within the tumor correlates with poor patient survival in colorectal cancer [8].
This assessment of intratumoral shed versus intact ALCAM has not yet been performed in bladder cancer. However, because tumors are very heterogeneous, BCa tissue will not display uniform staining of all shed ALCAM or all intact ALCAM. Instead, some areas of the same tumor section will be stained positive for intact ALCAM and others shed ALCAM. Therefore, it is important that tumors be examined at a single-cell level rather than as a whole. Firstly, to address the limitations of IHC, namely the one-antigen, subjectivity, and arbitrary cutoffs issues, the following is proposed: 1) using immunofluorescent stains to test multiple antigens at the same time, thus allowing simultaneous staining of the ICD and ECD of ALCAM to measure colocalization, which indicates presence of intact ALCAM, 2) utilizing a computational approach to analyze these multi-color (>3 antigens) IF stains in order to reduce subjectivity, and 3) calculating and using the percentage of intact ALCAM positive cells over the total number of cells as a continuous measure instead of the aforementioned arbitrary and discrete low, medium, and high levels across tissue. Secondly, single cell analysis will be incorporated into this computational approach to account for the heterogeneity of tumors.
The resources this lab has to execute this proposal include a retrospective cohort of 592 BCa patients with a tissue microarray that consists of 2500 total cores. While this lab is fortunate enough to have access to such a large number of patients, this also requires a computational tool that has the capability of handling the amount of data and staining generated from these patients. Thus, we chose to deploy Konstanz Information Miner (KNIME), a data analysis platform that was originally designed for big data digestion for global marketing and business [9], to build a novel image analysis pipeline for intact ALCAM. KNIME has the ability to achieve the following: 1) integration of >8 different immunofluorescent stains on a single tissue section, 2) single-cell segmentation, and 3) calculation of the amount of intact ALCAM in each cell and the percentage of intact ALCAM positive cells over total cells within each tumor section and within each patient across various cores. The goals of the current study were to construct a KNIME pipeline to quantify ALCAM shedding by dual IF and to validate it using our large bladder cancer tissue microarray (TMA).
MATERIALS AND METHODS.
Cohort Description.
Previous to this project, a retrospective cohort of de-identified patients undergoing radical cystectomy at the institution from 2000-2010 for high-grade bladder cancer (592 patients, 2500 total cores) was assembled. A tissue microarray (TMA) was constructed from formalin-fixed, paraffin-embedded diagnostic tissue blocks with 1 mm cores. Each patient contributed normal, tumor, carcinoma in situ (CIS), and noninvasive papillary carcinoma tissue samples. For this proposal, representative cores from this cohort were used to train the KNIME workflow.
Immunofluorescence (IF).
Immunofluorescence was performed on the TMA described above. Sections (5µm) were deparaffinized and rehydrated, and antigen retrieval was performed by a pressure cooker in citrate buffer (pH 6.0) and sections blocked in 20% Aquablock (East Coast Biologics) plus 0.05% Tween-20. Commercial antibodies rabbit monoclonal anti-human ALCAM/CD166 (intracellular; ab109215, Abcam) and mouse monoclonal anti-ALCAM/CD166 (extracellular; 4H9A5, Novus Biologicals) were used to detect intact ALCAM by colocalization IF. The bladder epithelial cells were identified with anti-pan-cytokeratin-biotin antibodies. Nuclear DNA was stained with Sytox Green. Stained slides were mounted in ProLong Gold Antifade mounting solution (Invitrogen). The slides were then digitalized by an Ariol scanning system in the institution core facility.
Konstanz Information Miner (KNIME).
KNIME is a graphics-based user interface for the development of computational workflows [9]. KNIME is based in Java but incorporates both Python and R, as well as other image processing tools, such as ImageJ, CellProfiler, and MatLab. In KNIME, each colored box represents a node. Each node can be configured to execute a unique function. Nodes can be manually connected together to perform a series of functions and form a pipeline. Using this rationale, a pipeline was created for the analysis of intact ALCAM.
RESULTS.
KNIME can concurrently analyze IF stains for intact ALCAM.
In order to computationally quantify intact ALCAM in each cell in the BCa patient cohort by dual immunofluorescence (Figure 1), an image analysis pipeline was built in KNIME (Figure 2), which has the ability to import hundreds of IF images and perform intact ALCAM analysis concurrently. The colored boxes shown below (e.g. “Image Reader”) are nodes and the gray boxes (e.g. “Single Cell Segmentation”) are metanodes. A metanode is a group of nodes compressed into one space, as demonstrated by the opening of the “Intact ALCAM Mask” metanode (bottom left inset, Figure 2).
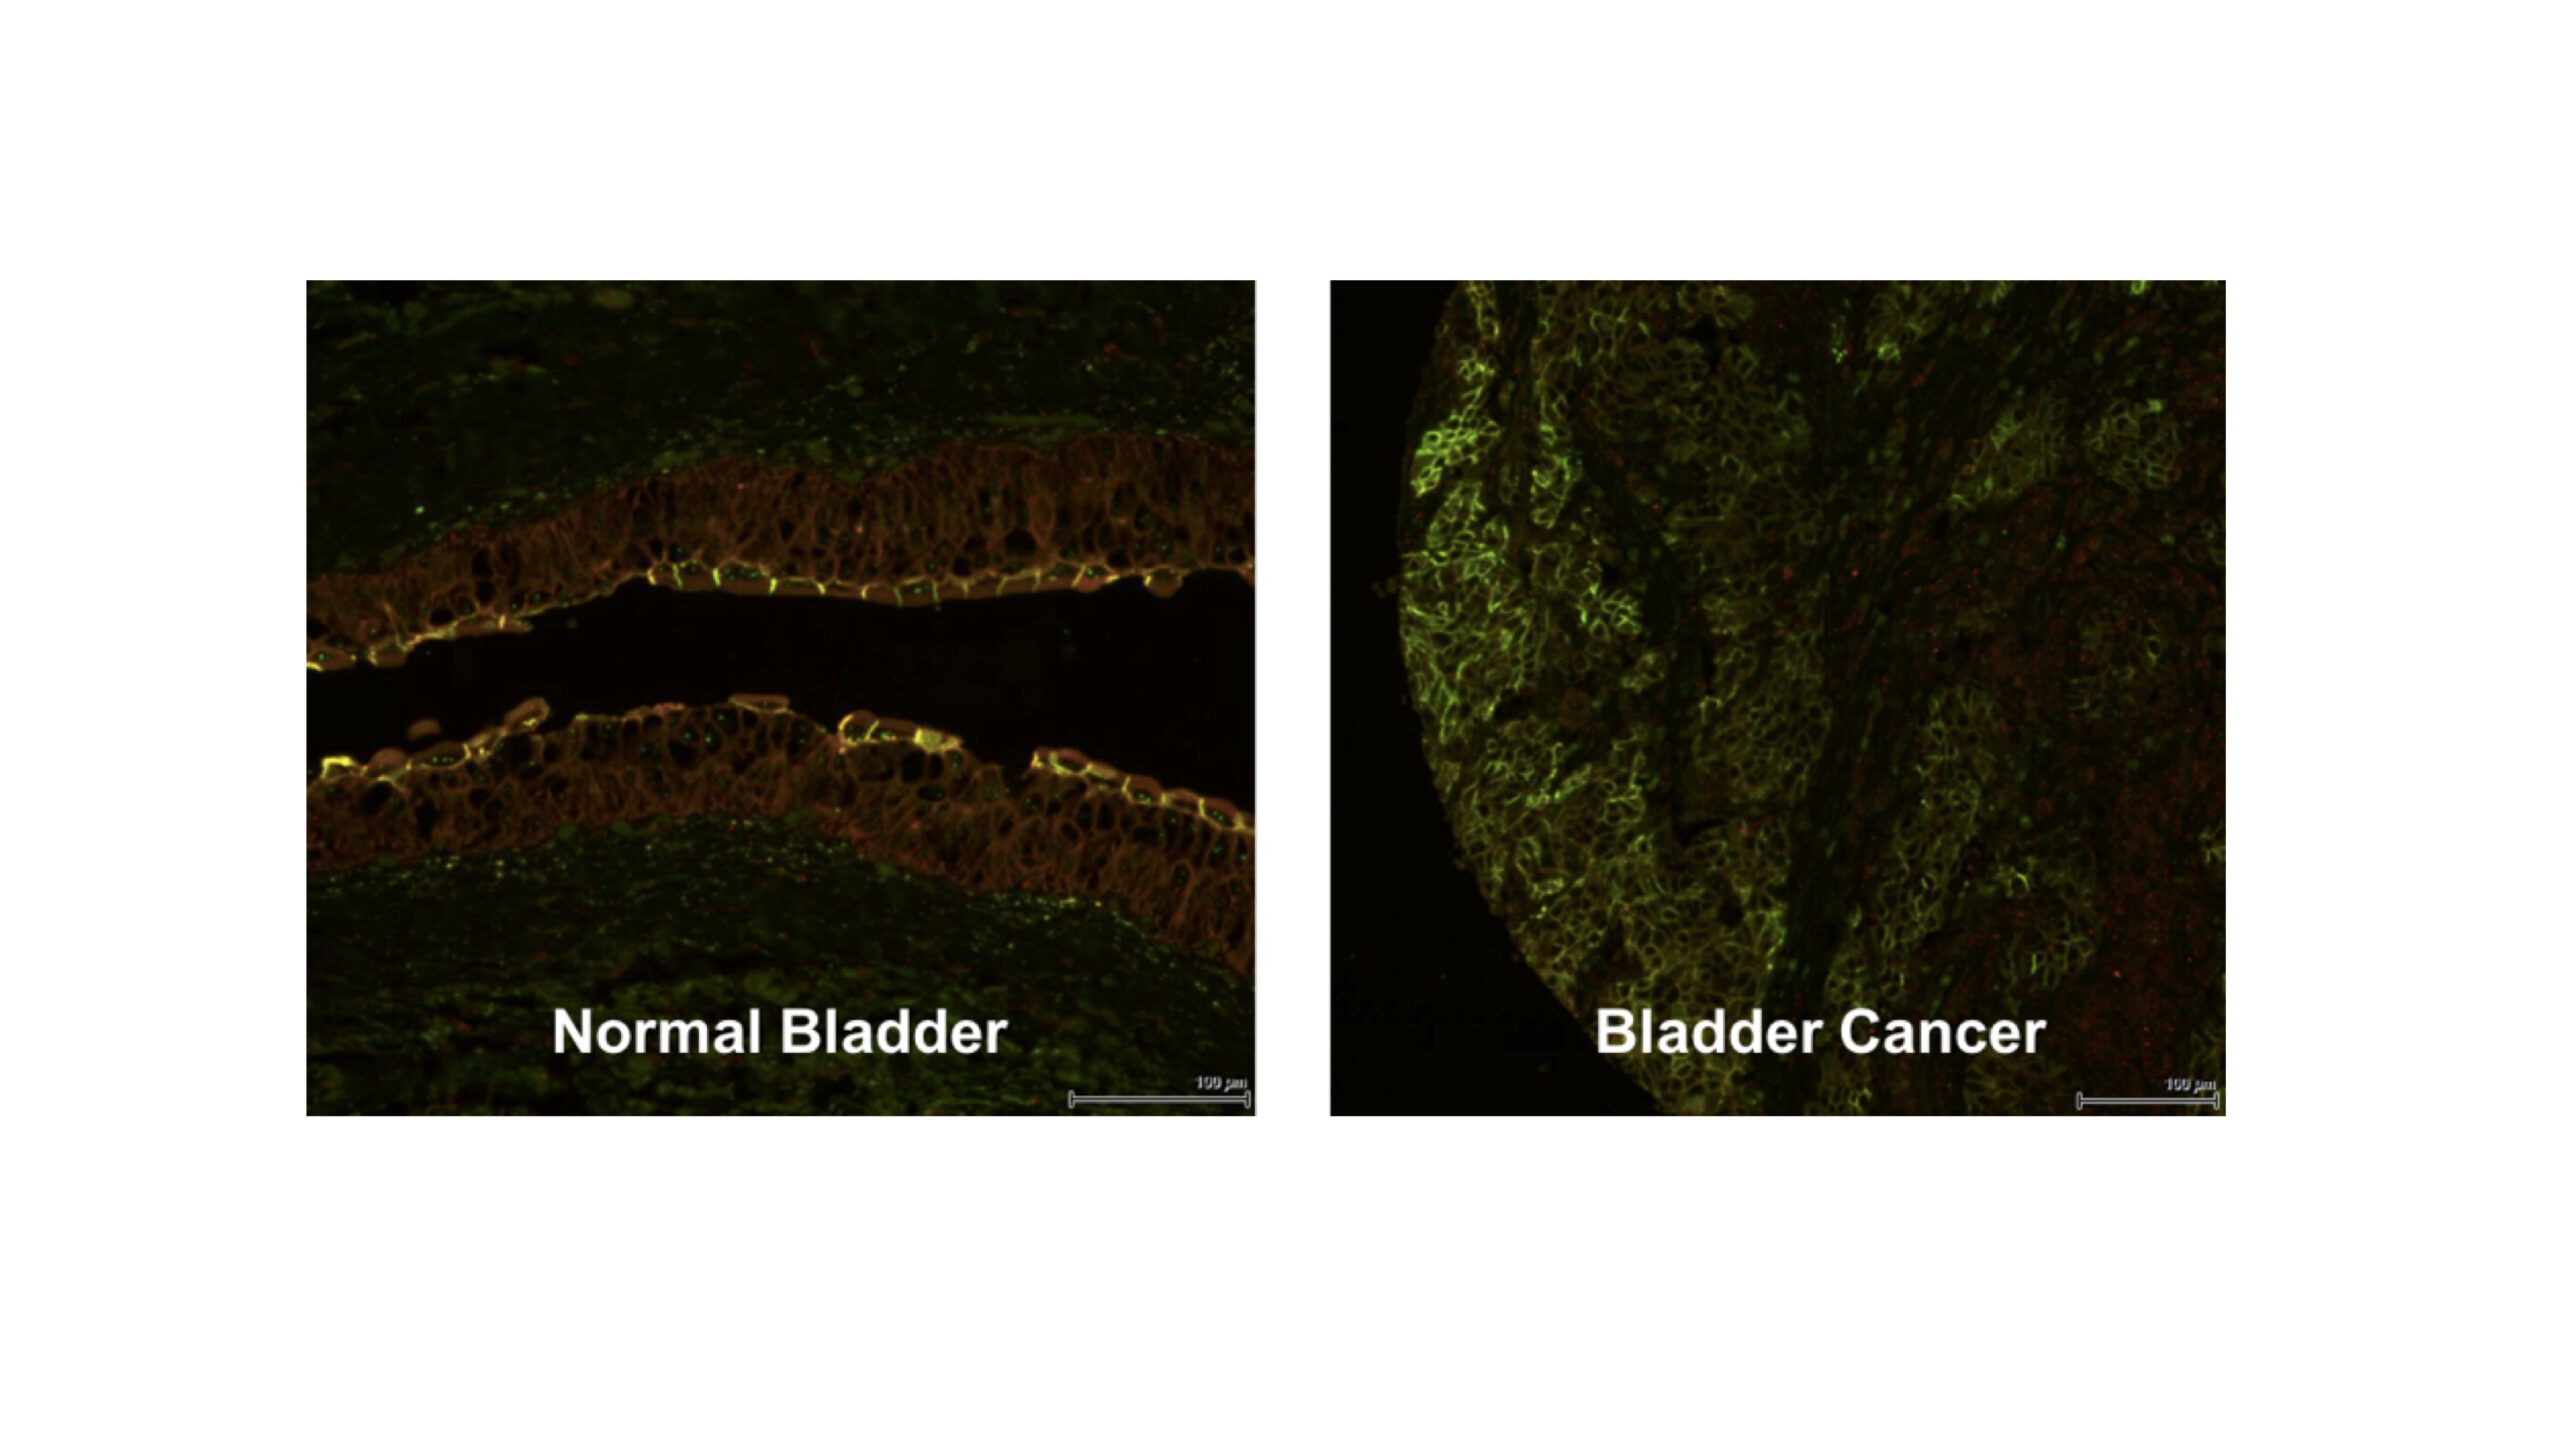
Figure 1. ALCAM shedding can be quantified by dual immunofluorescence. IF stains of normal bladder and cancer tissue with ALCAM ICD (green) and ALCAM ECD (red). The presence of green without red indicates shed ALCAM and the colocalization of green and red (yellow) indicates intact ALCAM. Normal bladder should have more intact ALCAM (yellow), as seen in the umbrella cells above, while bladder cancer should demonstrate heterogeneously decreased intact ALCAM or increased ALCAM shedding (green).
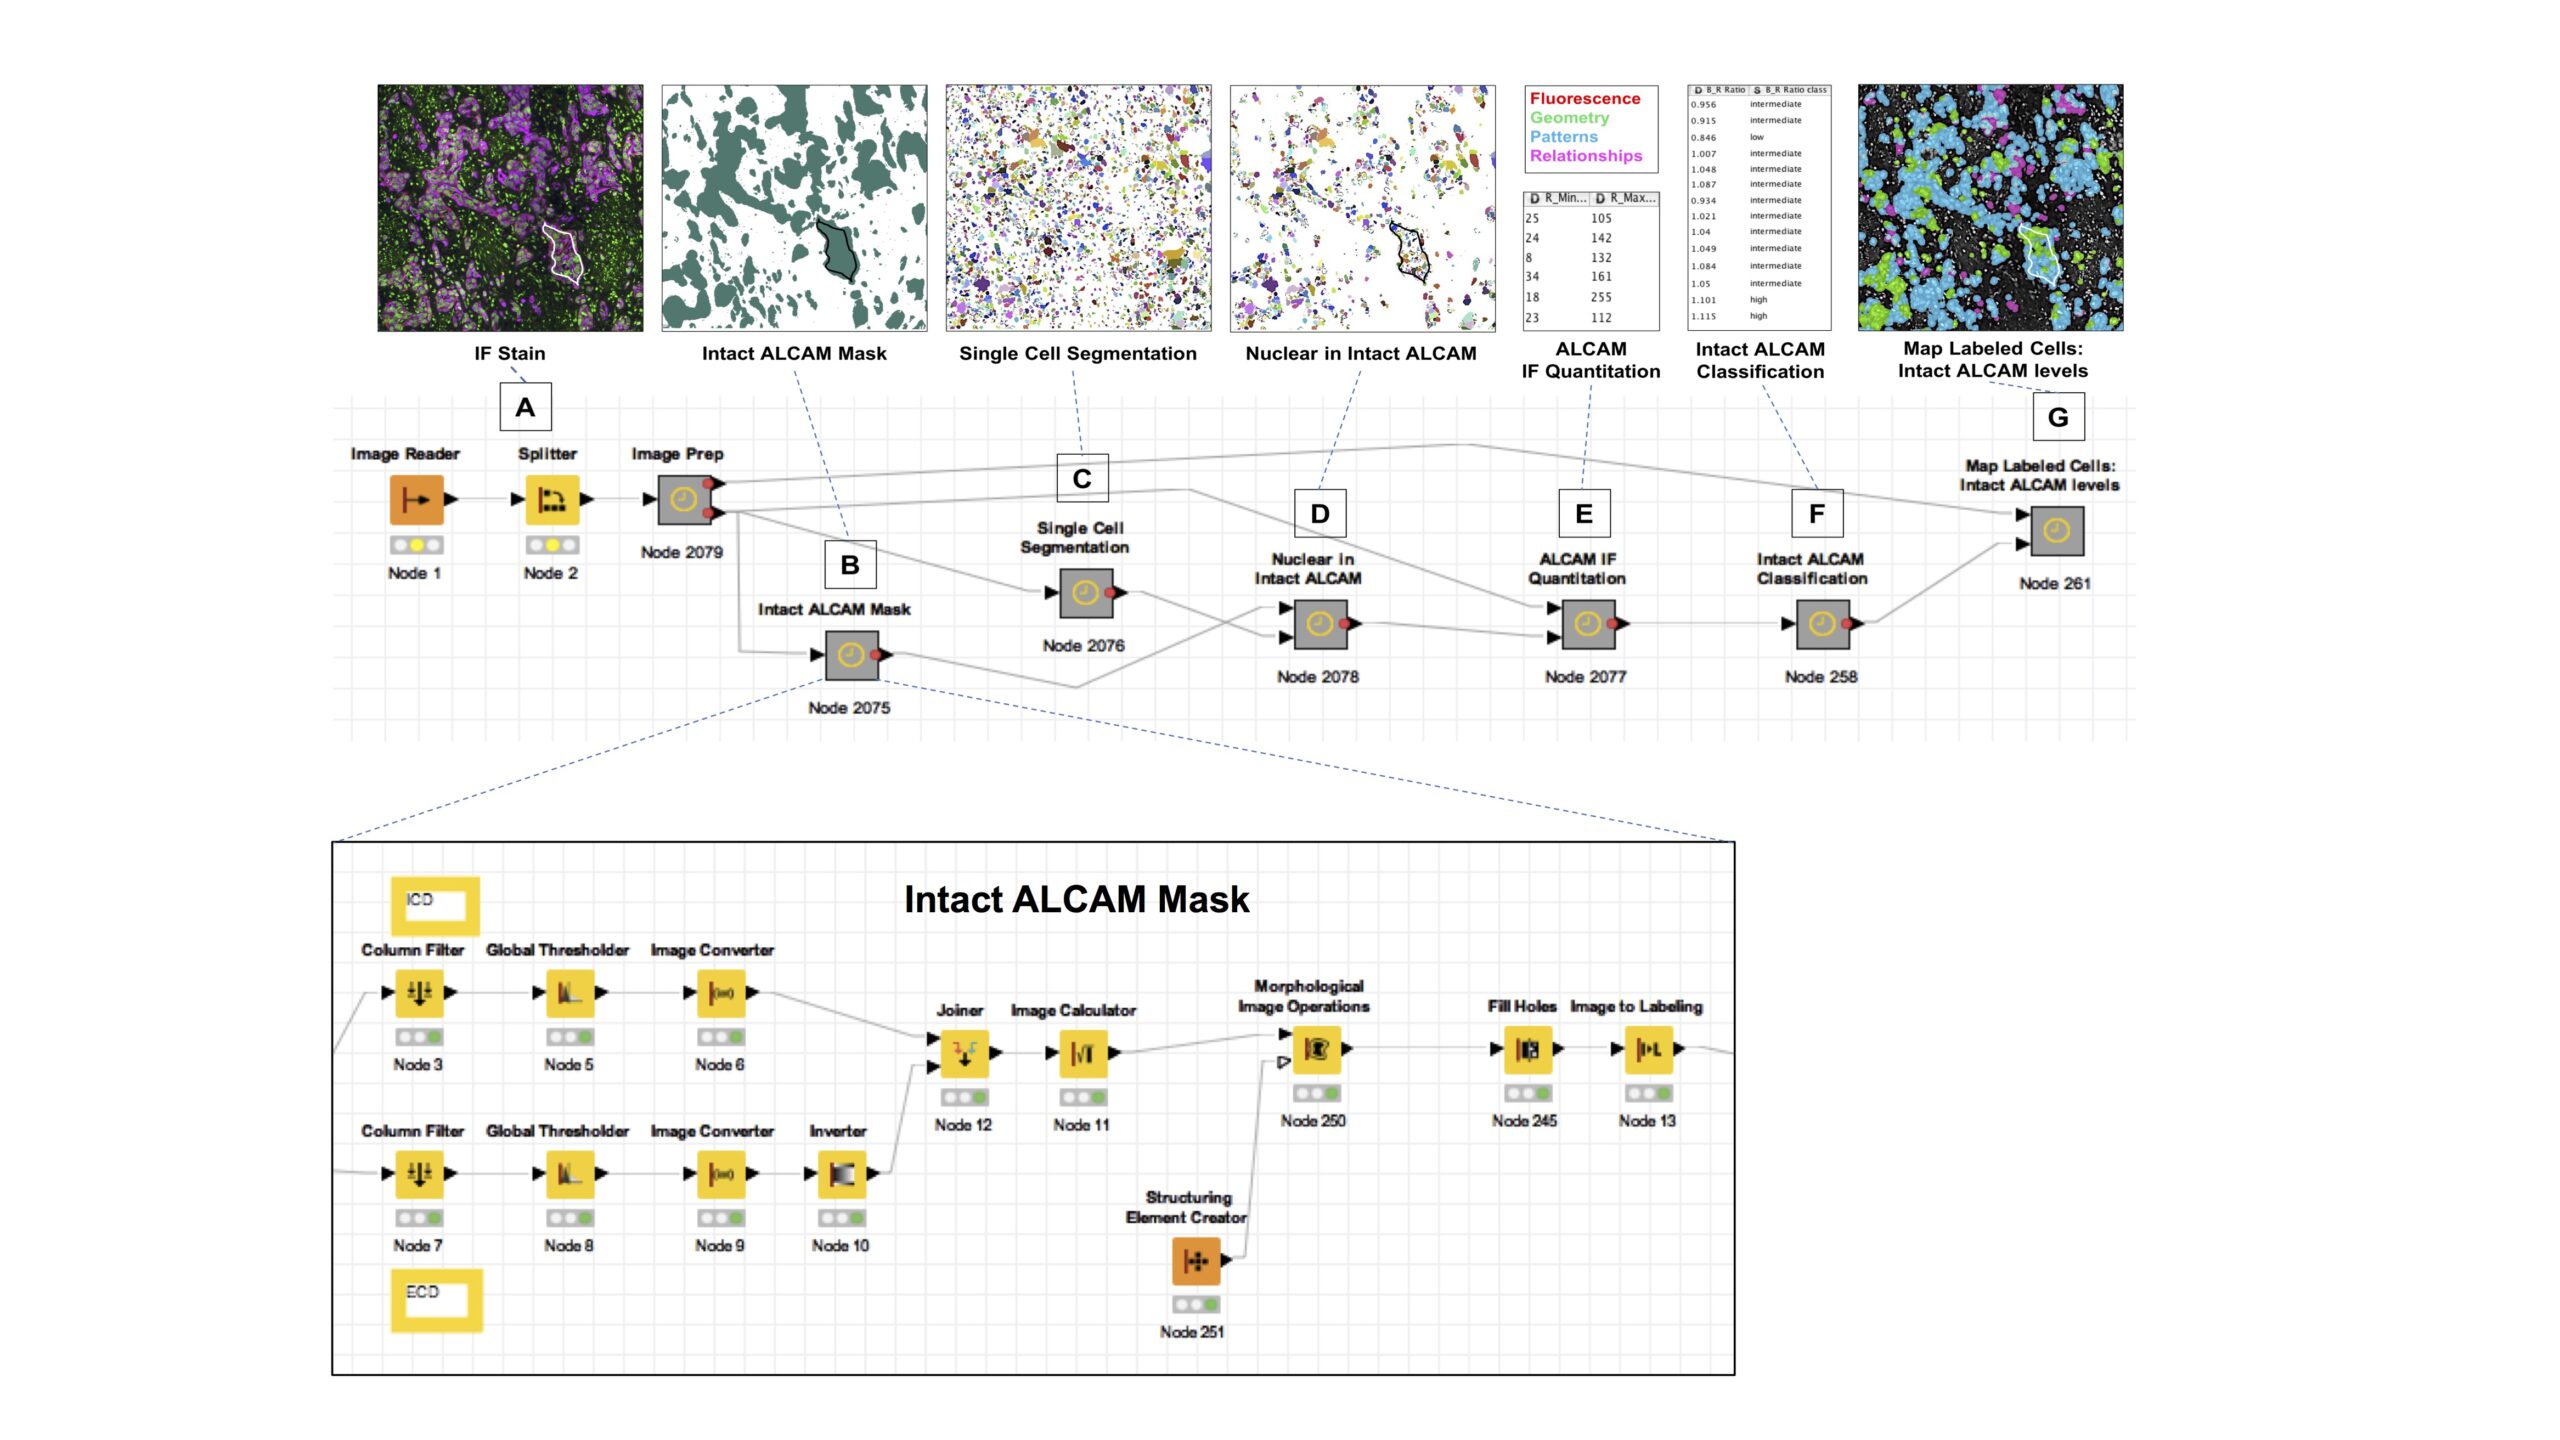
Figure 2. KNIME pipeline for quantification of intact ALCAM in a large bladder cancer tissue microarray using multiplex immunofluorescence and single-cell segmentation. The products of each step are displayed above the nodes (colored boxes) and metanodes (grey boxes). A metanode is a group of nodes compressed into one space, as shown above by the “Intact ALCAM Mask” metanode (expanded window, bottom). A) IF stains were imported in the “Image Prep” metanode. B) In the “Intact ALCAM Mask” metanode, the colocalized mask of intact ALCAM is formed. C) The original stain was split into single cells in the “Single Cell Segmentation” metanode. D) Only the segmented cells that fit into the intact ALCAM mask were visualized in the “Nuclear in Intact ALCAM” metanode. E) The “ALCAM IF Quantitation” metanode measured quantitative features of the cells such as sum intensity and skewness. F) In the “Intact ALCAM Classification” metanode, the percentage of intact ALCAM positive cells was calculated. G) In the “Map Labeled Cells” metanode, the labeled cells were visually mapped back to the original stain.
KNIME forms colocalized mask of intact ALCAM.
In the Image Prep metanode (Figure 2A), IF stains were imported into the image reader node and the image was split into its respective channels. The tissue microarray (TMA) block and core location for each image was also annotated. In the Intact ALCAM Mask metanode (Figure 2B), the ALCAM intracellular domain (ICD) and extracellular domain (ECD) stains were first thresholded separately. Then, the area where the ICD and ECD stains overlapped was designated as the colocalized mask, where only intact ALCAM was present (emerald green area, Figure 2B).
KNIME splits IF stains into single cells.
In the metanode titled Single Cell Segmentation (Figure 2C), the computer was manually trained on what sections to keep (e.g. inside of a cell) and exclude (e.g. background and area between cells) in order to learn how to recognize a single cell and segment the image into single cells. Thus, the product of the single-cell segmentation was the original image but split into its single cells. Unique labels were also created for each cell so that it could be mapped back to the original image for tissue patterning.
KNIME calculates amount of intact ALCAM per cell.
In the Nuclear in Intact ALCAM metanode (Figure 2D), only the segmented cells that fit into the intact ALCAM mask were visualized. The next metanode, titled ALCAM IF Quantitation (Figure 2E), measures features about the fluorescence, geometry, patterns, and relationships of the cells. For example, the minimum and maximum fluorescence of the ECD in each cell is displayed in Figure 2E. Once a feature has been quantified, then any calculations can be applied on a single-cell basis. To determine the amount of intact ALCAM per cell, the ratio of the ECD fluorescence signal to the ICD fluorescence signal in each cell was calculated (Figure 2E).
KNIME determines percentage of intact ALCAM positive cells per core and provides spatial visualization of intact ALCAM levels.
In the Intact ALCAM Classification metanode (Figure 2F), the amount of intact ALCAM per cell was classified as a low, intermediate or high level only for the purpose of visually mapping it back to the original image. The percentage of intact ALCAM positive cells over the total number of cells was also calculated, which is a more continuous measure and, ultimately, can be used to correlate with patient outcome. Finally, in the Map Labeled Cells: Intact ALCAM Levels metanode (Figure 2G), the labeled cells were visually mapped back to the original stain. The green color corresponds to low intact ALCAM levels, blue to intermediate intact ALCAM levels, and pink to high intact ALCAM levels.
Pilot Cores.
Ten representative cores were first run through the pipeline as a proof of principle. In this small cohort, the distribution of intact ALCAM levels (ECD/ICD ratio) was skewed to the right, indicating that the majority of cells displayed low intact ALCAM levels (higher shedding) while a minority retained very high levels of intact ALCAM (low shedding). As a result, we divided cells based on intact ALCAM into two groups, where cells with an intact ALCAM ratio greater than the median (1.2) were classified as high (red) and those below the median were classified as low (green). Figure 3 displays two tumor cores run through the KNIME pipeline, along with classification and mapping of cells with high versus low intact ALCAM back to their respective cores. The percentage of high intact ALCAM classified cells within each core was calculated by using the total cell number as the denominator (Figure 3). The top core has more of an inter-mixed distribution of low and high intact ALCAM cells, with a majority of cells classified as high intact ALCAM (62.2%), while the bottom core is more segregated and has a reduced percentage of high intact ALCAM cells, suggesting it has increased ALCAM shedding and a stronger proportion of invasive cells (Figure 3). Just from these two cores, the heterogeneity of cell phenotypes within tumors can already be seen, emphasizing the necessity to develop a pipeline within KNIME to perform single-cell segmentation and provide spatial visualization of this heterogeneity within tissues.
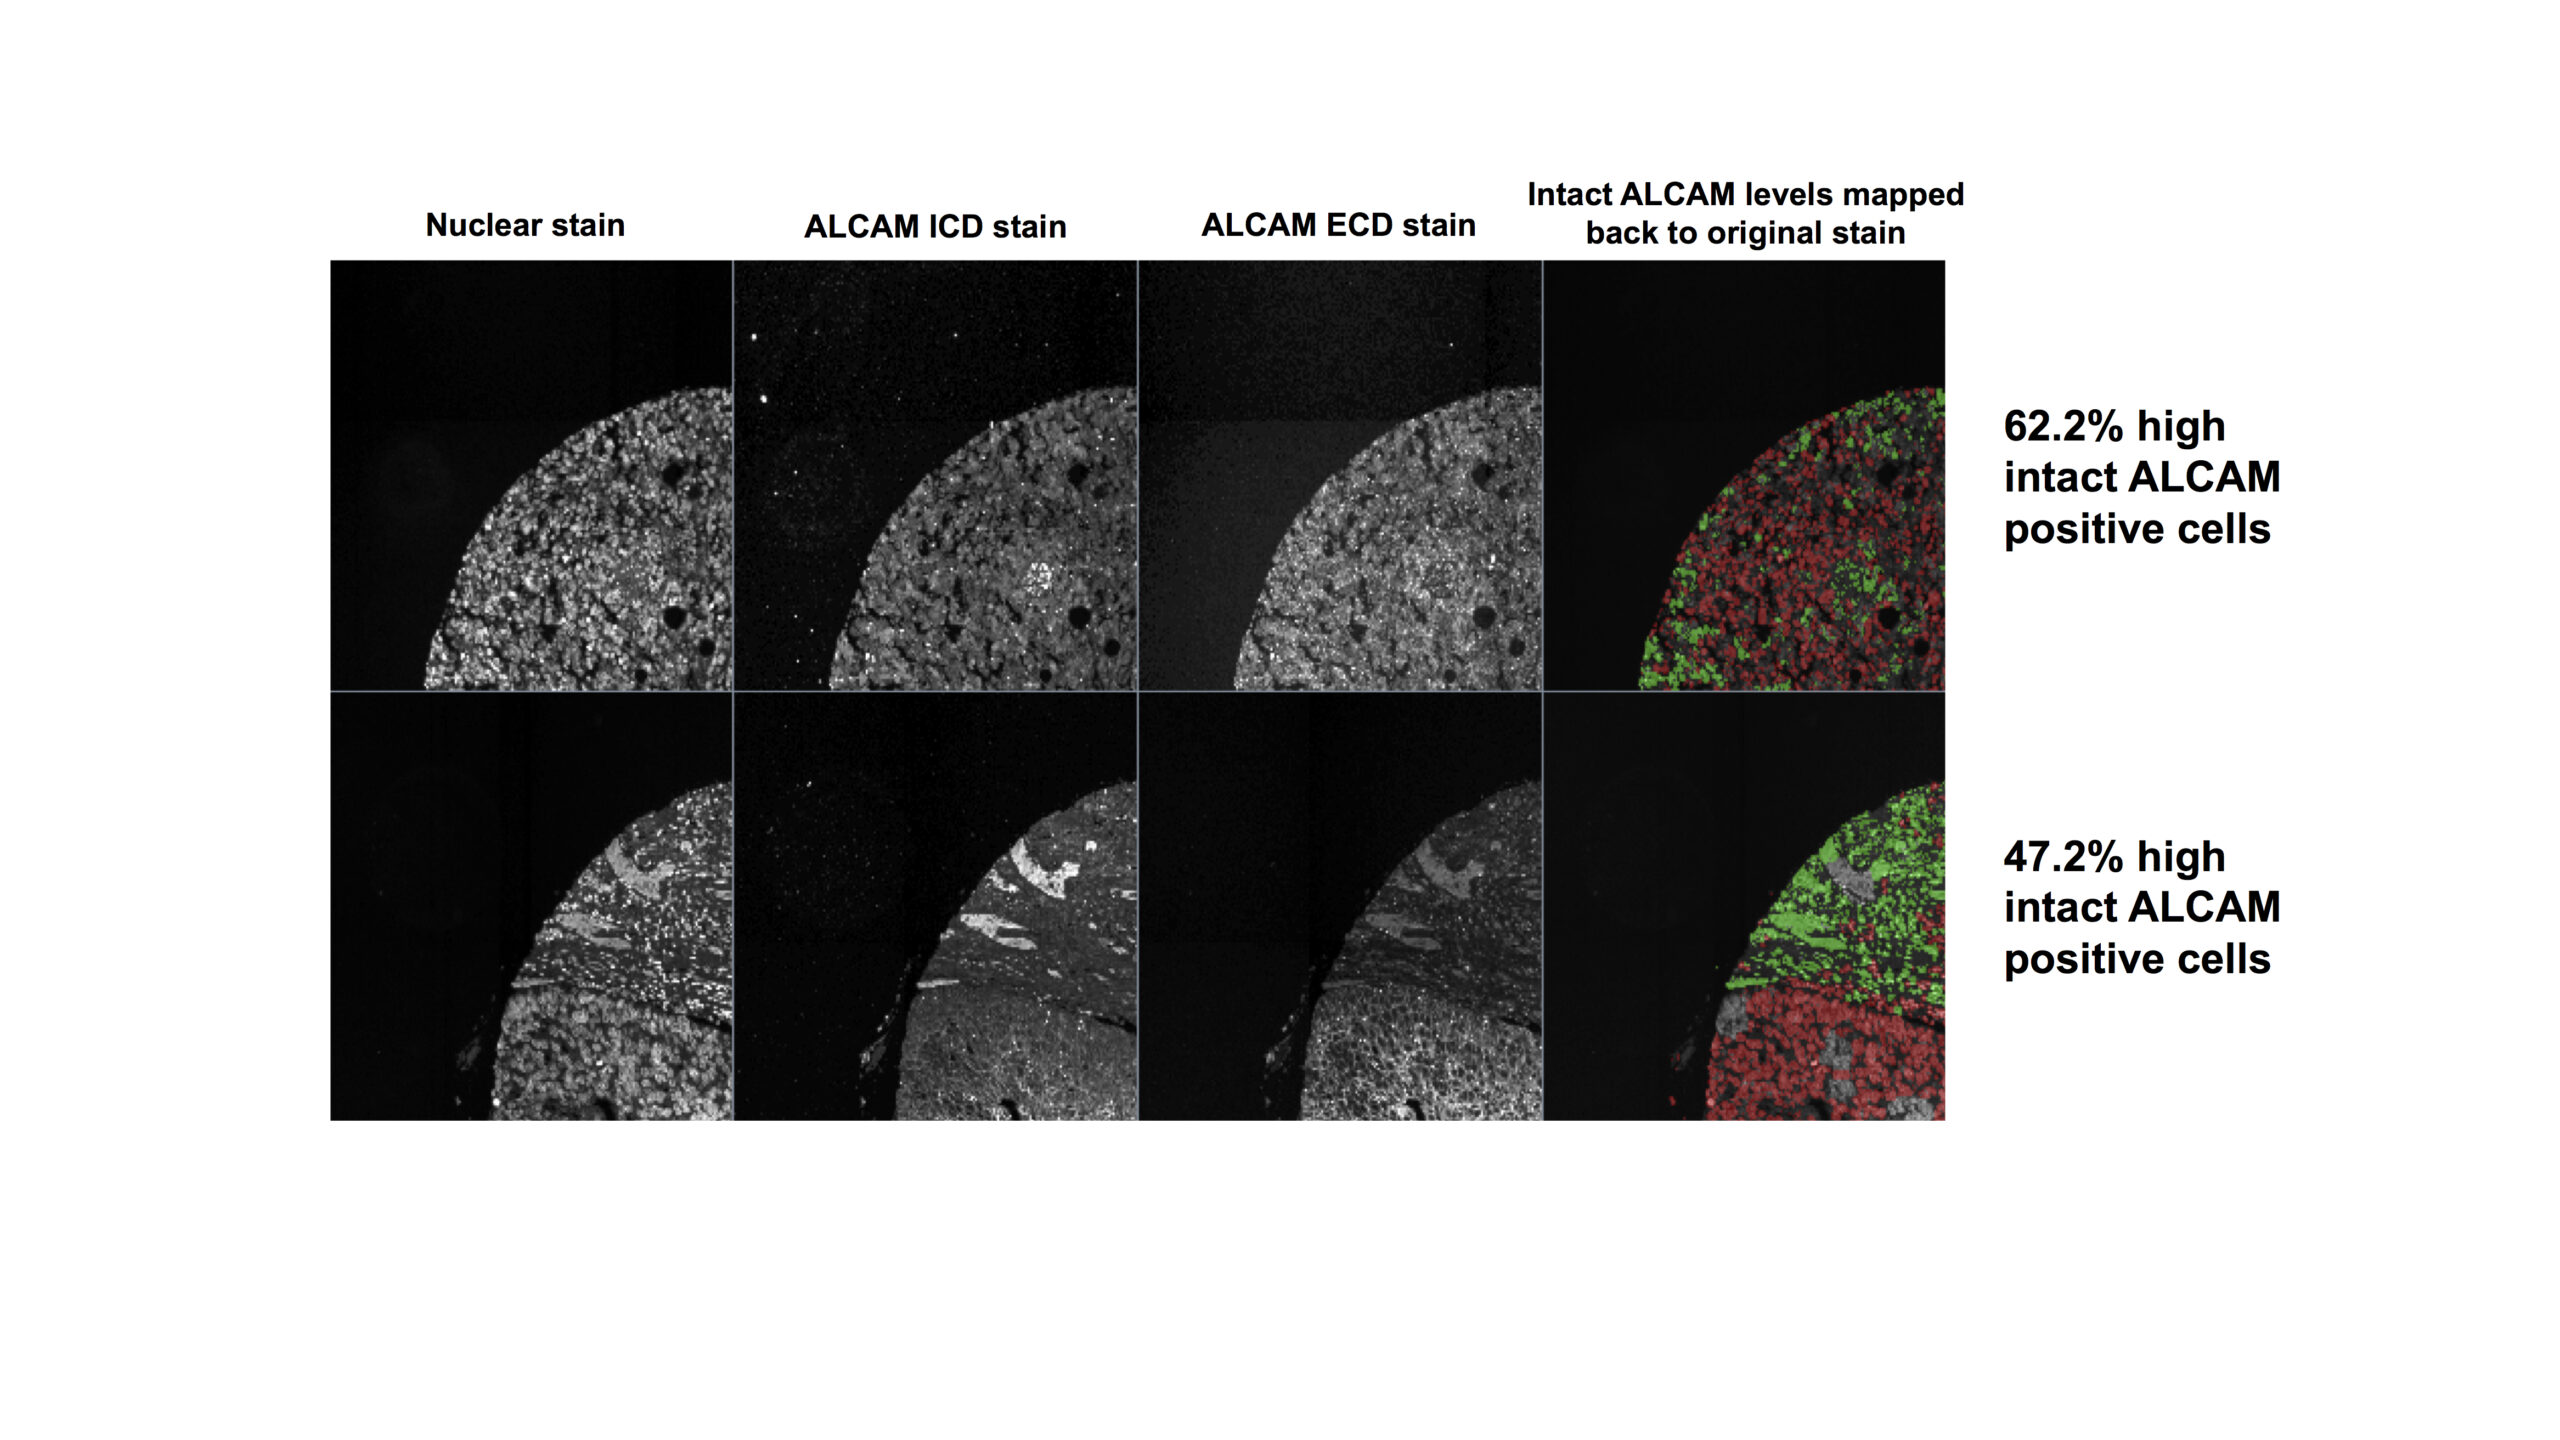
Figure 3. Mapping of intact ALCAM for individual cells back to the tissue using the KNIME pipeline. Nuclear, ALCAM ICD and ALCAM ECD stains for two representative cores run through the pipeline. The final column displays the intact ALCAM level per cell, high (red) vs. low (green), mapped back to the original nuclear stain. The percentage of high intact ALCAM positive cells (red) was calculated for each core by dividing the number of high intact ALCAM positive cells by the total number of cells, where high was defined by ECD/ICD > median of 1.2.
Scaled-Up Analysis.
A larger number of cores (n=165) was then analyzed with the pipeline and the distribution of intact ALCAM levels (ECD/ICD ratio) was still skewed to the right, indicating that the majority of cells displayed low intact ALCAM levels (higher shedding) while a minority retained very high levels of intact ALCAM (low shedding). Similar to the pilot cores analysis, we divided cells based on intact ALCAM into two groups, where cells with an intact ALCAM ratio greater than the median (1.2) were classified as high and those below the median were classified as low. The consistency of the median between the pilot group (10 cores) and the larger cohort (165 cores) supports KNIME’s ability to successfully analyze a larger sample size and validates the reproducibility of our pipeline. The distribution frequency of the percent of high intact ALCAM positive cells for each core can be found in the supplemental figure, while mean and interquartile range were 53±32% (SD) and 23, 54, 83% (IQR), respectively.
DISCUSSION AND CONCLUSIONS
We successfully constructed a novel image stain analysis pipeline in KNIME that has the ability to perform single-cell segmentation, quantify and colocalize intact ALCAM, and handle the thousands of immunofluorescence stains and millions of cells generated by the large number of tissues collected for the bladder cancer cohort. This demonstrates the potential of KNIME to be a computational tool used to analyze tissue-based biomarkers. A clinician could then take the KNIME-calculated percentage of intact ALCAM into account when deciding the best treatment for a patient. For example, based on results from previous studies mentioned in the introduction [7,8], a low percentage of intact ALCAM cells could indicate poor patient outcome and therefore indicate the need for aggressive cancer treatment in the perioperative space.
Future directions include analyzing the whole TMA cohort (592 patients, 13 blocks, 2500 cores) through the KNIME pipeline, as only a representative portion was analyzed in this project as proof of principle. The overarching future goal is to validate ALCAM shedding as a prognostic biomarker of bladder cancer, as previous manuscripts measured shed ALCAM in the biofluid [7]. This requires correlating IF levels of shed ALCAM to patient outcome. Although previous manuscripts did also measure ALCAM in the tumor tissue by immunofluorescence, the antibody was directed against the ECD only, which is an indirect and non-specific way of assessing shedding and cannot distinguish changes in shedding from changes in expression [7]. Additionally, using the ALCAM ICD/ECD ratio to provide spatial distribution of ALCAM shedding in the tumor microenvironment such as determining levels of ALCAM shedding near the tumor periphery, lymphatics, distinct immune cell populations, vasculature and, subsequently, correlating this distribution to tumor metastasis and patient outcome should be explored. This is made possible with the ability of KNIME to integrate and analyze up to 8 immunofluorescence markers at once.
By building a computational approach to analyze thousands of immunofluorescent stains simultaneously for a biomarker, such as quantifying intact ALCAM and calculating a percentage of intact ALCAM positive cells, this project addresses the aforementioned limitations of immunohistochemistry, including the one-antigen, subjectivity, and arbitrary cutoff issues. This KNIME pipeline also takes into account the complex heterogeneity of tumors. A primary strength of this project is its potential extrapolation to the larger scientific community because it utilizes KNIME, a free, open-source platform that was originally developed for business. As other options currently remain commercially-based and too expensive for everyday use, such as in the discovery of novel biomarkers, the significance of KNIME is emphasized because it can serve as an easily-accessible tool for many researchers. Not only does KNIME harbor the great potential to improve prediction of recurrence and survival in bladder cancer patients and aid treatment decisions and improve patient care, but it can also be applied to a variety of fields requiring large-scale image analysis including pharmaceutical research, business intelligence, and bioengineering.
ACKNOWLEDGMENTS.
We would like to thank Dr. Angela Eeds and the School for Science and Math at Vanderbilt. We would also like to thank the team at KNIME, especially Christian Dietz. Lastly, we would like to acknowledge funding through NIH R01 CA143081 (AZ), AIHS CRIO 10008225 (AZ) and the Department of Veterans Affairs CDA IK2BX002498 (SAE).
SUPPORTING INFORMATION.
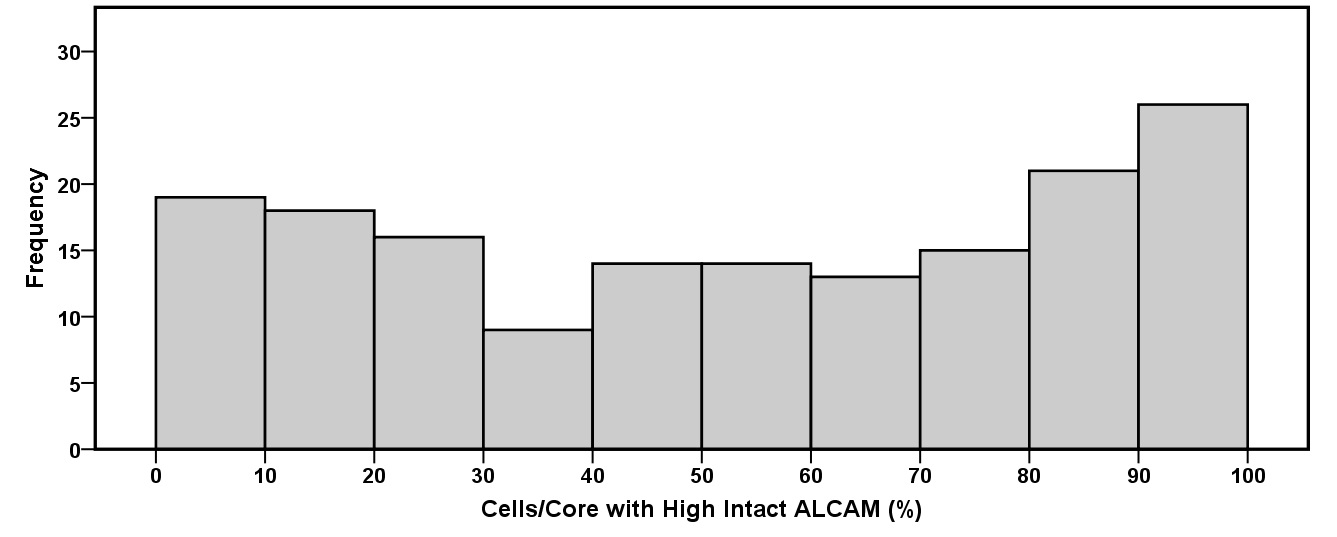
Supplemental figure of the frequency distribution of the percent high intact ALCAM positive cells per core for the scaled-up analysis with the KNIME pipeline.
REFERENCES.
- J. Ferlay et al, Cancer incidence and mortality worldwide: Sources, methods and major patterns in GLOBOCAN 2012. International Journal of Cancer 136, E359-E386 (2014).
- R. Siegel, K. Miller, and A. Jemal, Cancer statistics, 2017. CA: A Cancer Journal for Clinicians 67, 7-30 (2017).
- B. Rhijn et al, Recurrence and Progression of Disease in Non-Muscle-Invasive Bladder Cancer: From Epidemiology to Treatment Strategy. European Urology 56, 430-443 (2009).
- F.A. Yafi et al, Surveillance guidelines based on recurrence patterns after radical cystectomy for bladder cancer: the Canadian Bladder Cancer Network experience. BJU International 110, 1317-1323 (2012).
- M. Tischkowitz et al, Use of immunohistochemical markers can refine prognosis in triple negative breast cancer. BMC Cancer 7 (2007).
- U. Vogel, Confirmation of a low HER2 positivity rate of breast carcinomas – limitations of immunohistochemistry and in situ hybridization. Diagnostic Pathology 5 (2010).
- S. Arnold et al, Shed urinary ALCAM is an independent prognostic biomarker of three-year overall survival after cystectomy in patients with bladder cancer. Oncotarget 8, 722-741 (2017).
- A. Hansen et al, Elevated ALCAM shedding in colorectal cancer correlates with poor patient outcome. Cancer Research 73, 2955-2964 (2013).
- W. Warr, Scientific workflow systems: Pipeline Pilot and KNIME. Journal of Computer-Aided Molecular Design 26, 801-804 (2012).
Posted by John Lee on Tuesday, December 22, 2020 in May 2018.
Tags: ALCAM, bladder cancer, KNIME, single-cell analysis