Automated diagnosis of 7 retinal diseases with convolutional neural networks in a dataset of 2,234 eye images
ABSTRACT
Ophthalmologists are critical for diagnosis of retinal diseases, however with a training period of 12 years there is an acute shortage of ophthalmologists in many communities. Diagnosis of retinal disease with machine learning has been widely studied as an approach to alleviate the shortage of ophthalmologists. However, prior studies often focus on just a single retinal disease and do not consider the multiple retinal diseases which occur in patients. In this study, we utilize a dataset including eight retinal disease outcomes and train five residual network models corresponding to each of the disease outcomes in the training set. We find the highest predictive performance with cataract and pathological myopia obtaining an F1 score of 96% and 94% respectively. Furthermore, we utilize a transfer learning approach training a model on a model on an initial retinal disease and transferring the insights of the trained model for further training on a second disease outcome despite no further increase in sample size. Finally, we train a model which can simultaneously detect two retinal disease outcomes at the same time. In the future, this approach could enable a single neural network to be utilized for diagnosis across multiple patient groups.
INTRODUCTION.
Currently, to get an accurate diagnosis of a retinal disease, a patient has to consult an ophthalmologist. Ophthalmologists, however, may not be accessible to everyone and with the American Association of Medical Colleges predicting a shortage of ophthalmologists by 2025 (1) the demand for an alternate method of diagnosis is increasing. One such alternate method of diagnosis is automation. The challenge with automation is that model performance is variable across different retinal disease categories and parameters.
Previous work has focused on generating models to diagnose specific retinal diseases including dry age related macular degeneration (2), diabetic retinopathy (3), pathological myopia (4), glaucoma (5), and cataract (6). However, this work is limited because a comparison of performance of supervised training methodology across multiple disease areas has not been performed. Therefore, in this study we extend on prior work by comparing the performance of multiple supervised training methodologies on seven retinal diseases (Fig. 1).
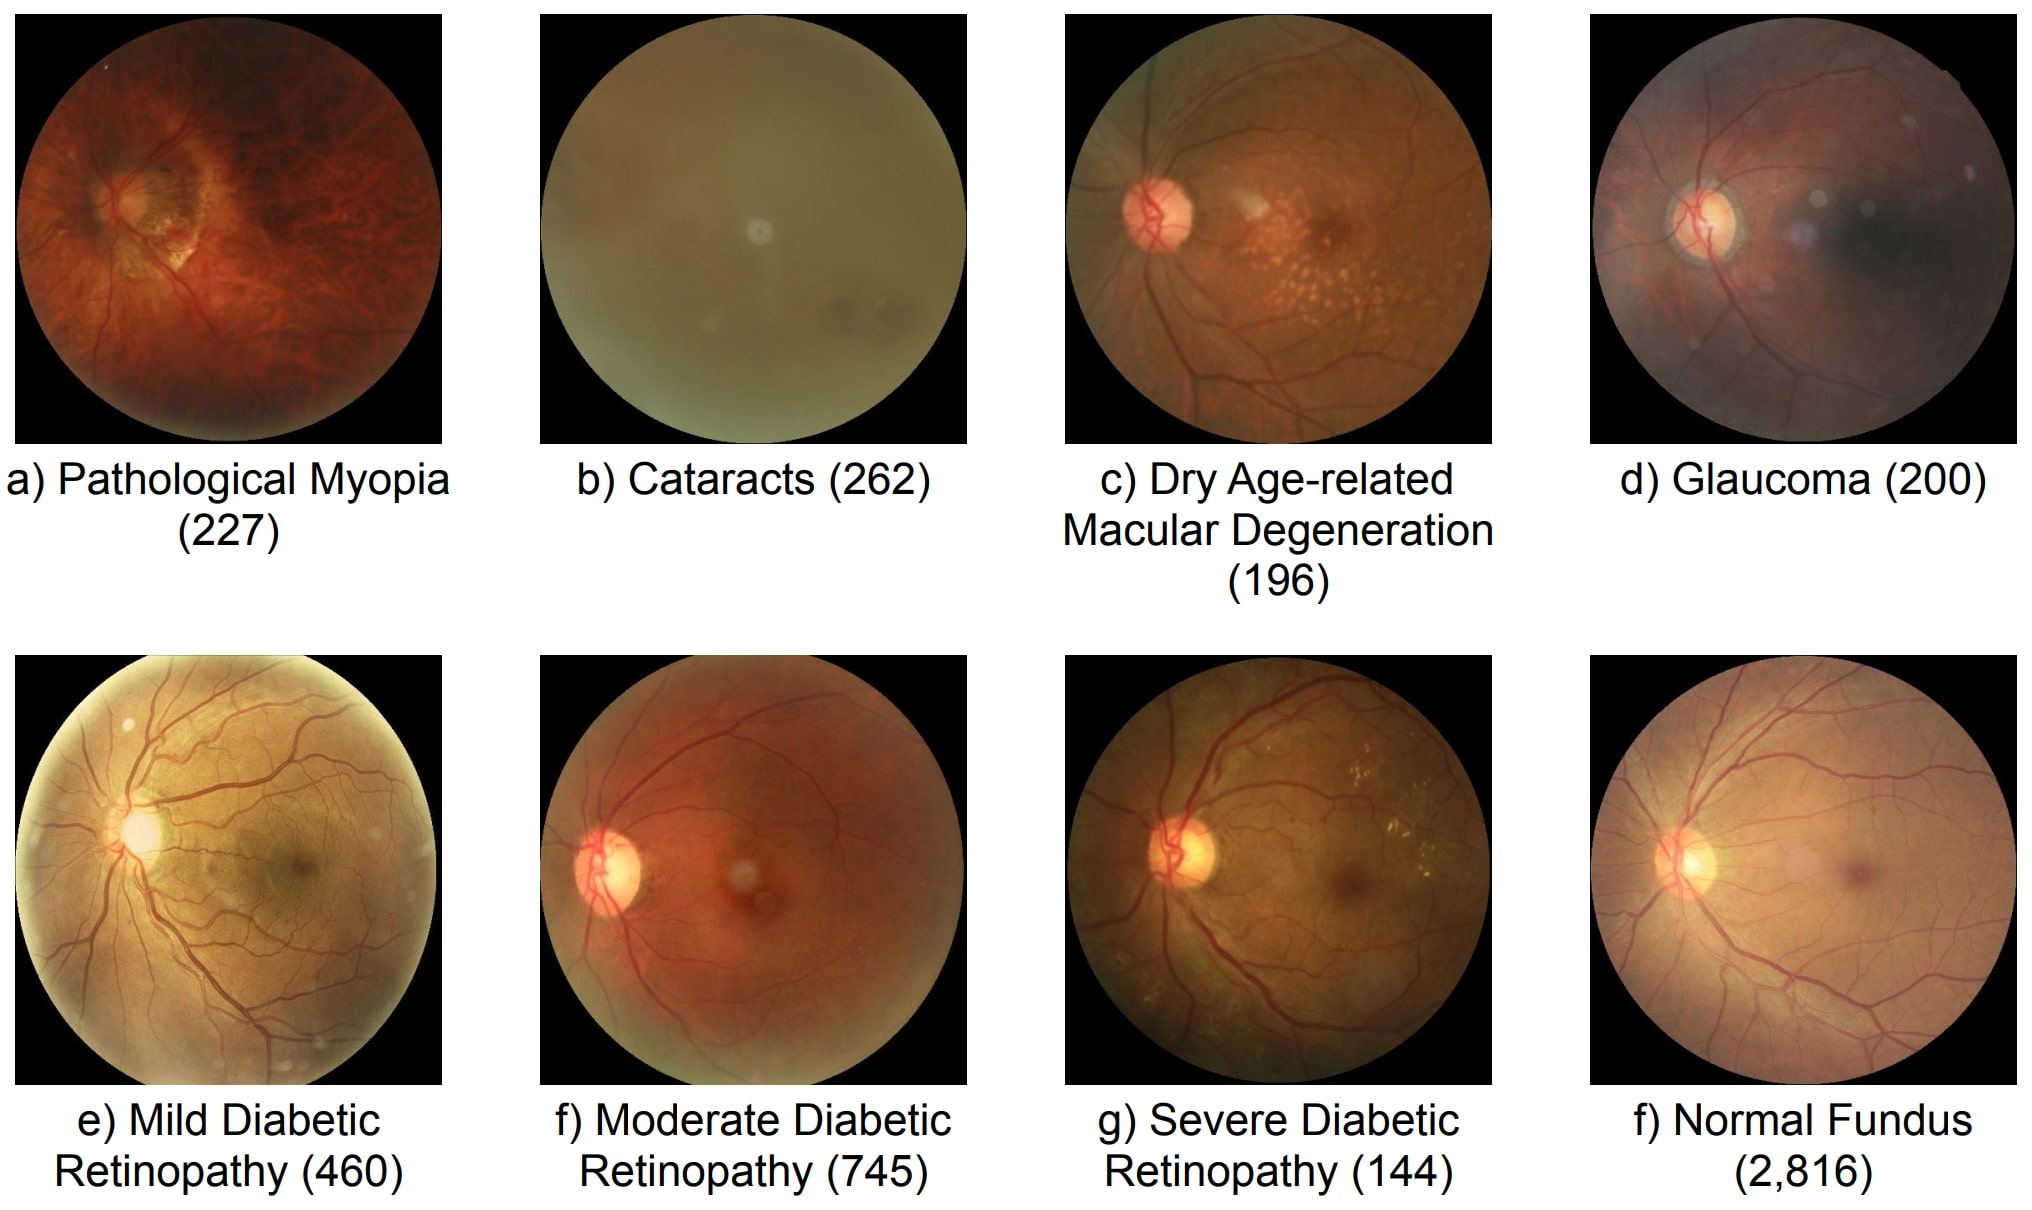
Figure 1. Disease image examples and counts for each of the seven diseases.
Model generation is dependent on training data and other studies have shown that greater training set size results in superior model performance. Across the seven disease categories sample size varies between 144 and 745, I hypothesized that models trained to detect disease categories with the greatest sample size including mild and moderate diabetic retinopathy will have the greatest predictive accuracy. To address these limitations, I also utilized transfer learning enabling a trained model to apply insights gained from training o a previous disease category to test if this approach results in increased performance compared to the traditional training.
MATERIALS AND METHODS.
Dataset. Our ophthalmic dataset of 5,000 fundus images were collected by Canon, Zeiss, and Kowa cameras from medical centers in China by Shanggong Medical Technology Co., Ltd. (7). Each image is 512 x 512 pixels in size. Images were annotated with keywords for the left and right eye to diagnose each of seven diagnostic criteria (Fig. 1). This reduced the number of images to 2,234 eye images. Retinal disease images were compared with a healthy fundus image for classification.
Convolutional Neural Network. For the purpose of our experiment of image classification, the ResNet (8) model was chosen. In a regular neural network each layer (a structure which takes input from previous layers and passes it on to other layers) directly feeds into the next, while in a ResNet model a layer feeds into the next and also a layer approximately 2-3 layers away. Skipping around 2-3 blocks helps prevent accuracy degradation. The ResNet models used in the experiments were ResNet 18, 34, 101, and 152. Each number was the number of layers in the model. The architecture of the ResNet model begins with a convolutional layer (7×7 kernel, with a stride of 2), followed by max pooling (3×3 kernel with a stride of 2), and a number of residual learning blocks which consistent of convolutional layers connected by shortcut connections. Residual networks are further explained in the manuscript by He et al., 2015 (8). The models were trained on a MacBook Air 2022 with an 8-core CPU and 10-core GPU M2 chip, with roughly 2,500 iterations of training taking 8 hours of runtime.
Cost Function. Supervised learning depends on optimizing models to minimize the cost function which measures model performance. The cost function used was cross entropy loss. The equation for cross entropy is
\[CE=-\sum_{1}^{M}{Observed\ast log(predicted)}\]
in which M is the number of output categories, observed is the actual value of the output category for the specific retinal image, and predicted is the values predicted by the machine learning model for the specific retinal image. The observed values of images are formatted such that a disease gets the value 1 if it is applicable to the image and 0 if it isn’t. The machine learning model’s predicted images are formatted through probabilities, in which each output category contains what percent chance the image has to be that specific disease. The resulting output of the cross entropy equation tells us how closely fitted the model is to the dataset. This is done in image batch sizes of 8.
Optimization Algorithms. Optimizing model performance depends on modifying parameters to minimize the cost function; the gradient descent algorithm iteratively updates each parameter using the slope of the cost function. The amount by which each parameter is updated is the learning rate. We utilized the Adam gradient descent algorithm (9). The equation for Adams gradient descent is
\[W_{t} = W_{t-1}-n\frac{m_t}{\sqrt{v_t}+\epsilon}\]
This is where m and v are moving averages, W is model weights, and n is the step size. The Adam optimizer updates each parameter by changing the learning rate, informed by previous cost function values.
How we reduced bias in the dataset: Weighting Categories. When classifying each disease individually, we compared two categories: normal fundus and the disease itself. The problem is that there are more normal fundus images than disease images, resulting in uneven batch sizes and a biased trained model. To fix this problem the proportion of images in each batch was weighted to be equal across both categories.
Performance metrics. Model performance was evaluated using the F1 score which combines precision and recall into a metric bounded between 0 and 1. Precision and recall are defined as
\[Precision\ =\ \frac{TP}{TP+FP}\] and \[Recall\ =\frac{TP}{TP+FN}\]…
\[F1 =\frac{2 \times precision \times recall}{precision + recall}\].
This is where TP is true positives and FN is false negatives. Model performance was evaluated during the training iterations using both training and validation data, although validation data was not utilized to optimize model parameters.
RESULTS.
Testing F1 performance of over 84% in distinguishing between cataract or pathological myopia and healthy retinal fundus. We compared the predictive performance of a residual network (ResNet) 18 model using a cross-entropy loss function trained with an Adam optimizer with a learning rate of 0.001 for each of seven retinal disease outcomes (Fig. 1). Data was randomly split into training and testing containing 80% and 20% of the images respectively with each iteration of training including a batch of eight images and a total of two epochs of training. F1 score was calculated from precision and recall (Methods) to assess model performance with a focus on testing performance as the best predictor of model generalization. ResNet 18 performance showed substantially better performance on cataracts and pathological myopia with an F1 score of 90.1% and 84.3% respectively (Table 1 and Figure 2), a 17.5% higher F1 score than predictive performance on the next highest disease category. This may be because of the drastic difference between normal fundus and these diseases, leading to easier classification.
| Table 1. Model performance on each of the seven retinal disease outcomes. | |||
| Sample # | Disease | Total Sample Size | Testing F1 Score |
| 1 | Cataract | 262 | 90.1% |
| 2 | Pathological Myopia | 227 | 84.3% |
| 3 | Dry Age-related Macular Degeneration | 196 | 66.8% |
| 4 | Severe Diabetic Retinopathy | 144 | 58.5% |
| 5 | Glaucoma | 200 | 54.8% |
| 6 | Moderate Diabetic Retinopathy | 745 | 44.8% |
| 7 | Mild Diabetic Retinopathy | 460 | 37.8% |
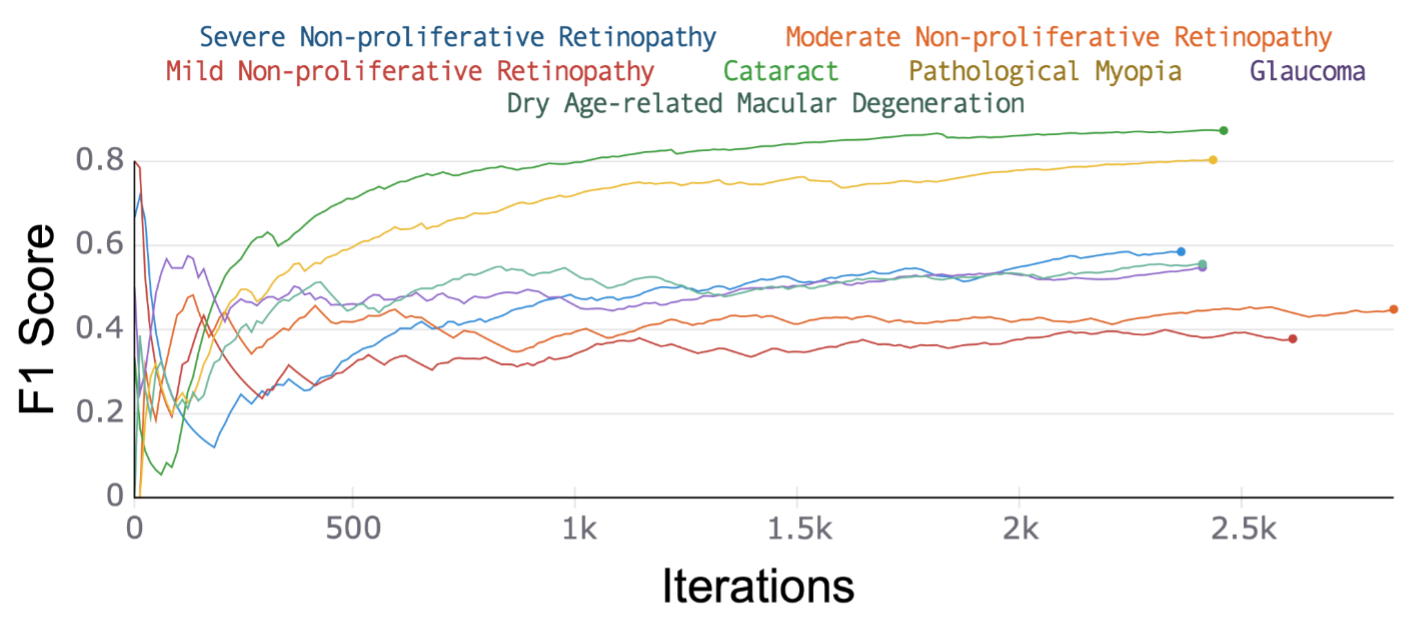
Figure 2. Trained model on each of the seven disease outcomes (described in Table 1) for the testing data. Measured F1-Score for every iteration of the testing process. The highest F1 score was for Cataract with 90.1% and second for pathological myopia with 84.3%.
Test F1 score of over 84% in distinguishing cataract or pathological myopia to healthy retinal fundus using ResNet 18 model (Table S1, Figure S1, and Figure S2). The two retinal diseases with the highest F1 score (Cataract and Pathological Myopia), previously, were chosen for the experiment of trying different models. The models used for this experiment were Resnet with 18 to 152 layers in the model. In all cases a cross-entropy loss function with Adam optimizer (learning rate = 0.001) was utilized.
Learning rate of 0.0001 resulted in over 10% improvement in testing F1 score with a performance of 94% (Table S2, Figure S3, Figure S4). The model used was the model found to be the best previously (ResNet 18) and the diseases remained the same.
Transfer learning resulted in a 2% decrease in testing F1 score for pathological myopia and a 2% increase in testing F1 score for cataract (Figure S5, and Figure S6). Transfer learning is the process of transferring the parameters that the model has after running one process, and using it in order to train the model for another process. In our case transfer learning was used for transferring the parameters that the model had after running for cataracts to train the model for pathological myopia and vice versa. The learning rate was changed to 0.0001 as informed by the previous experiment.
Diagnosis of pathological myopia and cataract simultaneously resulted in F1 scores of 94% and 86%, respectively (Figure S7, and Figure S8). Training multiple categories at the same time is when, instead of having only two outputs (normal fundus and the disease), the model can have three or more outputs (ex. Normal Fundus and two diseases). Having a model with the ability to be trained on multiple disease categories would make it so a patient wouldn’t have to go through multiple processes just to get a proper diagnosis.
DISCUSSION.
We performed an analysis of automated diagnosis across seven retinal diseases individually. Our study showed that convolutional neural networks most confidently diagnose cataracts and pathological myopia with testing F1 scores 96% and 94% respectively. Transferring knowledge by pre-training models on a related but distinct outcome lead to further improvements in performance from 94% to 96% testing F1 score in the diagnosis of cataract, without collecting further data. The standard approach of training on a disease outcome, one at a time, limits model application, therefore, we generated a modified model architecture that was able to diagnose cataract and pathological myopia retinal diseases simultaneously with F1 scores of 94% and 86%.
The findings from our experiments can help with two main things. First off, the findings from the experiment have helped leverage the fact that cataract and pathological myopia are two of the diseases best diagnosed by machine learning. This could lead to more potential studies being led on those two diseases which can in turn lead into more machine learning models being deployed in these two areas. Secondly, the findings from the experiments on different models and model parameters can help leverage which models are the best for diagnosing retinal diseases. By figuring this out, it can lead to future research being done on what makes these models better than others in diagnosing retinal diseases and can also lead to a better F1 score and accuracy when it comes to future endeavors.
Limitations and Future Work. A few improvements that could be done to my experiment would be increasing the number of retinal diseases, data points for each disease, and not using pre-trained models and adding augmentations to the data.
ACKNOWLEDGMENTS.
I would like to acknowledge Dr. P. Akbari for his advice and supervision.
SUPPORTING INFORMATION.
The supporting information section includes additional tables which display the results of experiments with model layers and learning rates. In addition to the tables, supplemental graphs are shown which show the results of experiments with model layers, learning rates, transfer learning, and training on multiple diseases at the same time.
REFERENCES.
- S. Dang, H. Pakhchanian, E. Flynn, R. Raiker, C. T. L. Khoo, D. Belyea, Estimating Patient Demand for Ophthalmologists in the United States using Google Trends. Invest. Ophthalmol. Vis. Sci. 62, 1724–1724 (2021).
- T.-Y. Heo, K. M. Kim, H. K. Min, S. M. Gu, J. H. Kim, J. Yun, J. K. Min, Development of a Deep-Learning-Based Artificial Intelligence Tool for Differential Diagnosis between Dry and Neovascular Age-Related Macular Degeneration. Diagnostics (Basel). 10, 261–271 (2020).
- G. T. Reddy, S. Bhattacharya, S. Siva Ramakrishnan, C. L. Chowdhary, S. Hakak, R. Kaluri, M. Praveen Kumar Reddy, “An Ensemble based Machine Learning model for Diabetic Retinopathy Classification” in 2020 International Conference on Emerging Trends in Information Technology and Engineering (ic-ETITE) (2020), 1–6.
- Z. Zhang, Y. Xu, J. Liu, D. W. K. Wong, C. K. Kwoh, S.-M. Saw, T. Y. Wong, Automatic diagnosis of pathological myopia from heterogeneous biomedical data. PLoS One. 8, e65736 (2013).
- S. J. Kim, K. J. Cho, S. Oh, Development of machine learning models for diagnosis of glaucoma. PLoS One. 12, e0177726 (2017).
- M. Caxinha, E. Velte, M. Santos, F. Perdigão, J. Amaro, M. Gomes, J. Santos, Automatic Cataract Classification based on Ultrasound Technique Using Machine Learning: A comparative Study. Phys. Procedia. 70, 1221–1224 (2015).
- N. Li, T. Li, C. Hu, K. Wang, H. Kang, A Benchmark of Ocular Disease Intelligent Recognition: One Shot for Multi-disease Detection. arXiv [cs.CV] (2021), (available at http://arxiv.org/abs/2102.07978).
- K. He, X. Zhang, S. Ren, J. Sun, Deep Residual Learning for Image Recognition. arXiv [cs.CV] (2015), (available at http://arxiv.org/abs/1512.03385).
- D. P. Kingma, J. Ba, Adam: A Method for Stochastic Optimization. arXiv [cs.LG] (2014), (available at http://arxiv.org/abs/1412.6980).

Posted by John Lee on Tuesday, May 30, 2023 in May 2023.
Tags: convolutional neural networks, healthcare, Machine learning