Analyzing the Spatial Organization of Tuberous Sclerosis Complex Tumor Cells Using Immunostaining and Computational Approaches
ABSTRACT
Tuberous Sclerosis Complex (TSC) is a genetic disease where benign tumors grow throughout the body. Different TSC tumor types, such as Tubers or Subependymal Giant Cell Astrocytomas (SEGAs) have aspects of tumor heterogeneity, such as with protein expression and cellular organization, that remain unknown. This lack of knowledge about tumor protein expression causes difficulties with diagnosis and treatment. To understand these characteristics, immunostaining of a patient SEGA sample was completed after verifying the accuracy of an antibody for immunostaining in TSC tumors, Pax6. Images of the stained tissues were then analyzed computationally through two software programs, CellProfiler and HistoCAT. Using the immunostaining imaging data from the SEGA sample of a wide panel of metal-tagged antibodies for 13 proteins known to be or suspected to be expressed in TSC tumors, an analysis pipeline was created to group each cell into clusters of similar protein expression and analyze the spatial organization of these clusters. Through these methods, it was determined that cells of similar protein expression in SEGA TSC tumors are organized together. In the future, analyzing more TSC tumor types using these methods and adding more proteins would provide a more complete analysis of the protein expression and cellular organization in TSC tumors.
INTRODUCTION.
The central dogma of molecular biology describes the transcription of DNA into RNA and RNA into protein [1]. Because of the connection between DNA sequence and protein formation, it may be expected that different cell phenotypes can be determined through studying genetics. However, genotype may not always accurately describe the protein product due to transcription errors and posttranscriptional protein modifications [2]. Measuring protein expression shows a different picture of the cells being studied than DNA or RNA because it helps to shows phenotypes expressed in cells.
Tuberous Sclerosis Complex (TSC) is a disease in which non-cancerous tumors form throughout the body [3]. Comparing the protein expression of these cells to non-TSC cells can help identify the proteins involved in tumor formation [4]. For example, if a protein commonly expressed in non-differentiated Neural Stem Cells (NSCs) in the brain is not expressed in TSC tumor cells, the phenotypes of NSCs and TSC tumor cells can be compared to determine differentiates cellular fate.
There are several different types of tumors that can form in patients with TSC, including Subependymal Giant Cell Astrocytomas (SEGAs) and Tubers [3]. These different tumors contain different types and organizations of cells and also display different protein expression, yet the specific proteins involved in these differences are unknown [3]. Because of this knowledge gap, identification of differing TSC tumors in patients is difficult and based on visual identification of cell characteristics [3].
Here, we aimed to determine the protein expression of a panel of proteins predicted to be differentially expressed between SEGA tumors and healthy cells. Proteins included the stem cell marker Nestin, the cell nucleus identifier Histone H3, and others. Expression profiles were determined via immunostaining with metal-tagged antibodies. HistoCat and CellProfiler analyses revealed the location and level of protein expression within TSC tumors. Additionally, we optimized an antibody for the Pax6 protein enabling future immunostaining and computational analysis. Pax6 is of interest because of its unknown expression in TSC tumors and because it has not yet been tested for the immunostaining of paraffin-fixed tissue sections [5]. These works elucidate our understanding or of protein expression profiles in TSCs and enable work to improve the accuracy of TSC tumor models. Improved models for TSC will aid in their diagnosis and improve treatments.
MATERIALS AND METHODS.
HistoCAT Analysis.
HistoCAT is a tissue image analysis software that uses pixel intensity values of proteins within images. SEGA images with the protein channels in Table 1 conjugated to heavy metal ions that had been previously obtained by the lab were analyzed and the minimum and maximum values for pixel intensity of each channel were set in order to reduce background signaling and overstaining as to obtain the most accurate data possible. Channels were first chosen based on criteria of expected expression. For example, Nestin is a cell membrane protein and would be expressed in differing locations of the cell than Histone H3, which is expressed in cell nuclei, so if these two channel images were visually similar, they would not be included in the protein analysis panel. Channels where then chosen by the amount of background staining by their metal ion tags (Table 1).
Table 1. List of Channels Chosen for Analysis
| Metal Ion Tab | Protein | Cell Type/Process ID |
| La(139) | Cyclin B1 | Mitosis Regulation [6] |
| Sm(149) | p-4E-BP1 | Cap-Dependent Translation [7] |
| Nd(150) | p-STAT5 | Cell Proliferation, Regulation, and Apoptosis [8] |
| Eu(151) | TTF-1 | Hypothalamus Morphogenesis [9] |
| Gd(158) | p-STAT3 | Transcription Activator, Growth Regulation [10] |
| Gd(160) | CD133 | Ependymal Cells, Primary Cilia of B1 Cells [11-15] |
| Dy(162) | c-MET | Receptor Tyrosine Kinase [16] |
| Dy(163) | SOX2 | Embryonic NSCs (radial cells), B1 Cells [17-19] |
| Er(168) | Nestin | Neuroepithelial Cells, Ependymal Cells, Radial Glia, Activated B1 Cells [20-23] |
| Tm(169) | CD44 | Astrocyte-Restricted Precursor Cells [24] |
| Yb(171) | p-ERK | Signal Transmission from Membrane Receptor [25] |
| Yb(172) | p-S6 | Ribosomal Transcription Protein [26] |
| Yb(176) | Histone H3 | Nucleus Identification [27] |
The nucleic channel, Histone H3 tagged by the Yb(176) metal ion, was uploaded into the CellProfiler image analysis software. A workflow was created on the software to identify nuclei based off an expected cell diameter and an expected difference in pixel intensity maximum in the nuclei to the pixel intensity minium in the space between the cell nuclei. By identifying cell nuclei, the image was segmented to identify each cell, excluding those deemed too large or small and those that were partial (on the edge of the image). Through this segmentation, a computational mask file of cell nuclei was created for use in HistoCAT.
The channels were imported into HistoCAT image analysis software along with the mask of cell nuclei. The HistoCAT software used the 13 different channels to create a tSNE plot to analyze how different cells, which were identified using the CellProfiler mask, were similar in protein expression. The HistoCAT software was also used to run a phenograph, which grouped the cells within the image into clusters that exhibited similar characteristics and protein expression. The clusters were then overlaid onto the original Histone H3 image to visualize how spatially similar cells within the same clusters are.
Pax6 Optimization.
Slides of non-tumor cell line Wild Type (WT) dorsal and ventral Neural Stem Cells (NSC) fixed in paraffin were baked at 55 ℃ for 30 minutes in a vertical coplin jar to remove any air bubbles. The slides were prepared to be stained with the Pax6 antibody, beginning with the antigen retrieval, in which two different buffers were tested, Trilogy and Citrate. Antigen retrieval allows proteins within a tissue sample to bind to their primary antibodies. Next, the slides were incubated with the primary antibody in a 1:50 concentration of the commercial antibody against the Pax6 protein, whereas the slides stained without a primary antibody were incubated using only blocking solution. After incubation in a humid chamber, the slides were rinsed and stained with Alexa 568 as a secondary antibody for Pax6 in a 1:1000 concentration and DAPI, to stain cell nuclei, in a 1:5000 concentration. After a second incubation period, the slides were rinsed and coverslipped, and were ready to be imaged.
The slides were imaged on the Vanderbilt CISR LSM 710 META Inverted Confocal microscope at a 20x magnitude. The images were then exported to the ZEN software, where pixel intensity was visualized using a color scale and histograms for pixel intensity were generated.
RESULTS.
The first question was which proteins were expressed in SEGA tumor cells, and how these cells were organized, approached using tSNE plots. tSNE plots are able to take high-dimensional data and reduce it onto two axes. tSNE plots provide an indication of which proteins are expressed in similar cells, where each cell is represented by one individual dot in the plot. When tSNEs are created, the closer two dots are to each other spatially, the more similar they are to each other in terms of protein expression, likely indicating similar cell types. A third dimension can be added to these plots using heat, where the heatmap is added to the same tSNE plot to depict the expression of one individual protein. Through this, 13 different depictions of the same tSNE plot of a resected patient SEGA sample demonstrating heat of 13 different proteins were generated, of which 2 are represented in Figure 2. The p4EBP1 and Cyclin B1 channels are distinct, with the tSNE plot for Cyclin B1 showing its highest protein expression in the cells in the left of the tSNE, while the p4EBP1 channel shows its maximum protein expression in the cells on the upper portion of the tSNE Plot (Figure 1).
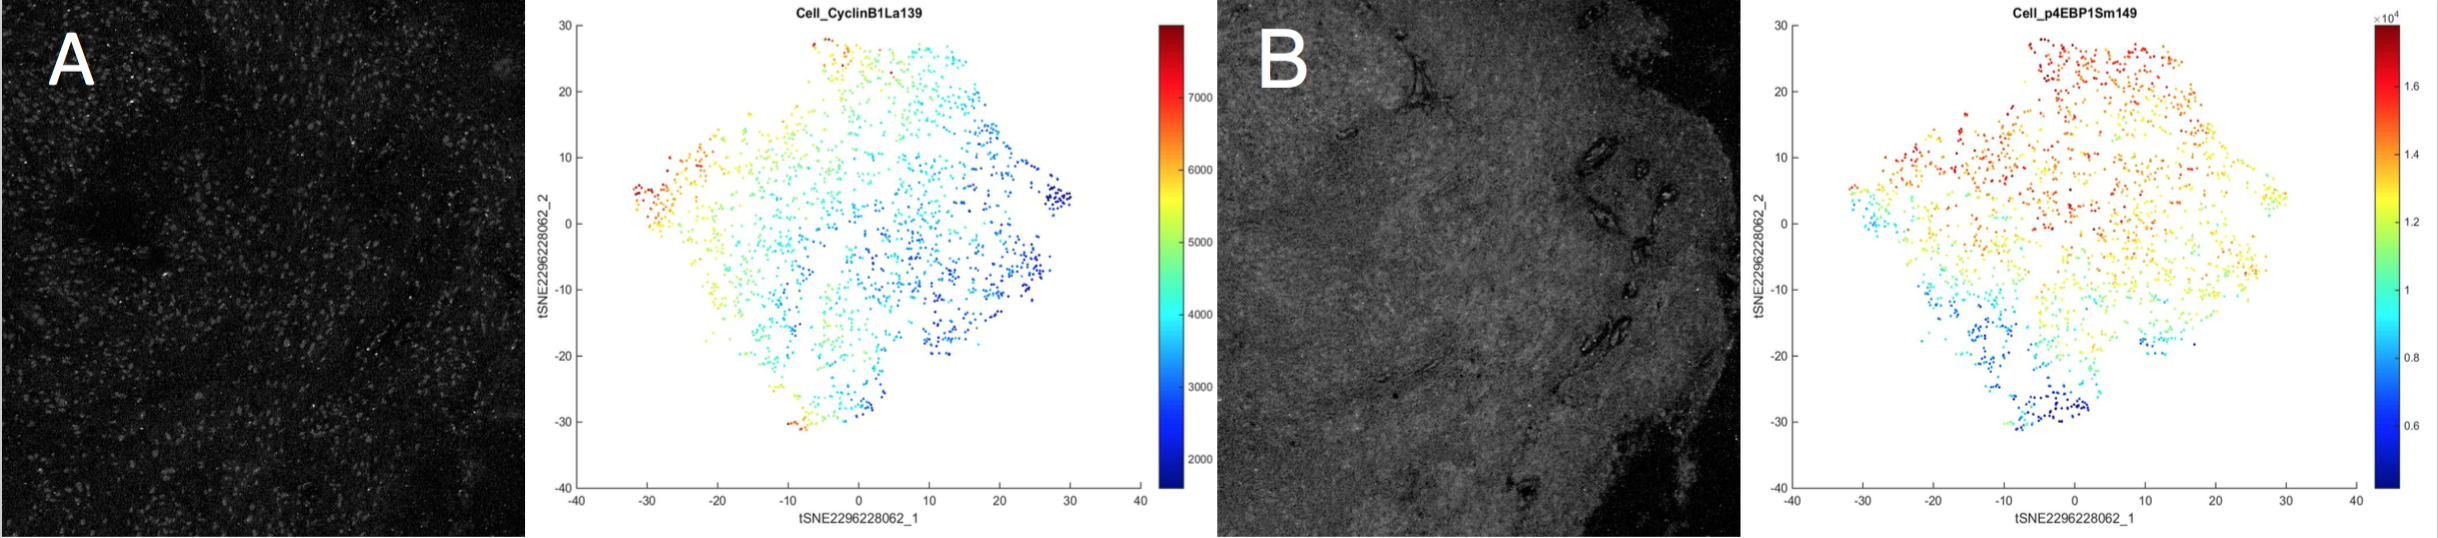
Figure 1. The Stained SEGA image for the Cyclin B1 Protein Channel and its corresponding stained SEGA imagetSNE plot. Each dot represents one cell, and the closer on the tSNE plot that two dots are to each other, the more similar those cells are to each other. The heatmap represents the intensity of Cyclin B1 expression in each cell.
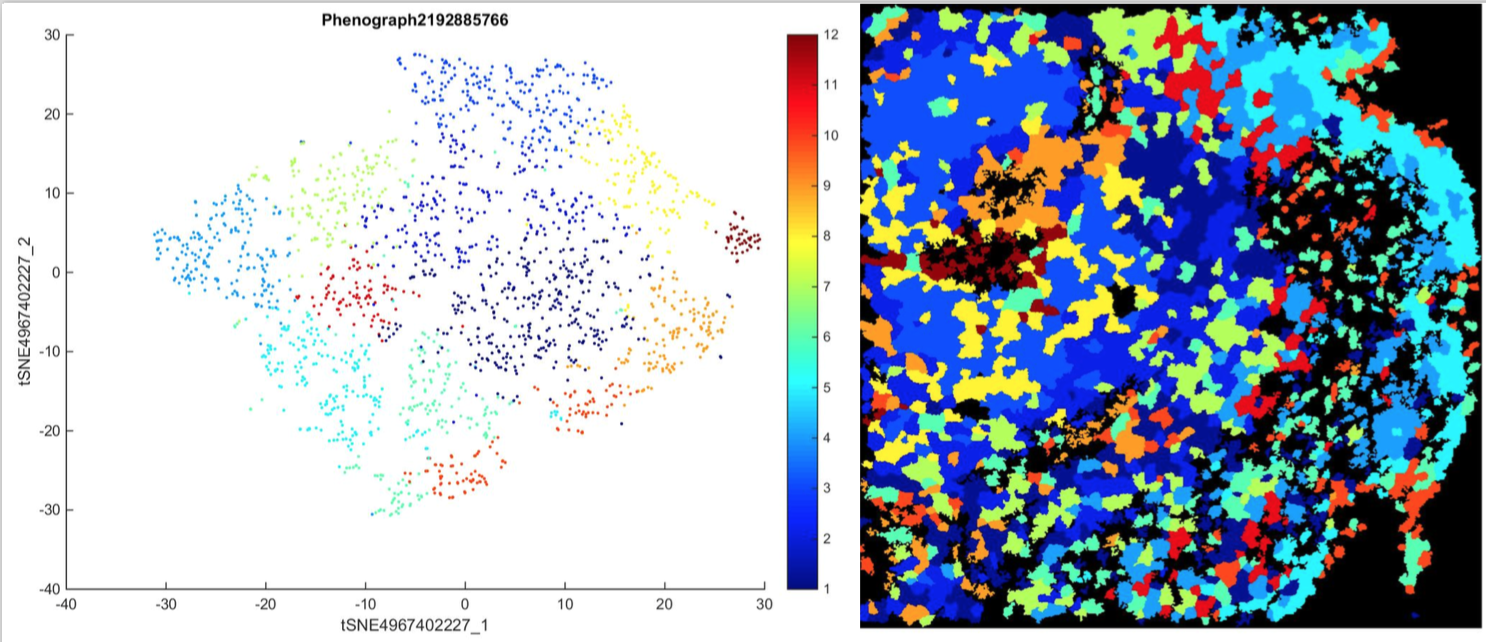
Figure 2. Cell Clusters on tSNE plot and original SEGA image. Each color represents a different cluster of cells, where cells within a cluster display similar protein expression.
The second question was how cells with similar protein expression were organized within a SEGA tumor sample. HistoCAT groups each cell into 13 different clusters that exhibit similar protein expression and are likely to be similar cells (Figure 2). Clusters in the tSNE plot are located closely together in space to demonstrate the similarities between the cells. In the upper left quadrant of the SEGA sample image, there are many cells overlaid with orange, meaning that many of the cells in this area of the tumor image were in the same cell cluster and therefore had similar protein expression. This suggests a non-random distribution of similar cells within the tumor sample.
The Pax6 antibody was tested using positive and negative controls and different buffers in order to determine the optimal procedure for staining paraffin-fixed tissues with the Pax6 antibody. In Figure 3, the upper row displays images taken of dNSCs, the positive control, and vNSCs, the negative control, stained for the Pax6 antibody using the Trilogy buffer for antigen retrieval. The dNSCs, for which approximately 25% of the cells were expected to be positive for Pax6, showed a higher pixel intensity than the negative control with the Trilogy Buffer. All of the negative control images of vNSCs displayed similar pixel intensity, which were similar in pixel intensity levels to the dNSC images taken without a primary antibody, showing the background signaling used to determine actual protein signaling in the cells. When comparing the dNSC images using the Trilogy and Citrate buffers, the image taken using Trilogy shows higher pixel intensity, which is most similar to the expected protein expression.
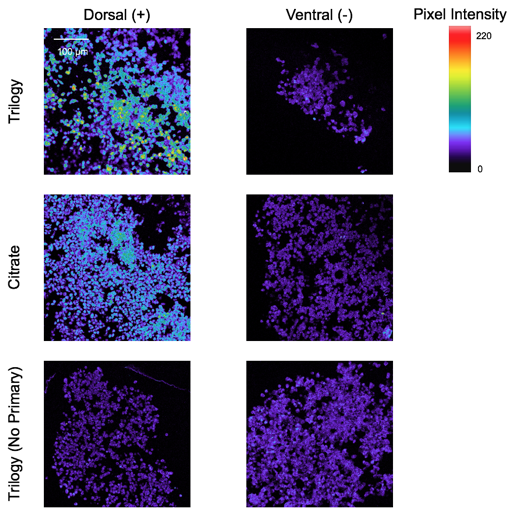
Figure 3. Cell Clusters on tSNE plot and original SEGA image. Each color represents a different cluster of cells, where cells within a cluster display similar protein expression.
DISCUSSION.
Before the Pax6 antibody could be used to stain and analyze its expression in tissue samples, its optimal conditions had to be determined (Figure 3). These conditions included using a Trilogy buffer in antigen retrieval, and using dNSCS and vNSCs as positive and negative controls for Pax6. These conditions produced confocal microscopy images where there was the greatest contrast between the positively stained dNSCs and the negatively stained vNSCs as compared to those obtained using other antigen retrieval methods and other positive and negative tissues for controls (Figure 2). A future direction of this experiment includes determining the optimal concentration of the primary Pax6 antibody when staining paraffin-fixed tissue samples so that the background signaling in images can be reduced and the microscopy images will better reflect the actual protein expression in tissue samples. Additionally, the optimization of the Pax6 antibody will enable its use in analysis using HistoCAT software, a useful application because TSC tumors may display irregular expression of Pax6 [5].
The computational analysis of the SEGA sample using HistoCAT software determined the protein expression of the cells and which cells within the sample displayed similar protein expression (Figure 1). These cells, which were grouped into clusters by HistoCAT showed similar characteristics and were also likely to be similar types of cells (Figure 2). Furthermore, when these clusters were overlaid onto the original image of the SEGA sample, the organization of these similar cells was determined as non-random (Figure 2). This knowledge of tumor cell expression and organization allows for more beneficial treatments of these tumors by targeting proteins specific to these tumors. For example, inhibiting mTOR protein expression in SEGA tumors decreased tumor volume significantly [28]. This therapy is possible when the protein expression is known.
Another possible application of this method of analysis is to use protein expression and cellular organization to learn about the influence of TSC tumor cells on their environment. Patient treatment of TSC tumors could be helped by learning whether cells within a TSC tumor change the function and characteristics of nearby non-tumor cells, especially in cases where the tumor is being resected surgically. Understanding if the non-tumor cells surrounding the tumor are part of the tumor environment will affect how large of a tumor resection is performed on the patient.
A possible source of error from this computational analysis may have originated from the conclusions drawn from one singular image of a SEGA tumor sample. This can be addressed by comparing the results of this analysis to an analysis of multiple SEGA tumor sample images in order to reduce variation and random error and adding a negative control. Also, to learn about the different expression and organization within different TSC tumor types, the HistoCAT analysis should be completed on several different TSC tumor samples.
The results of these experiments shed light on the protein expression of SEGAs, along with their organization of different proteins. The specific protein expression of TSC tumors isn’t known, and this preliminary data on a SEGA sample provides the basis for further research on more SEGA protein analysis as well as comparison with analysis of other TSC tumors, helping with the understanding of TSC and therefore its diagnosis and treatment.
ACKNOWLEDGMENTS.
I would like to acknowledge the Ihrie Lab Members and the School for Science and Math at Vanderbilt. The funding sources are NIH R01 NS096238-01, DOD/CDMRP W81XWH-16-1-0171, and the Tuberous Sclerosis Alliance.
REFERENCES
- Crick, Central Dogma of Molecular Biology. Nature, 227, 561-563 (1970).
- Dermit, Methods for monitoring and measurement of protein translation in time and space. Molecular Biosystems, 13, 2477–2488 (2017).
- Carapetian Randle, Tuberous Sclerosis Complex: A Review. Pediatric Annals, 46, e166-e171 (2017).
- Lang, R. A. Prayson, Tuberous Sclerosis Complex Coexistent with Hippocampal Sclerosis. Journal of Clinical Neuroscience, 24, 28-29 (2016).
- Li, Abnormal Neural Progenitor Cells Differentiated from Induced Pluripotent Stem Cells Partially Mimicked Development of TSC2 Neurological Abnormalities. Stem Cell Reports, 8, 883-893 (2017).
- CCNB1 Cyclin B1 [Homo sapiens (human)], National Center for Biotechnology Information, (2019).
- Villalonga, RhoE Inhibits 4E-BP1 Phosphorylation and eIF4E Function Impairing Cap-dependent Translation, The Journal of Biological Chemistry, 284, 35287-35286 (2009).
- Nosaka, STAT5 as a molecular regulator of proliferation, differentiation, and apoptosis in hematopoietic cells, The EMBO Journal, 18, 4754-4765 (1999).
- Lee, TTF-1, a Homeodomain Gene Required for Diencephalic Morphogenesis, Is Postnatally Expressed in the Neuroendocrine Brain in a Developmentally Regulated and Cell-Specific Fashion, Molecular and Cellular Neuroscience, 17, 107-126 (2001).
- Kusaba, Expression of p-STAT3 in human colorectal adenocarcinoma and adenoma; correlation with clinicopathological factors, Journal of Clinical Pathology, 58, 833-838 (2005).
- Coskun, CD133 + neural stem cells in the ependyma of mammalian postnatal forebrain, Proceedings of the National Academy of Sciences, 105, 1026–1031 (2008).
- Uchida, Direct isolation of human central nervous system stem cells, Proceedings of the National Academy of Sciences, 97, 14720–14725 (2000).
- M. Marzesco, Release of extracellular membrane particles carrying the stem cell marker prominin-1 (CD133) from neural progenitors and other epithelial cells, Journal of Cell Science. 118, 2849–2858 (2005).
- Pinto, Prospective isolation of functionally distinct radial glial subtypes—lineage and transcriptome analysis, Molecular and Cellular Neurosciences, 38, 15–42 (2008).
- Beckervordersandforth, In vivo fate mapping and expression analysis reveals molecular hallmarks of prospectively isolated adult neural stem cells, Cell Stem Cell, 7, 744–758 (2011).
- C. Ma, c-Met: Structure, functions and potential for therapeutic inhibition, Cancer and Metastasis Reviews, 22, 309-325 (2003).
- V. Zappone, Sox2 regulatory sequences direct expression of a (beta)-geo transgene to telencephalic neural stem cells and precursors of the mouse embryo, revealing regionalization of gene expression in CNS stem cells, Development, 127, 2367–2382 (2000).
- Ellis, SOX2, a persistent marker for multipotential neural stem cells derived from embryonic stem cells, the embryo or the adult, Developmental Neuroscience, 26, 148–165 (2004).
- L. Ferri, Sox2 deficiency causes neurodegeneration and impaired neurogenesis in the adult mouse brain, Development, 131, pp. 3805–3819 (2004).
- Lendahl, CNS stem cells express a new class of intermediate filament protein, Cell, 60, 585-595 (1990).
- Doetsch, Cellular composition and three-dimensional organization of the subventricular germinal zone in the adult mammalian brain, Journal of Neuroscience, 17, 5046–5061 (1997).
- Hockfield, R. D. McKay, Identification of major cell classes in the developing mammalian nervous system, Journal of Neuroscience, 5, 3310–3328 (1985).
- Codega, Prospective identification and purification of quiescent adult neural stem cells from their in vivo niche, Neuron, 82, 545–559 (2014).
- Liu, CD44 expression identifies astrocyte-restricted precursor cells, Developmental Biology, 276, 31–46 (2004).
- Ge, Identification and Functional Characterization of ERK/MAPK Phosphorylation Sites in the Runx2 Transcription Factor, Journal of Biological Chemistry, 284, 32533-32543 (2009).
- H. Iwenofu, Phospho-S6 ribosomal protein: a potential new predictive sarcoma marker for targeted mTOR therapy, Nature, 21, 231-237 (2007).
- H3-4 H3.4 histone [ Homo sapiens (human)], National Center for Biotechnology Information (2019).
- Jung, The Clinical Characteristics of Subependymal Giant Cell Astrocytoma: Five Cases, Brain Tumor Research and Treatment, 3, 44-47 (2015).
Posted by John Lee on Wednesday, December 23, 2020 in May 2020.
Tags: HistoCAT, Pax6., Tuberous Sclerosis Complex