Analyzing homozygous loss of TSC2 mutants in human iPSC-derived neural spheres.
ABSTRACT
Tuberous sclerosis complex (TSC) is an autosomal dominant genetic condition caused by loss of function of the TSC1 or TSC2 genes, with many phenotypic presentations not limited to cutaneous lesions, tumor growth on organs, and comorbid neurological disorders such as autism and epilepsy. The TSC1/2 complex acts as an important regulator of the major mTORC1 pathway, responsible for cell growth and metabolism, with overactivation linked to cancer and metabolism issues. Previous findings indicate that induced pluripotent stem cells (iPSCs) with TSC2 mutations exhibit unique qualities during reprogramming into neurons, therefore encouraging investigation into what distinguishes TSC2 genotypes during neural development. Human iPSC-derived neural rosettes, important precursors to embryonic neural development, were used to model TSC2 homozygous knockout and wild type phenotypes. In measuring the area of TSC2 knockout or wild-type neural rosette spheres, it was determined that vehicle TSC2 knockout neural spheres had greater sphere area and decreased circularity. Such differences indicate impaired size regulation due to mTORC1 overactivation. In understanding the mechanism of TSC, the mechanism of tuberous sclerosis development can be better understood and help inform treatments for TSC patients.
INTRODUCTION.
The intricacies of the mechanisms of various disorders still elude modern medical science, such as tuberous sclerosis which has been officially classified for over 150 years. Tuberous sclerosis complex (TSC) is a complicated genetic disorder caused by the mutation of the TSC1 or TSC2 genes which code for proteins hamartin and tuberin, respectively. It is dominantly inherited and has many phenotypic manifestations which include skin lesions in addition to tumor growth on organs, such as hamartomas, small marble-like tumors. These symptoms often result in renal or neurological dysfunction. Autism spectrum disorder occurs in 25% to 50% TSC patients, while other neurological disorders such as epilepsy and other behavioral disorders are also common [1]. However, since TSC has so many phenotypic variations it can be difficult to diagnose. Despite the fact that TSC has been recognized as a disorder for 126 years, it is relatively under-researched, but understanding the mechanisms of TSC can serve as a template in researching many developmental diseases. The TSC1 and TSC2 genes form a complex and act as important upstream regulators of the cytosolic mTORC1 pathway [Figure S1]. In this pathway, mTOR itself promotes growth and cell division by signaling RNA division and the mTOR complex regulates kinases such as S6, which regulates RNA translation. Overactivation of the mTORC1 pathway can lead to acceleration of cancer, metabolism and aging. Due to mTORC1 initiating many growth factor pathways, it is critical to embryonic development, so mutation of the TSC1 or TSC2 genes leads to accelerated cellular division, essentially creating tumors [3]. The critical role of the mTORC1 pathway illustrates the importance of understanding the overarching behavior of the TSC gene complex.
Previous findings indicate that TSC2 heterozygous mutants derived from patient fibroblasts had increased p53 signaling and this altered reprogramming when growing iPSCs [4]. The observed behavior of TSC patient samples supports investigating why TSC mutants lead to different embryonic development and eventually the disorder.
Neural rosettes derived from embryonic stem cells resemble the later neural plate stages of neural development, and are maintained by two other pathways, the SHH and Notch pathways, both critical to development [5]. In creating iPSC-derived neural rosettes, the developmental effects of mutated TSC2 genes can be better observed. Rosettes themselves have five distinct developmental stages from day five to day nine of growth, with lumens forming around day 8, characterized by the localization of ZO-1, PARD3, and β-Catenin, which can be stained and viewed [6]. Therefore, any differences in development between mutant TSC2 and wild type samples may be observed in an effort to discern its pathological mechanism. TSC2 function was observed by comparing wild-type TSC2 with homozygous knockout TSC2 samples. Preliminary data indicated that TSC2 knockout samples, when grown into rosettes had a significantly larger rosette sphere areas compared to WT and TSC2 +/- models. However, small sample sizes require further verification. Further qualitative observations between WT and TSC2 knockout rosettes show a difference in organization. The goal of this study was to observe and quantify differences in different TSC2 rosettes to determine potential mechanisms for developmental differences, such as a loss of organization or impaired growth in mutated samples. Ultimately, this ties into investigating how TSC forms and leads to a better understanding of TSC pathogenesis which should lead to reduced morbidity and improved developmental outcomes.
MATERIALS AND METHODS.
Generating iPSCs
Human tissue samples were used in order to compare TSC2 mutant cell lines to wild-type ones. In order to compare these genotypes, prior to the beginning of this project, human fibroblast samples were reprogrammed into induced pluripotent stem cells (iPSCs). iPSCs are extremely versatile since they can be made to reprogram into almost any specialized cell, which for this study’s purposes are early neural cells aggregate together to form neural rosettes. Patient and WT fibroblast samples were reprogrammed into neural iPSCs by transfection with episomal plasmids that contain reprogramming genes such as OCT4. A control line of iPSCs was used to generate isogenic lines of the TSC2 homozygous knockout mutation and wild-type, made by another lab member previously using CRISPR techniques. Once they were induced into stem cells, the genotype remained. To grow these isogenic iPSCs, they were cultured on Matrigel plates with DMEM F-12 media and split regularly to prevent high confluence. Since neural rosettes form lumens around day 8 of growth, cells were generated into neural spheres for growth.
Neural Rosette Generation
In order to form neural rosettes from iPSCs, iPSCs were grown on special wells called AggreWells, well with grids on the bottom, with each individual grid square forming a pyramid, to cause cells to grow and aggregate into a sphere and form the circular structures tangential to rosette formation. iPSCs were maintained in AggreWells for 5 days with Neural Induction Medium, with one group of WT and KO treated with 2nM of Rapamycin, and the other with vehicle treatment. iPSC neural spheres were transferred on day 5 to two 96-well plates and grown until day 8 before being fixed. The iPSCs were stained using standard technique comprised of washing with PBS, fixing in 4% paraformaldehyde, rinsing, permeabilizing with 0.1% Triton in PBS, and blocking samples with 0.1% Triton and 2.5 % normal goat serum, a substance comprised of sticky antibodies to ensure stain specificity. Spheres were stained with green mouse monoclonal ZO-1, a tight junction protein on the peripheral membrane, and red rabbit polyclonal β-Catenin, a widely expressed protein in tissues involved in cell-cell adhesion and gene transcription, for imaging.
To determine the influence of the mTORC1 pathway on neural spheres, unstained samples of TSC2 KO Vehicle and TSC2 KO Rapamycin were compared using a western blot. Samples were mixed with 2X Laemmli buffer and denatured at 80C for 15 minutes. These samples were then loaded into a 4-12% Bis-Tris NuPage gel and run at 200 V for 60 minutes. This gel was then placed onto filter paper soaked with transfer buffer. This was placed into a sandwich of a sponge, filter paper, gel, filter paper, and a second sponge placed into a box. This sandwich was placed into a transfer bucket filled with transfer buffer. This was run at 95 V for 60 minutes. Then the membrane was cut to the gel outline and removed from the transfer and washed twice for ten minutes in TBS after.
Analysis
Stained neural spheres were individually imaged on an EVOS Auto FL2 Cell Imaging System, a bright-field light microscope, at 10x magnification. These composite images were analyzed for area and circularity, markers of neural rosette development, in ImageJ, a public image analysis tool. Quantitative readings of area and circularity from ImageJ were further organized in Excel. To ensure precise area calculation, EVOS images were inverted and thresholded using ImageJ, therefore allowing the program to calculate area by only measuring black pixels. The area was calculated as the number of black pixels in microns squared, while circularity was a measure of how closely a shape resembles a circle, a marker of neural rosette organization. A one-way ANOVA was performed between all four groups to determine significance. Western blots were quantified using ImageStudio Lite, a program specifically designed for western blot quantification.
RESULTS.
Neural rosette spheres of all sample groups – Wild-type vehicle, TSC2 Knockout vehicle, Wild-type treated with Rapamycin, and Knockout with Rapamycin – were able to be imaged on an EVOS light microscope and subsequently converted to black pixels in ImageJ. . In treating samples with rapamycin, an mTORC1 inhibitor, it could be deduced if mTORC1 was the pathway responsible for observed phenotypes Each sample group had N ≥ 50 spheres imaged, measured for area and circularity in ImageJ [Figure 1]. Area of each neural sphere was taken in microns squared. TSC2 KO Spheres demonstrate significantly larger area (P < 0.001) in comparison to all other sample groups. WT Vehicle samples had no significant difference in area between both the WT and TSC2 KO Rapamycin treated groups [Figure 2]. Circularity of neural spheres were additionally quantified, evaluated by how accurately the edges of each sphere fit a perfect circle with a value of 1.0 indicating a perfect circle, and increasingly elongated shapes approaching 0.0. TSC2 KO Vehicle spheres were significantly less circular (P = 0.0002) than WT Vehicle spheres. WT Vehicle spheres had no significant difference in circularity compared to both the WT and TSC2 KO Rapamycin treated groups [Figure 3]. In both area and circularity, the TSC2 KO Vehicle sample group was significantly different from the other experimental groups, with larger areas and less circular edges. To evaluate the effect of Rapamycin treatment on TSC2 KO samples, levels of phosphorylated-S6 were quantified using a western blot, indicating relative levels of protein pS6 and β-actin in TSC2 KO Vehicle and TSC2 KO Rapamycin samples. Use of a western blot for ps-6 levels confirmed that the mTORC1 pathway is involved in the observed differences due to no significance between the WT Vehicle and KO Rapa sample groups. Representative immunoblotting showed greater pS6 levels in the TSC2 KO Vehicle sample, while Rapamycin caused a greater than 95% reduction in pS6 signal intensity in the TSC2 KO Rapamycin group [Figure S2]. Therefore, the TSC2 KO Vehicle group exhibited greater area, less circularity, and higher levels of mTORC1 signaling due to elevated levels of pS6 in comparison to the TSC2 KO Rapamycin treated sample. The WT Vehicle, WT Rapamycin, and TSC2 KO Rapamycin groups remained mostly insignificant in area and circularity in comparison to each other, but were all significantly different when compared to the TSC2 KO Vehicle group.
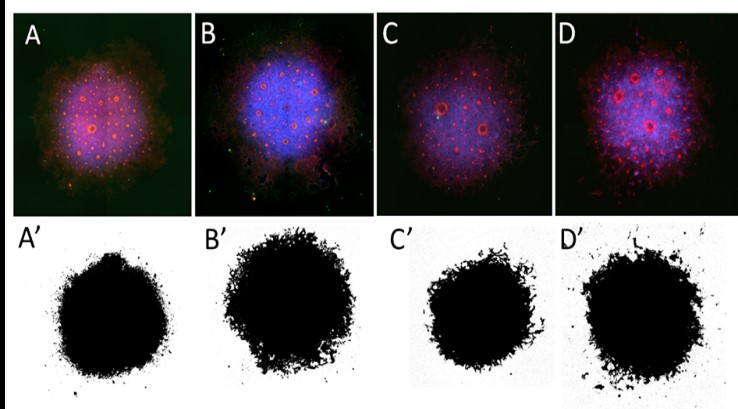
Figure 1. Neural rosette sphere generation and characteristics measured of different sample groups. Top row: EVOS images of Day 8 Neural spheres from all sample groups were stained with ZO-1 (red) and β-Catenin (green), in addition to nuclear staining with Hoechst (blue). [A] Wild-type Vehicle [B] TSC2 Knockout Vehicle [C] Wild-type Rapamycin treated [D] Knockout Rapamycin. Bottom row: Threshold images of corresponding spheres representing how the entire surface area of imaged spheres was converted to quantifiable pixels.
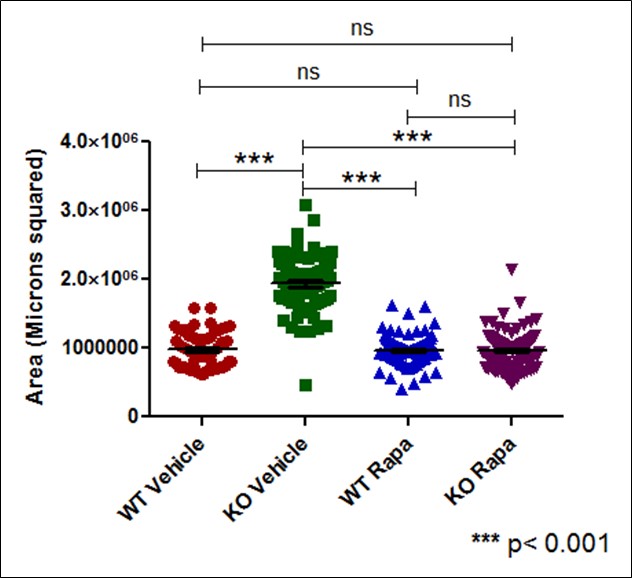
Figure 2. Effect of TSC2 knockout and rapamycin treatment on neural sphere area. ImageJ Area measurements of neural spheres in microns squared. (n = greater than or equal to 50 per sample group). TSC2 KO Spheres demonstrate significantly larger area in comparison to all other sample groups. WT Vehicle samples had no significant difference in area between both Rapamycin treated groups.
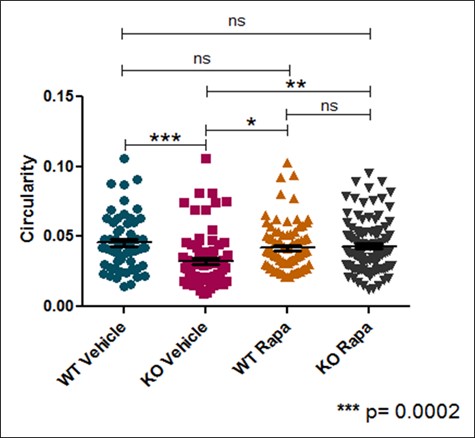
Figure 3. Effects of TSC2 knockout or rapamycin treatment on neural sphere circularity. Circularity of each neural sphere was measured in addition to area (n = greater than or equal to 50 per sample group). A value of 1.0 indicates a perfect circle, with increasingly elongated shapes approaching 0.0. TSC2 KO Vehicle spheres are significantly less circular than WT Vehicle spheres. WT Vehicle spheres had no significant difference in circularity compared to both Rapamycin treated groups.
DISCUSSION.
TSC2 KO Vehicle spheres had a significantly larger area compared to wild-type vehicle samples. Increased sphere area of TSC2 KO Vehicle samples may indicate an increased amount of cell division, with more cells aggregating to form larger spheres than TSC2 wild-type neural spheres. Previous studies on directed differentiation of TSC2 mutant stem cells show increased levels of p53 in TSC2 mutants [1]. Therefore, increased neural sphere area of TSC2 KO samples as seen in Figure 3 is likely due to the overactivated mTORC1 pathway increasing levels of p53. Increased sphere area could also be an indication of cell migration, with KO cells moving outwards more from the center of neural spheres than wild-type. Since neural rosettes have distinct structure and morphological stages, significant decreased circularity of the TSC2 KO Vehicle samples in comparison to wild-type in Figure 4 signifies a loss of organization due to deregulation of mTORC1 from TSC2 knockout [2]. Rapamycin treatment reversed the effects of TSC2 knockout, shown by the lack of significance in both area and circularity between WT Vehicle and TSC2 KO Rapa spheres. The 195% increase of pS6 expression in TSC2 KO Vehicle samples compared to TSC2 KO Rapamycin samples in Figure 5 indicates an overactivation of the mTORC1 pathway. Therefore, the overactivation of the mTORC1 pathway is indicative of the phenotypical differences between TSC2 KO and wild-type neural spheres.
CONCLUSION.
A significant difference was found between the relative areas of WT and TSC2 KO iPSC-derived neural spheres due to the overactivation of the mTORC1 pathway in TSC2 homozygous knockout mutants. Similarly, a difference in relative circularity between WT and TSC2 KO neural spheres also due to TSC2 knockout and mTORC1 overactivation was demonstrated. For future directions, identifying the cause initiating greater area and disorganization of TSC2 KO neural spheres can be evaluated via western blot for apoptotic caspases such as caspase 3 or assays for indication of cell migration. The role of caspases or other proteins should be investigated in how they generate seen developmental differences between wild-type and TSC2 knockout neural spheres. Utilizing flow cytometry to compare individual cell sizes should also be performed to observe if TSC2 KO neural spheres are larger due to having physically larger cells. In observing phenotypic differences between mutant and wild-type neuronal precursors, the pathology of tuberous sclerosis is better understood which further helps direct efforts into determining what mechanism in TS patients causes these differences.
ACKNOWLEDGMENTS.
I would like to acknowledge the Ess lab for the opportunity to conduct this research, the School for Science and Math at Vanderbilt, Eric Donahue for previous research insight, and Laura Armstrong for the iPSC cell line.
SUPPORTING INFORMATION.
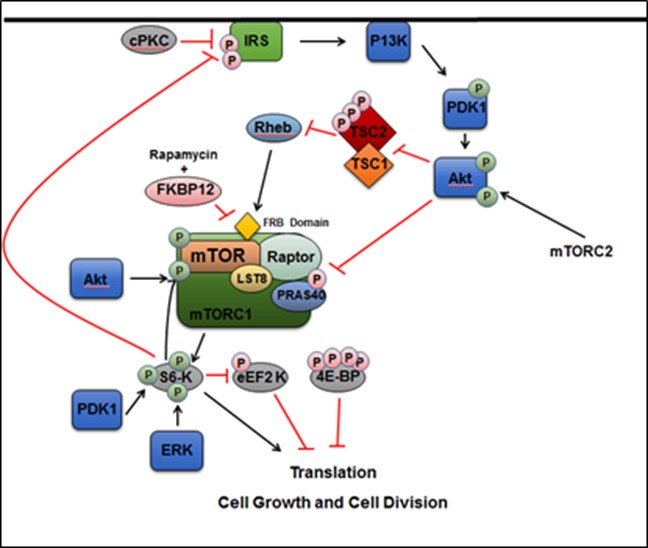
Figure S1. The TSC1/2 complex and its interaction with the mTORC1 pathway and downstream components in the cytosol.
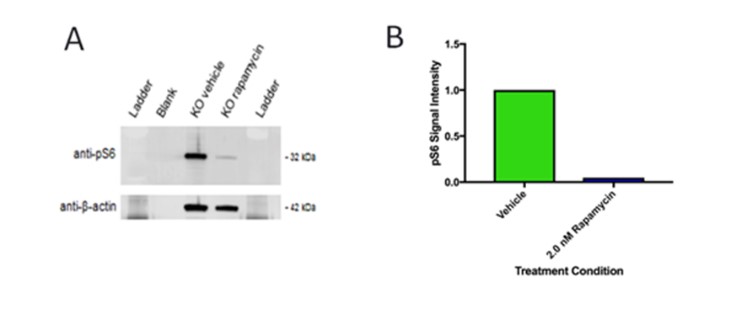
Figure S2. Effect of Rapamycin on pS6 levels in TSC2 KO neural spheres.
REFERENCES.
- E. Roach, Applying lessons of tuberous sclerosis: the 2015 Hower Award Lecture. Pediatric Neurology 63, 6-22 (2016).
- C. Hoeffer, E. Klann, mTOR signaling: at the crossroads of plasticity, memory and disease. Cell Press 33, 67-75 (2010).
- R. Zoncu, A.Efeyan, D.M. Sabatini, mTOR: from growth signal integration to cancer, diabetes, and aging. Nature Reviews Molecular Cell Biology 12, 21–35 (2011).
- L.C. Armstrong, G.Westlake, J.P Snow, B. Cawthorn, E. Armour, A.B. Bowman, K.C. Ess, Heterozygous loss of TSC2 alters p53 signaling and human stem cells reprogramming. Human Molecular Genetics 26, 4629-4641 (2017).
- Y.Elkabetz, G. Panagiotakos,G. Al Shamy, N. D. Socci, V.Tabar, L. Studer, Human ES cell-derived neural rosettes reveal a functionally distinct early neural stem cell stage. Genes Dev 22, 152-165 (2008).
- H.Hribkova, M. Grabiec, D. Klemová, I. Slaninová, Y. Sun, Calcium signaling mediates five types of morphological changes to form neural rosettes. Journal of Cell Science 131, 29361526 (2018).
Posted by John Lee on Tuesday, December 22, 2020 in May 2019.
Tags: Neurology, stem cell, tuberous sclerosis