An Assessment of Diel Patterns in the East Fork Creek, Franklin, TN
ABSTRACT
Diel water quality patterns provide critical information for analyzing the biochemical conditions of water sources. In particular, stream metabolism, including gross primary production (GPP) and ecosystem respiration (ER), are key metrics for assessing the water quality conditions of streams. This study continuously collected diel cycle data from the East Fork Creek every 10 minutes over eight days in June and July 2022 using an EXO2 sensor that was placed in the creek. Then, stream metabolism was estimated using a Bayesian analysis program called BASEmetab. The data shows pH and dissolved oxygen readings in the range of 7.51-8.45 and 5.3-11.4 mg/L, respectively, which reflects a healthy system when compared to previous studies. The GPP and ER were used to calculate the Net Ecosystem Production (NEP), which was negative, characterizing the creek as heterotrophic and needing carbon from an external source. However, there was a significant difference in the NEP values between June and July collection dates (p-value = 0.0433). Although these results were expected, this study can be used as a reference for future research of ecosystems with a greater anthropogenic impact placed upon them, providing diel cycle assessments to measure stream health.
INTRODUCTION.
Although healthy freshwater ecosystems are vital for human survival, these water bodies have been poorly managed and polluted by human activity as water demands have increased [1,2]. As a result, it is of utmost importance to characterize the health of these water sources to properly design measures to improve water quality and prevent further degradation. In particular, stream metabolism can be considered a key metric to assess the water quality condition of a stream since it describes the fluctuation of carbon within a stream [3,4,5]. Stream metabolism is estimated through the gross primary production (GPP) and ecosystem respiration (ER), reflecting the organic matter, and other energy, cycling within a stream. GPP and ER cannot be measured directly, but are estimated using measurements of dissolved oxygen, temperature, light intensity, atmospheric pressure, and salinity [6].
Measurements are typically taken annually, monthly, weekly, or daily. However, measuring on a subdaily scale to measure diel cycles can show additional important information. Diel cycles show variations in data at a much finer level than typical measurements. This precision is useful because large diel variability can significantly affect long-term water quality modeling. Long-term water quality monitoring programs help us understand both stream health and the effectiveness of management actions. Therefore, it is key to understand small-scale changes within the diel cycle of a stream.
The objective of this study is to characterize the stream metabolism at the East Fork Creek, located southwest of Nashville, Tennessee, within the Harpeth River Watershed. To this end, the diel cycles of dissolved oxygen, temperature, light intensity, atmospheric pressure, and salinity were evaluated to later estimate the GPP and ER, using a Bayesian framework implemented in the BASEmetab package software. The East Fork Creek was chosen because it is located in a secluded area on private property where the equipment would not be disturbed. Due to its secluded location, it can be hypothesized that the water parameter data will indicate that East Fork Creek is a healthy water source.
MATERIALS AND METHODS.
Study Site. The research aimed to assess diel cycles within the East Fork Creek, located southwest of Nashville, Tennessee, within the Harpeth River watershed, with coordinates 35.9515437 N, -87.0156281 E. The East Fork Creek is a small branch of the Harpeth River that has previously been shown to have insignificant levels of pollution, although it has small-scale agriculture nearby [7]. The collection site has little to no canopy cover and therefore easily receives sunlight. The site is also immediately next to a private road, Big East Fork Road. Approximately 1 mile upstream of the sampling site is a small man-made lake. The study site has been classified as mainly composed of Linside cherty silt loam [7].
Data Collection. Data was collected from June 3-8 and July 1-6, 2022, from a point close to the Big East Fork Road (Figure 1, S1 S2). Dissolved oxygen, temperature, depth, salinity, and pressure were measured with an EXO2 sensor that was placed in the water, near the riverbank, and secured using rope and cable to rocks and a large tree branch on the bank (Figure S3). The depth of placement of the sensor was approximately 0.28 m. Data was continuously collected every 10 minutes on all dates, beginning at ~11:00am on the first day and ending around ~10:00am on the last day. Irradiance was measured every 10 minutes using the HOBO Pendant MX Temperature/Light Data Logger located in the water at a similar depth and placed in close proximity to the EXO sonde. After the data was collected, it was downloaded to the computer from the sensors.
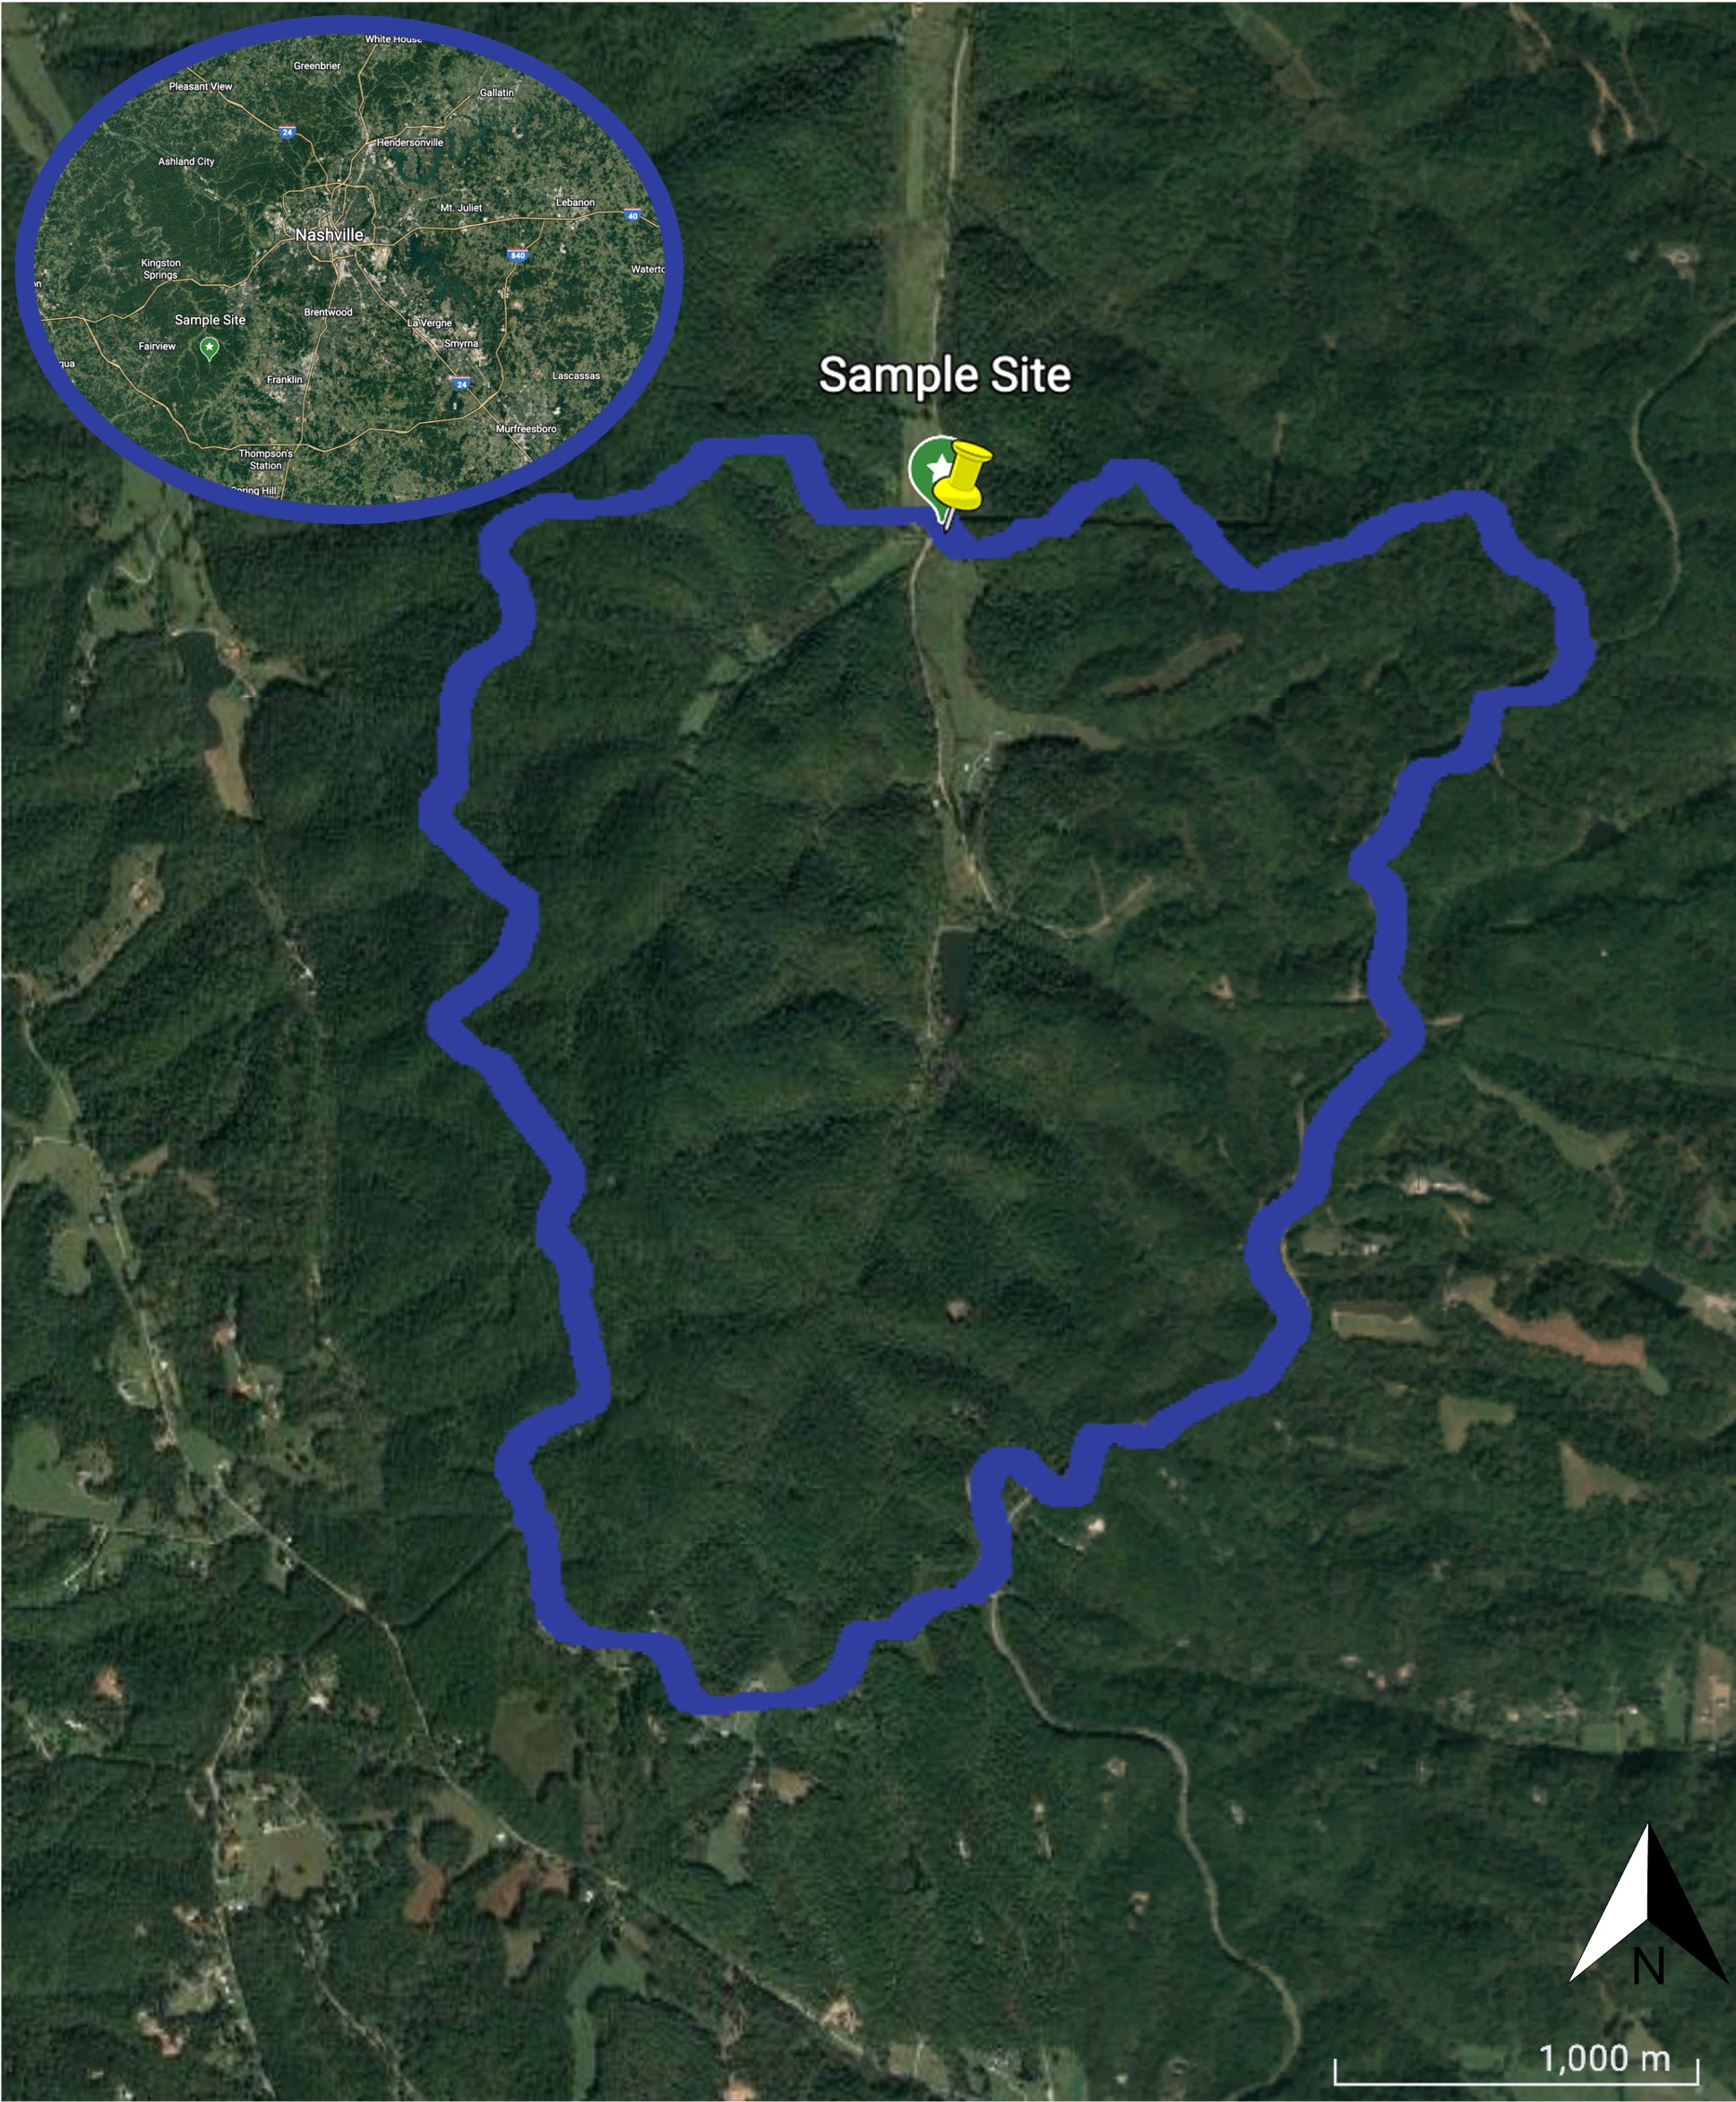
Figure 1. The blue outline shows the watershed delineation of the East Fork Creek sample site located at 35.9515437 N, -87.0156281 E. The area of the watershed is 4.68 km2. The site is located southwest of Nashville, Tennessee, as shown by the map in the top left corner of the figure.
Statistical Analysis. BASEmetab is a package in the software R that is able to take large amounts of data and create a Bayesian model [7]. This model calculates the whole-stream metabolism of a single station of an ecosystem, including the rates of Gross Primary Production (GPP), Ecosystem Respiration (ER) and Net Ecosystem Production (NEP).
It uses diel cycles to calculate the values by day, giving a different metabolism rate for each individual day. The Bayesian framework allows prior information to be considered in the estimation. Although the BASE model is relatively new, a previous study used the BASE model in analysis and found it to be a reliable tool for assessing ecosystems with long-term data [8]. Other models incorporating Bayesian framework have been used in previous studies [9,10]. The BASEmetab analysis requires full 24-hour measurements for diel cycles, so only data points from June 4-7 and July 2-5 were used.
Once the NEP values were calculated, a t-test was performed to check for a significant difference between the dates. Additionally, a Shapiro-Wilk test was used to check for normality.
RESULTS.
EXO Data. Gathering data from the EXO2 sensor, the pH of the creek consistently remains between 7.5-8.1 from June 4-8. The pH cycle is constant until it drops to 7.5 on June 8 (Figure S4). From July 1-7, the pH of the East Fork Creek remains between 7.62-8.45, changing in a constant pattern (Figure S5).
The dissolved oxygen levels remain between 6.05-10.49 mg/L from June 4-8. The diel cycle for dissolved oxygen is constant, until June 8 (Figure S6). From July 1-7, the dissolved oxygen levels vary in a constant pattern, with a range of 5.3-11.4 mg/L (Figure S7).
Bayesian Analysis. After collecting water parameter observations, measurements were run through BASEmetab, a package in R that estimates the stream metabolism, giving the values for GPP, ER and NEP (Figure 2). For the East Fork Creek, the NEP was negative, with an average value of -4.0985 across both dates. However, there was a significant difference in the NEP values between June and July collection dates (p-value = 0.0433), shown by a t-test run in JMP. The results from the Shapiro-Wilk test gave a p-value of 0.1490, confirming normality.
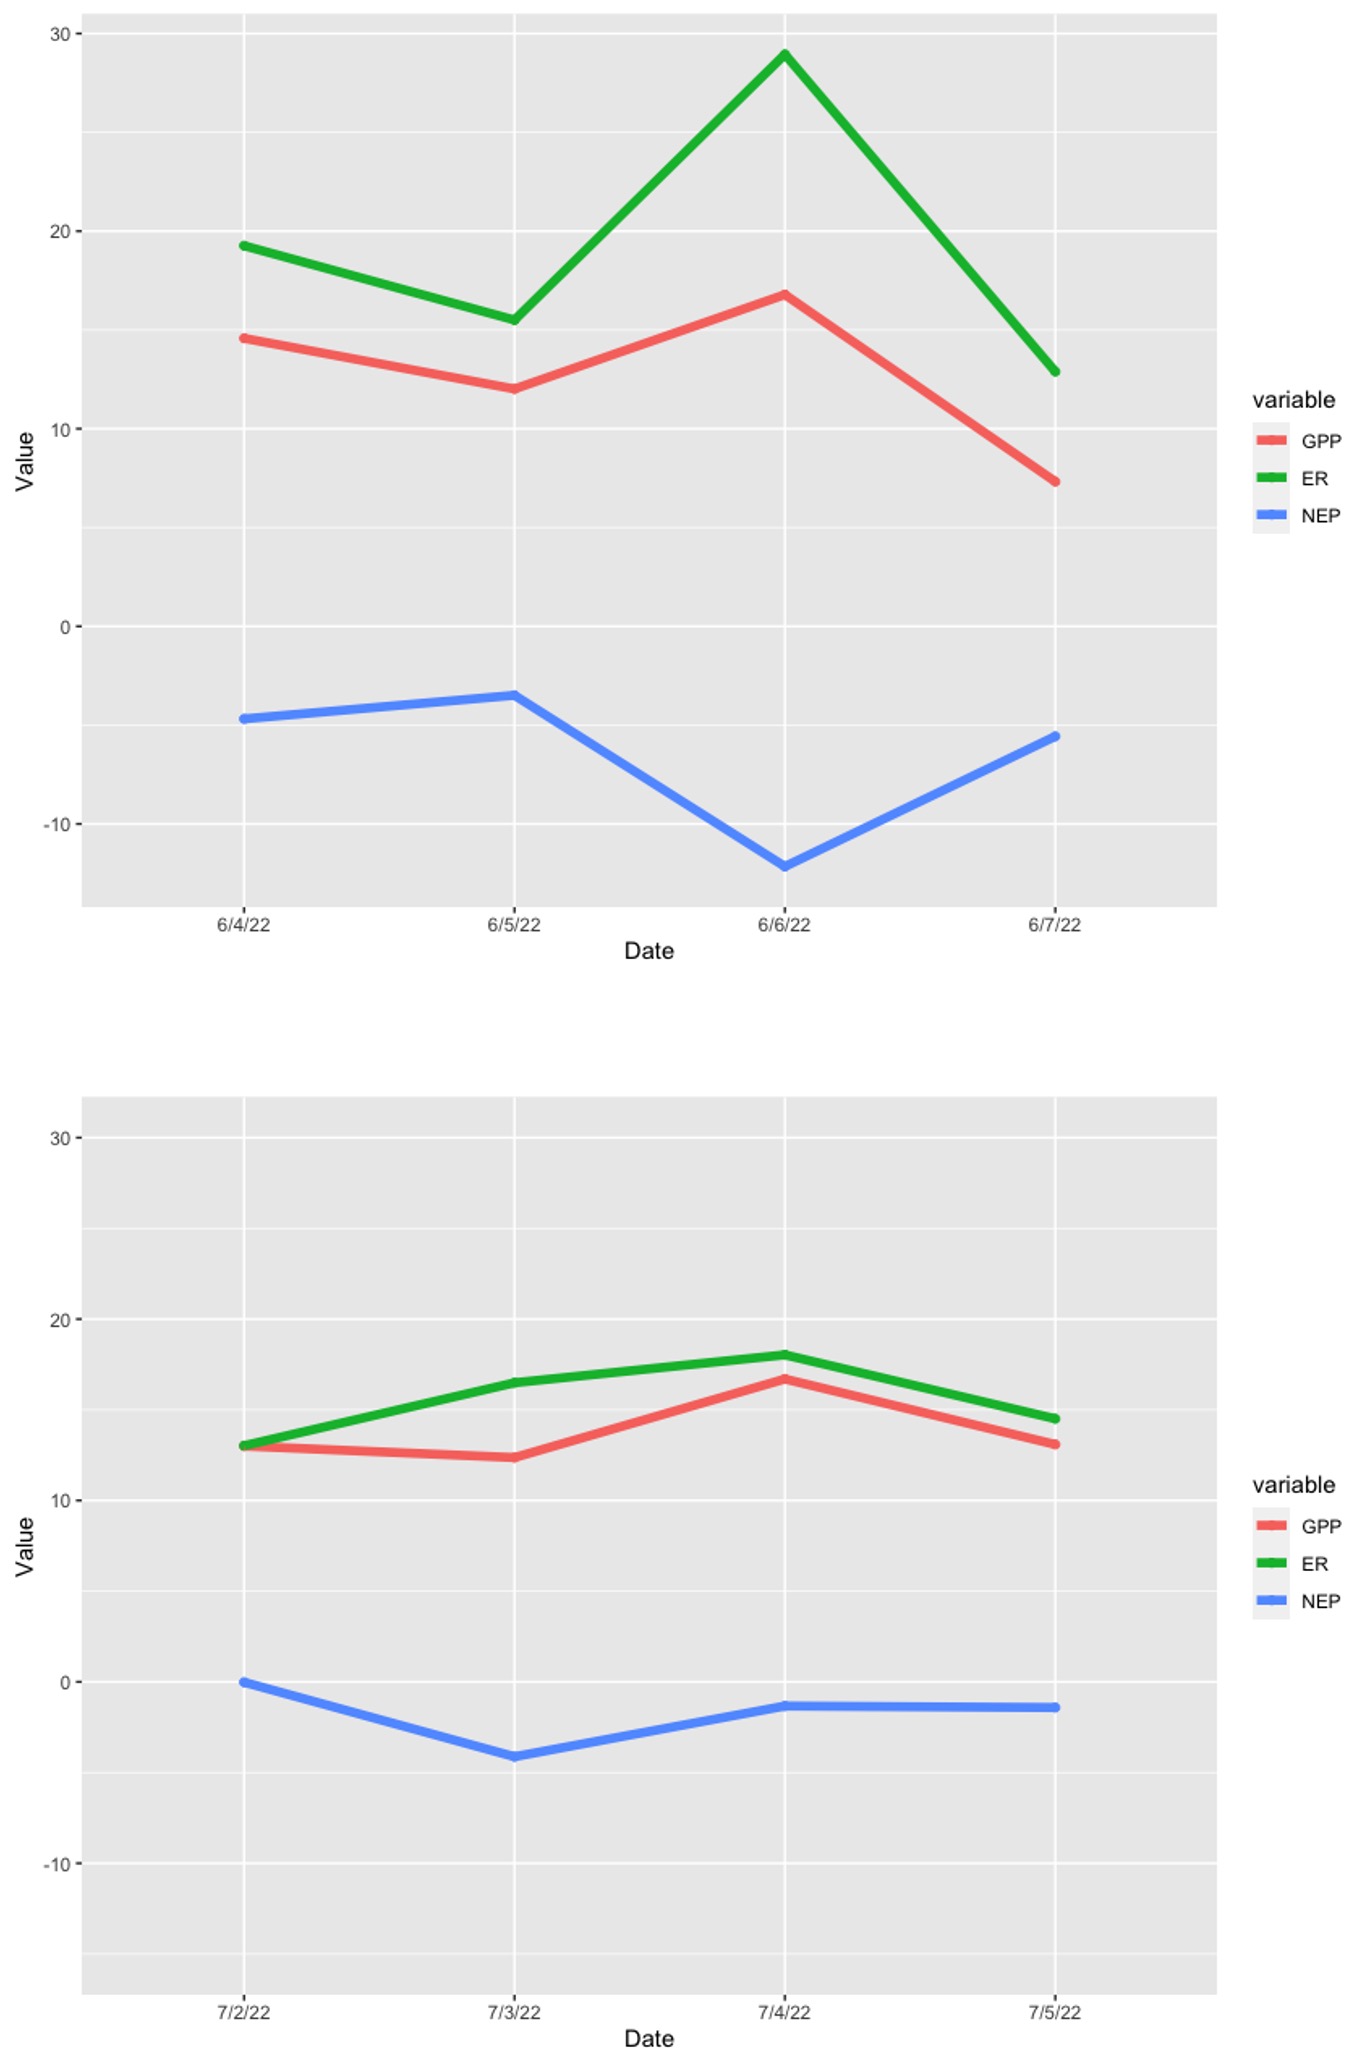
Figure 2. (a) Graph of the GPP, ER, and NEP values over the dates in June. GPP ranges from 7.323-16.788, ER ranges from 12.890-28.944, and NEP ranges from -12.156–3.490. As the ER is greater than the GPP, the NEP line is directly opposite of the GPP and ER lines. (b) Graph of the GPP, ER, and NEP values over the dates in July. GPP ranges from 12.365-16.697, ER ranges from 13.022-18.029, and NEP ranges from -4.125– -0.019. As the ER is greater than the GPP, the NEP line is directly opposite of the GPP and ER lines.
DISCUSSION.
The collected data supports the hypothesis that the East Fork Creek is a healthy water source, primarily through the pH and dissolved oxygen readings. The pH of the East Fork Creek remained consistently between 7.5-8.45, which is a healthy range for a freshwater stream. A pH of 6.5-8.2 is optimal for most plants and animals [11]. In the first data set, the pH fluctuates in a constant diel cycle, before dropping after June 7, where a precipitation event occurred with a reported rainfall of 0.57 inches. This likely caused the pH levels to drop, as the rain increased the acidity of the water. For the July data set, the diel cycle remained constant, despite precipitation occurring on July 2, 3, 4, and 6. Despite the variations, the readings remained within a healthy pH range, indicating a healthy ecosystem.
The dissolved oxygen levels remained between 5.3-11.4 mg/L, a healthy range for a freshwater stream. In a previous study, a river reported dissolved oxygen readings between 6.19-7.69, and the water quality was classified as “good” [12]. The results of this research align with those findings. For both data sets, dissolved oxygen was highest during the daytime hours because of the aquatic photosynthesis occurring. Sunlight affects the dissolved oxygen levels in a body of water, creating a fluctuation on a daily basis. For the June data set, the diel cycle remained constant, with a slight decrease on June 7, likely because of the precipitation that occurred. In July, the diel cycle remained constant, despite the consistent precipitation events.
The BASE analysis calculated a negative NEP value across all dates, meaning that the East Fork Creek uses more energy in respiration than it produces. This characterizes the stream as heterotrophic. Most of the streams that exist are heterotrophic (Figure 3) and need energy from the landscape to function, so this characterization is not unexpected. A heterotrophic state does not characterize the creek as having poor water quality, as it can easily obtain carbon from the surrounding vegetation. However, there is a significant difference between the NEP values for the June and July data sets (p=0.0433). This was likely due to the difference in rainfall that affected photosynthesis and respiration with-in the creek, along with the heightened temperatures in July.
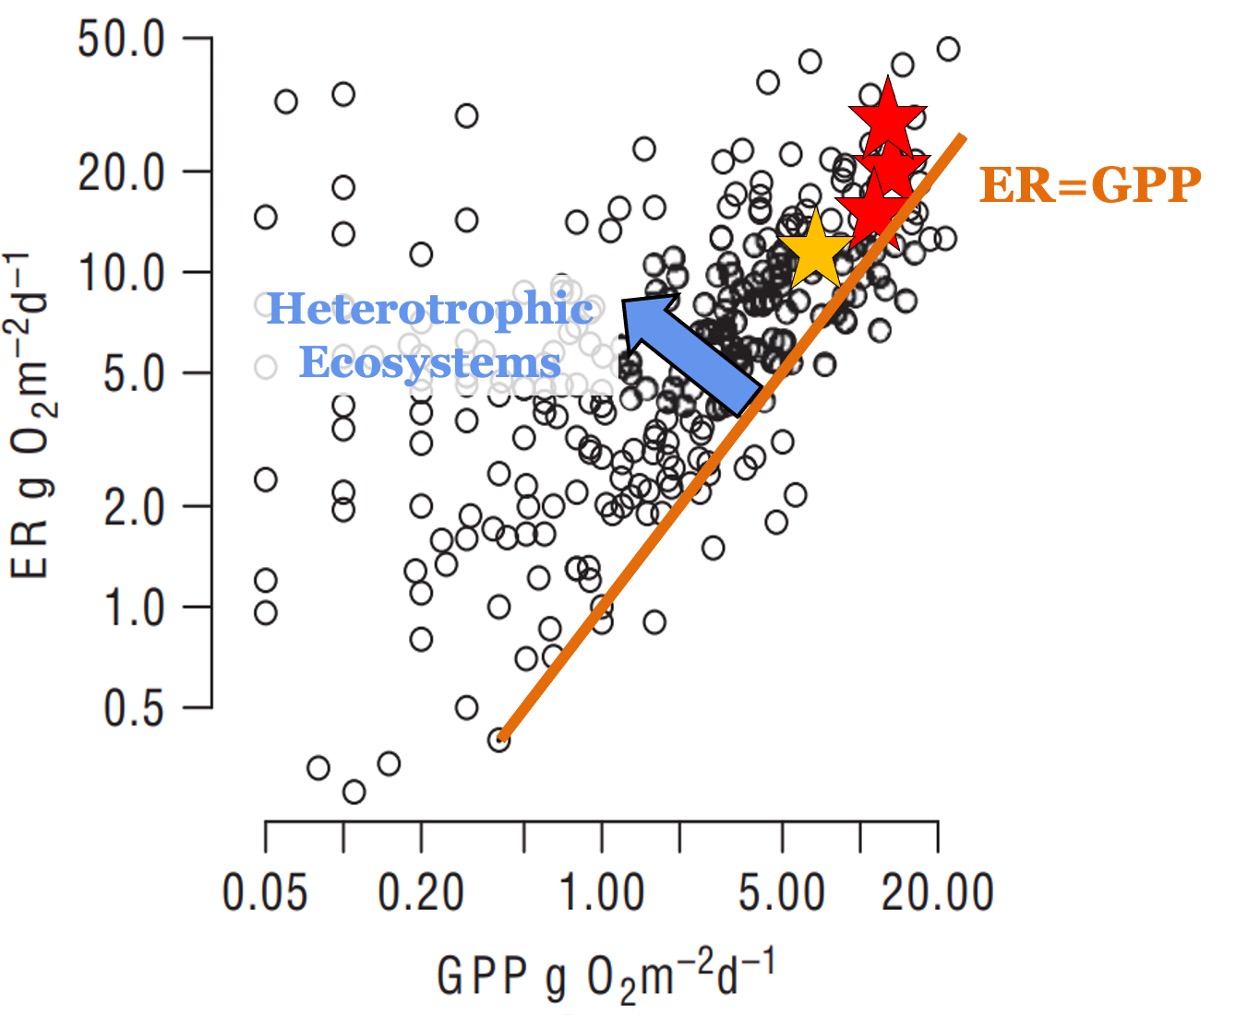
Figure 3. Summary of GPP and ER data from short-term studies in the literature (Hall et. al., 2016) [13]. The points above the orange line are classified as heterotrophic ecosystems, showing that most ecosystems that exist are heterotrophic. Estimates from the current study are shown by the stars. The yellow stars correspond to the days with precipitation events, and red stars otherwise.
This study was limited by a single data-collection point. However, the BASE analysis used a single-point estimation, maintaining the accuracy of the stream metabolism results. Although only two data sets were collected, the findings of this study are consistent with a previous study done on the same creek [7].
Further research could evaluate diel patterns in the fall and winter, because the cycles likely have greater variability between seasons. Collection dates in the winter, fall, and spring would provide a useful comparison. Additionally, more replicates could be done within the East Fork Creek at different locations. To expand the study, a more extensive analysis of the entire watershed would be beneficial, as the Harpeth River eventually converges with Nashville’s primary drinking water source, the Cumberland River. Future studies on the East Fork Creek could shift focus from the chemical composition, to irradiance levels and their correspondence with algae and chlorophyll levels, along with its correlation with GPP. This shift would provide useful information to further understand stream metabolism.
This study can be used as a reference for future research of ecosystems that have a greater anthropogenic impact, providing diel cycle assessments as a way to measure stream health. The BASEmetab program has not yet been widely used, so this study also provides a resource for further use of a new stream metabolism estimation tool. Continuous measurements throughout the year are needed to fully characterize a system, but observations such as those presented in this study provide critical insight into understanding ecosystem health. A simple assessment, reflecting the one presented in this study, can easily provide key information.
ACKNOWLEDGMENTS.
Thank you to Dr. Rebekah Stanton for invaluable guidance on this paper. Thank you to the School for Science and Math at Vanderbilt for making this research opportunity possible.
SUPPORTING INFORMATION.
Supporting information includes additional pictures of the study site and graphs showing the diel patterns of temperature, dissolved oxygen, pH, and precipitation levels.
REFERENCES
[1].Protecting freshwater ecosystems. WWF, (available at https://www.wwf. org.uk/what-we-do/protecting-our-rivers-lakes-and-freshwater).
[2]. M. Ejigu, Overview of Water Quality Modeling. Cogent Engineering. 8, 1891711 (2021).
[3]. A. Maasri, A. E. Schechner, B. Erdenee, W. K. Dodds, S. Chandra, J. K. Gelhaus, J. H. Thorp, Does diel variation in oxygen influence taxonomic and functional diversity of stream macroinvertebrates? Freshwater Science. 38, 692-701 (2019).
[4]. K. J. Janowski, Aquatic system metabolism as a tool in environmental management. WIREs Water. 8, e1521 (2021).
[5]. G. Rocher-Ros, Stream metabolism controls diel patterns and evasion of CO2 in Arctic streams. Global Change Biology. 26, 1400-113 (2020).
[6]. B. O. L. Demars, Hydrological pulses and burning of dis-solved organic carbon by stream respiration. Limnology and Oceanography. 64, 406-421 (2019).
[7]. H. Zanibi, thesis, Vanderbilt University, Nashville, TN (2021).
[8]. M.R. Grace, D. P. Giling, S. Hladyz, V. Caron, R. M. Thompson, R. M. Nally, Fast processing of diel oxygen curves: Estimating stream metabolism with BASE (BAseyian Single-station Estimation). Association for the Sciences of Limnology and Oceanography. 12, 103-114 (2015).
[9]. C. Song et. al, Continental-scale decrease in net primary productivity in streams due to climate warming. Nature Geoscience. 11, 415-420 (2018).
[10]. F. H. Mejia, A. K. Fremier, J. R. Benjamin, J. R. Bellmore, A. Z. Grimm, G. A. Watson, M. Newsom, Stream metabolism increases with drain-age area and peaks asynchronously across a stream network. Aquatic Sciences. 81, 9 (2019).
[11]. How healthy is your stream? A hands-on assessment of the chemical and physical properties of stream water using the visual arts. Athens-Clarke County Stormwater Management Program, GA, USA, (available at https://www.accgov.com/DocumentCenter/View/31847/How-healthy-is-your-stream-#:~:text=A%20pH%20of%206.5%20to,which%20may%20decrease%20the%20pH).
[12]. P.R. Kannel, S. Lee, Y. Lee, S. R. Kanel, P. Khan, Application of Water Quality Indices and Dissolved Oxygen as Indicators for River Water Classification and Urban Impact Assessment. Environmental Monitoring and Assessment. 132, 93-110 (2007).
[13]. R.O. Hall, J. L. Tank, E. J. Rosi-Marshall, E. R. Hotchkiss, Metabolism, Gas Exchange, and Carbon Spiraling in Rivers. Ecosystems. 19, 73-86 (2016).

Posted by John Lee on Tuesday, May 30, 2023 in May 2023.
Tags: Bayesian analysis, Stream metabolism, Water Quality