Adipose Tissue Macrophage Transcriptome Suggests Trained Innate Immunity Formation in Response to Weight Cycling
ABSTRACT
In a state of obesity, inflammatory immune cells infiltrate adipose tissue and are associated with the onset of insulin resistance. Weight loss ameliorates some of these effects, but subsequent weight regain aggravates the inflammation and worsens metabolic health. This pattern of inflammation resembles trained innate immunity, in which inflammatory and glycolytic pathways are upregulated upon secondary exposure to an inflammatory signal after training. Single-cell RNA-sequencing analysis of adipose tissue macrophages from weight cycled mice showed an upregulation of the inflammatory cytokine genes interleukin 1-beta and tumor necrosis factor compared to adipose tissue macrophages taken from weight-maintained obese mice. Glycolytic pathway genes, such as pyruvate kinase and lactate dehydrogenase, were significantly elevated in both weight cycled and obese conditions compared to lean conditions. Together, these results suggest that training may have occurred in weight cycled macrophages during initial weight gain and may contribute to weight cycling-accelerated metabolic disease. The formation of training in innate immune cells has been linked to epigenetic regulatory pathways that, in the future, could be targeted to ameliorate the inflammation associated with activation of the immune system during obesity.
INTRODUCTION.
Obesity is associated with the onset of metabolic and cardiovascular diseases and is an ever-increasing health risk in the developed world1. In obesity, adipose tissue (AT) expands and undergoes characteristic changes to its cellular composition. Immune cells flood the tissue and take on an inflammatory phenotype that can drive insulin resistance2. Chronic states of inflammation are a primary risk factor for type 2 diabetes, a condition that affects 400 million people worldwide1. Both adaptive and innate immune cells are involved in these changes.
In traditional descriptions of the immune system, the adaptive immune system is credited with holding a long-term memory and the ability to mount a specific immune defense when a recognized pathogen re-enters the body. The innate immune system, in contrast, is seen as a non-specific and more immediate defense against injury or pathogen entry. However, in the last decade, new evidence suggests that the innate immune system holds non-specific memory formation capabilities3. Innate immune memory, or trained innate immunity, develops when cells of the innate immune system are exposed to a stimulus that primes them to exhibit a heightened immune response upon exposure to a second and different stimulus, such as an inflammatory trigger, unrelated pathogen, or pathogen associated molecular pattern (PAMP)3. The relationship between the initial and secondary stimulus that results in a trained innate immune response has not yet been defined—but characteristic inflammatory, metabolic, and epigenetic effects of trained innate immunity make it an identifiable form of immune system memory, even though its effects are non-specific4. This pattern of memory was first modeled using the live tuberculosis vaccine Bacille Calmette-Guerin (BCG), which has been shown to confer a protective immune effect against non-target infections from disparate secondary stimuli, including the fungi Candida Albicans and the virus, SARS-CoV-24,5. This non-specific memory is achieved through an epigenetic and metabolic rewiring of innate immune cells in response to stimulation from BCG, or other triggers of trained innate immunity including fungal protein beta-glucan, the atherogenic lipid oxidized LDL, or the bacterial protein peptoglydican6. Activation of glycolytic pathways (ex. increased lactate dehydrogenase (Ldha) and pyruvate kinase (Pkm)) in response to the first stimulus mediates the formation of histone modifications that further drive metabolic rewiring and inflammatory cytokine production (ex. interleukin (IL)-1ß and tumor necrosis factor (TNF))7. The modifications histone 3 lysine 4 monomethylation or trimethylation (H3K4me1, H3K4me3) and histone 3 lysine 27 acetylation (H3K27ac) activate transcription and are the most commonly identified altered epigenetic marks observed in trained innate immune cells4.
These histone modifications have also been associated with obesity. For example, in the AT of obese individuals, H3K4me3 was increased at promoters of TNF and IL-6, which could contribute to their increased levels in obese states8. Together this suggests that the inflammatory pathways observed in states of obesity may be similar or directly related to those formed in innate immune cell training—especially when models of weight cycling are considered. Weight loss is thought to reverse or improve many of the harmful effects of obesity, but it is often difficult to maintain a reduced weight for a sustained period of time, and weight regain is common. Only around one in six overweight US adults are able to maintain a long-term weight loss of more than 10% their original weight9. Weight regain, or weight cycling, has been shown to amplify measures of inflammation and metabolic dysfunction in AT10.
A previous publication from the Hasty lab reported heightened levels of inflammatory immune cell infiltration, inflammatory mediators, and glucose intolerance in weight cycled (WC) mice compared to obese mice that maintained a constant elevated weight11. We predicted that trained innate immunity may play a role in the heightened inflammation observed in response to WC. To address this hypothesis, we conducted a single-cell RNA-sequencing analysis of the transcriptomic differences between the innate immune cells present in the AT of lean, obese, or WC mice. Evidence of training was assessed by comparing the expression of inflammatory and glycolytic genes in the macrophage populations.
MATERIALS AND METHODS.
Mouse Model of Weight Cycling.
Male C57Bl/6J mice (Jackson Laboratory) were placed on different cycles of diet containing 60% (high fat diet, or HFD) or 10% (low fat diet, or LFD) kcal from fat (Research Diets, New Brunswick, NJ; HFD: D12492; LFD: D12450B) at 8 wks of age11. Mice were divided into a lean group (LFD applied for 27 weeks), an obese group (9 weeks LFD, followed by 18 weeks HFD), and a WC group (9 weeks HFD, followed sequentially by 9 weeks of LFD and HFD). Mice were weighed weekly and an intraperitoneal glucose tolerance test was performed after 27 weeks on diet with approval by the Institutional Animal Care and Usage Committee of Vanderbilt University. A two-way ANOVA was used to analyze the body weight and glucose tolerance test data in Prism (Graphpad). A p<0.05 was considered statistically significant.
Single-Cell RNA Sequencing.
Adipose stromal vascular fraction was collected11 and magnetically sorted using anti-CD45 microbeads (Miltenyi) to isolate immune cells. Biological replicates were hashtagged and immunolabeled for surface markers using TotalSeq-C antibodies (Biolegend) and pooled for Fluoresence-activated cell sorting (FACS) via DAPI sorting for viability. 20,000 cells at ~5,000/biological replicate were targeted for sample preparations using the 10X Chromium platform (10X Genomics) and processed for 5’ transcripts. 50,000 reads per cell for the 5’ assay were targeted on an Illumina NovaSeq6000. Sample processing and sequencing were completed in the VANderbilt Technologies for Advanced GEnomics core (VANTAGE).
Data Processing.
Cell Ranger Single Cell Software Suite v. 2.2 (10X Genomics) was used to de-multiplex individual cells, process unique molecular identifiers (UMIs), and count UMIs per gene per developer recommendations. The Seurat R package was used to demultiplex biological replicates, retain singlets, and filter out cells containing >10% mitochondria RNA (mtRNA) or <200 identified genes, representing low quality data12,13. The sctransform package14 was used to normalize the gene expression assay and Centered log ratio (CLR) global scale normalization was used to normalize the feature barcoding assay. Samples were merged using anchors based on Single Cell Transform (SCT) scaling. Principle component analysis was performed, and the first 30 principal components were used for downstream analysis and visualization. Nearest neighbor clustering was performed with a resolution of 0.8 and visualized using Uniform Manifold Approximation and Projection (UMAP) non-linear dimension identify cell clusters.
Annotating clusters and differential expression.
Differentially expressed genes were calculated using the Wilcoxin Rank Sum test and markers with a positive log fold change >.25 that were found in >20% of cells were used to identify cluster cell types. Feature barcoding and the ImmGen database within the SingleR package15 were used to further validate cluster identities. Differential expression of genes between groups was then compared within each cluster with adjusted p-value <0.05.
RESULTS.
Mice were put on cycles of LFD and HFD for lean, obese, and WC groups as in our previous study11. As previously seen, WC mice had worsened glucose tolerance after 27 weeks of cycling diet than obese mice, despite having the same body weight at that time (Figure 1A&B; adj p-value = 0.04 at 30 minutes in B).
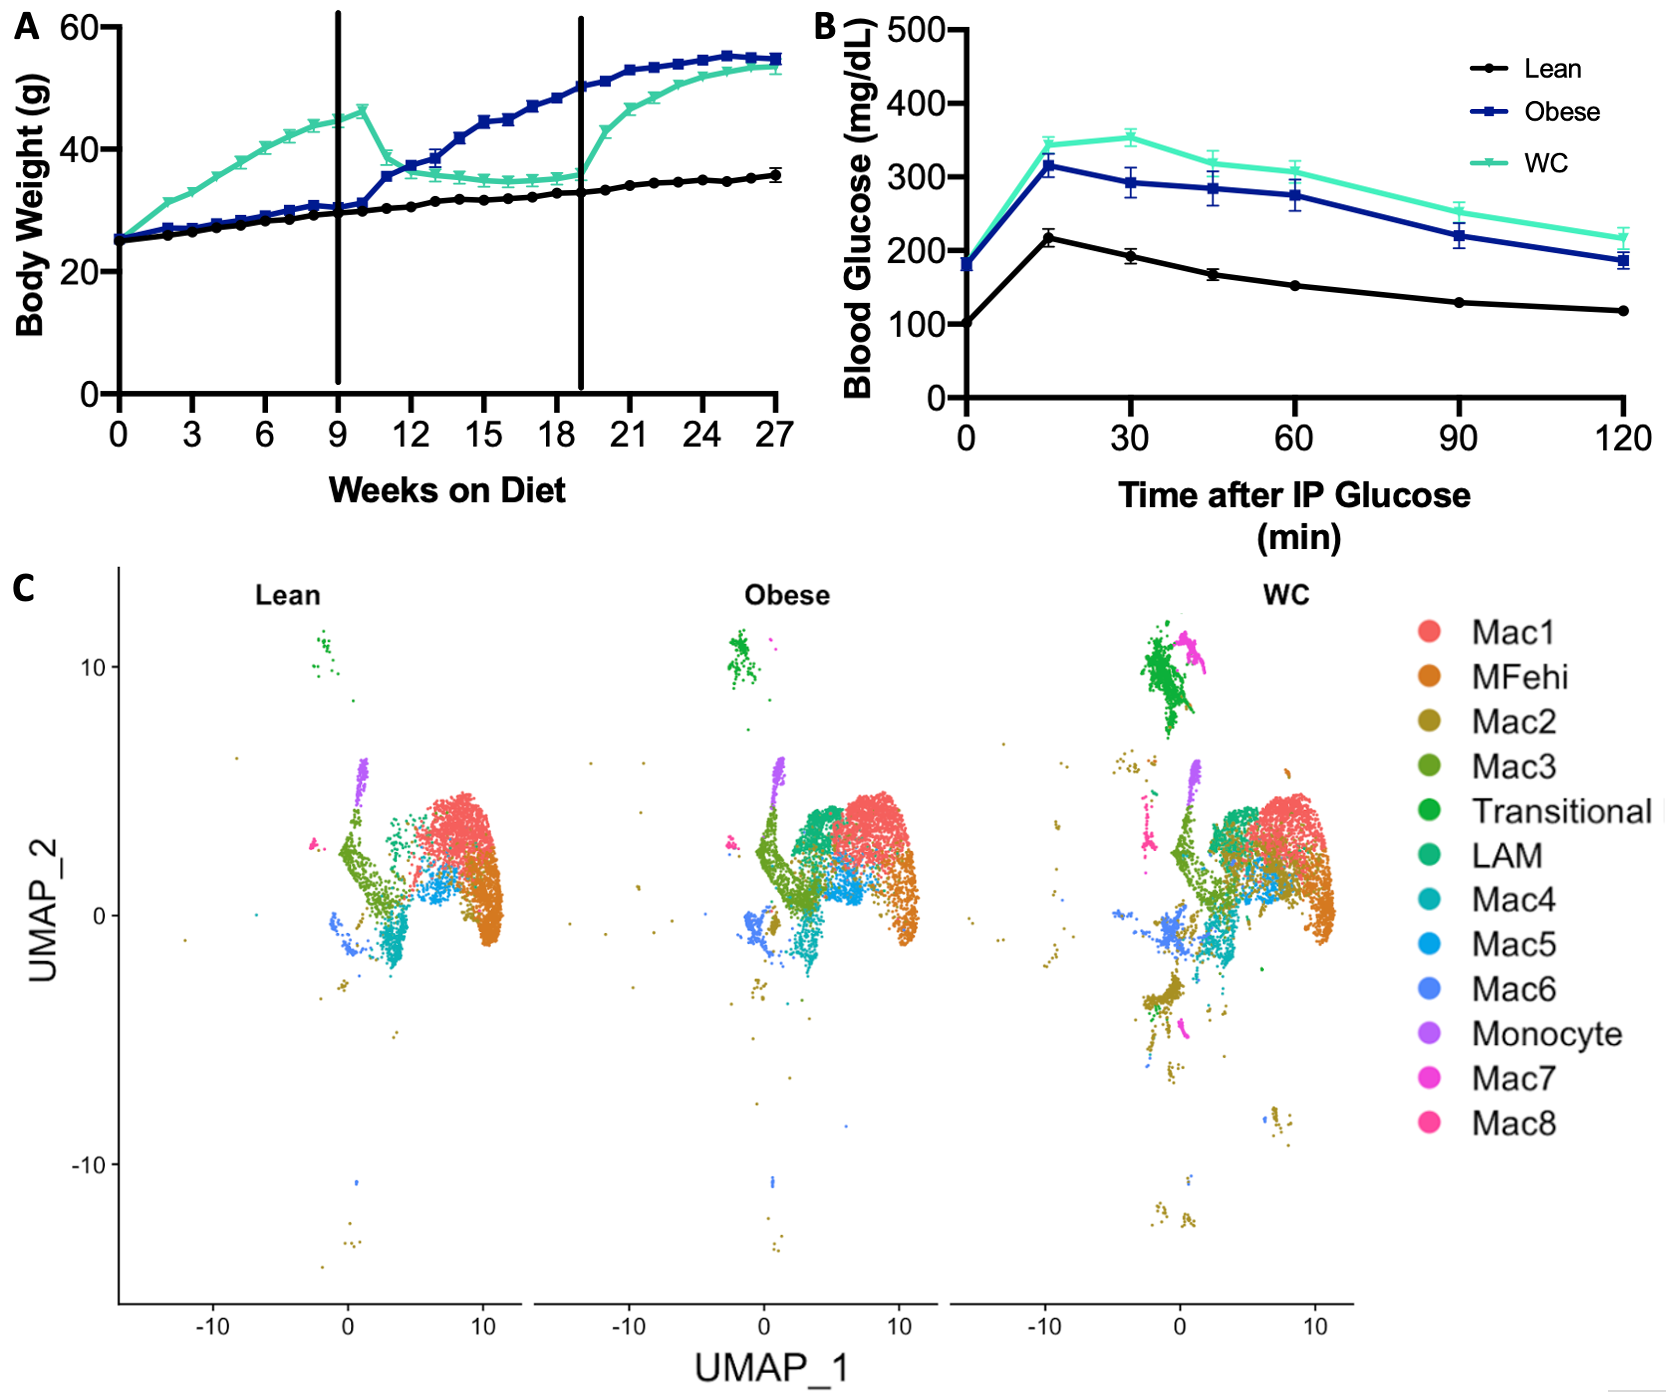
Figure 1. Weight cycling worsens glucose tolerance and affects macrophage populations A) Body weight timeline over study duration. B) Blood glucose following intraperitoneal glucose tolerance test, p<0.05 C) UMAP of macrophage populations identified by single cell RNA-sequencing and displayed by diet condition.
Thirty transcriptionally distinct leukocyte populations were observed in the AT stromal vascular fraction. For the purposes of this analysis, twelve of these clusters were selected based on their identification as AT macrophage (ATM) populations (Figure 1C). Lipid associated macrophages (LAMs)16, iron-handling macrophages (MFehi)17, and monocyte populations have been previously described in AT. We additionally found evidence of a fibroblast-like transitional group, and the eight remaining macrophage populations were notated as Mac1-Mac8 (Figure 1C). As a whole, macrophages were found in slightly higher proportion in WC mice compared to both obese and lean weight conditions (60% vs 54% and 56%, respectively).
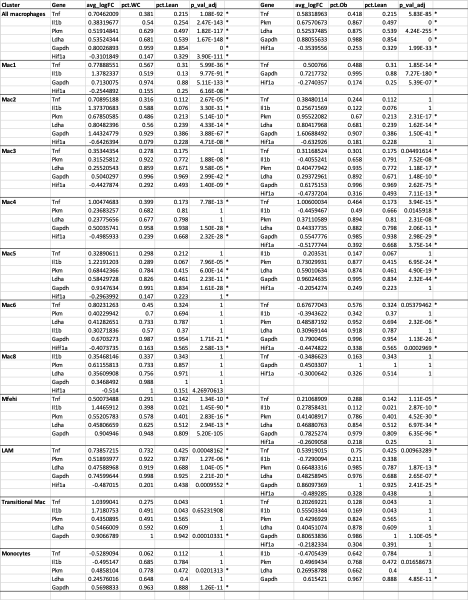
To further explore ATM phenotype, we examined the expression of inflammatory mediators previously associated with training. The average Il-1b mRNA expression was significantly higher in WC compared to obese ATMs and was present in more of the macrophages in all groups combined (Figure 2, Table S1; adj p-value = 2.44E-82) and in seven of the individual populations (Table S1). Tnf was not upregulated in WC ATMs as a whole, but the average expression and the number of cells expressing Tnf was significantly higher in the Mac1 subpopulation in WC AT compared to obese AT (Figure 2, Table S1; adj p-value = 0.00268349).
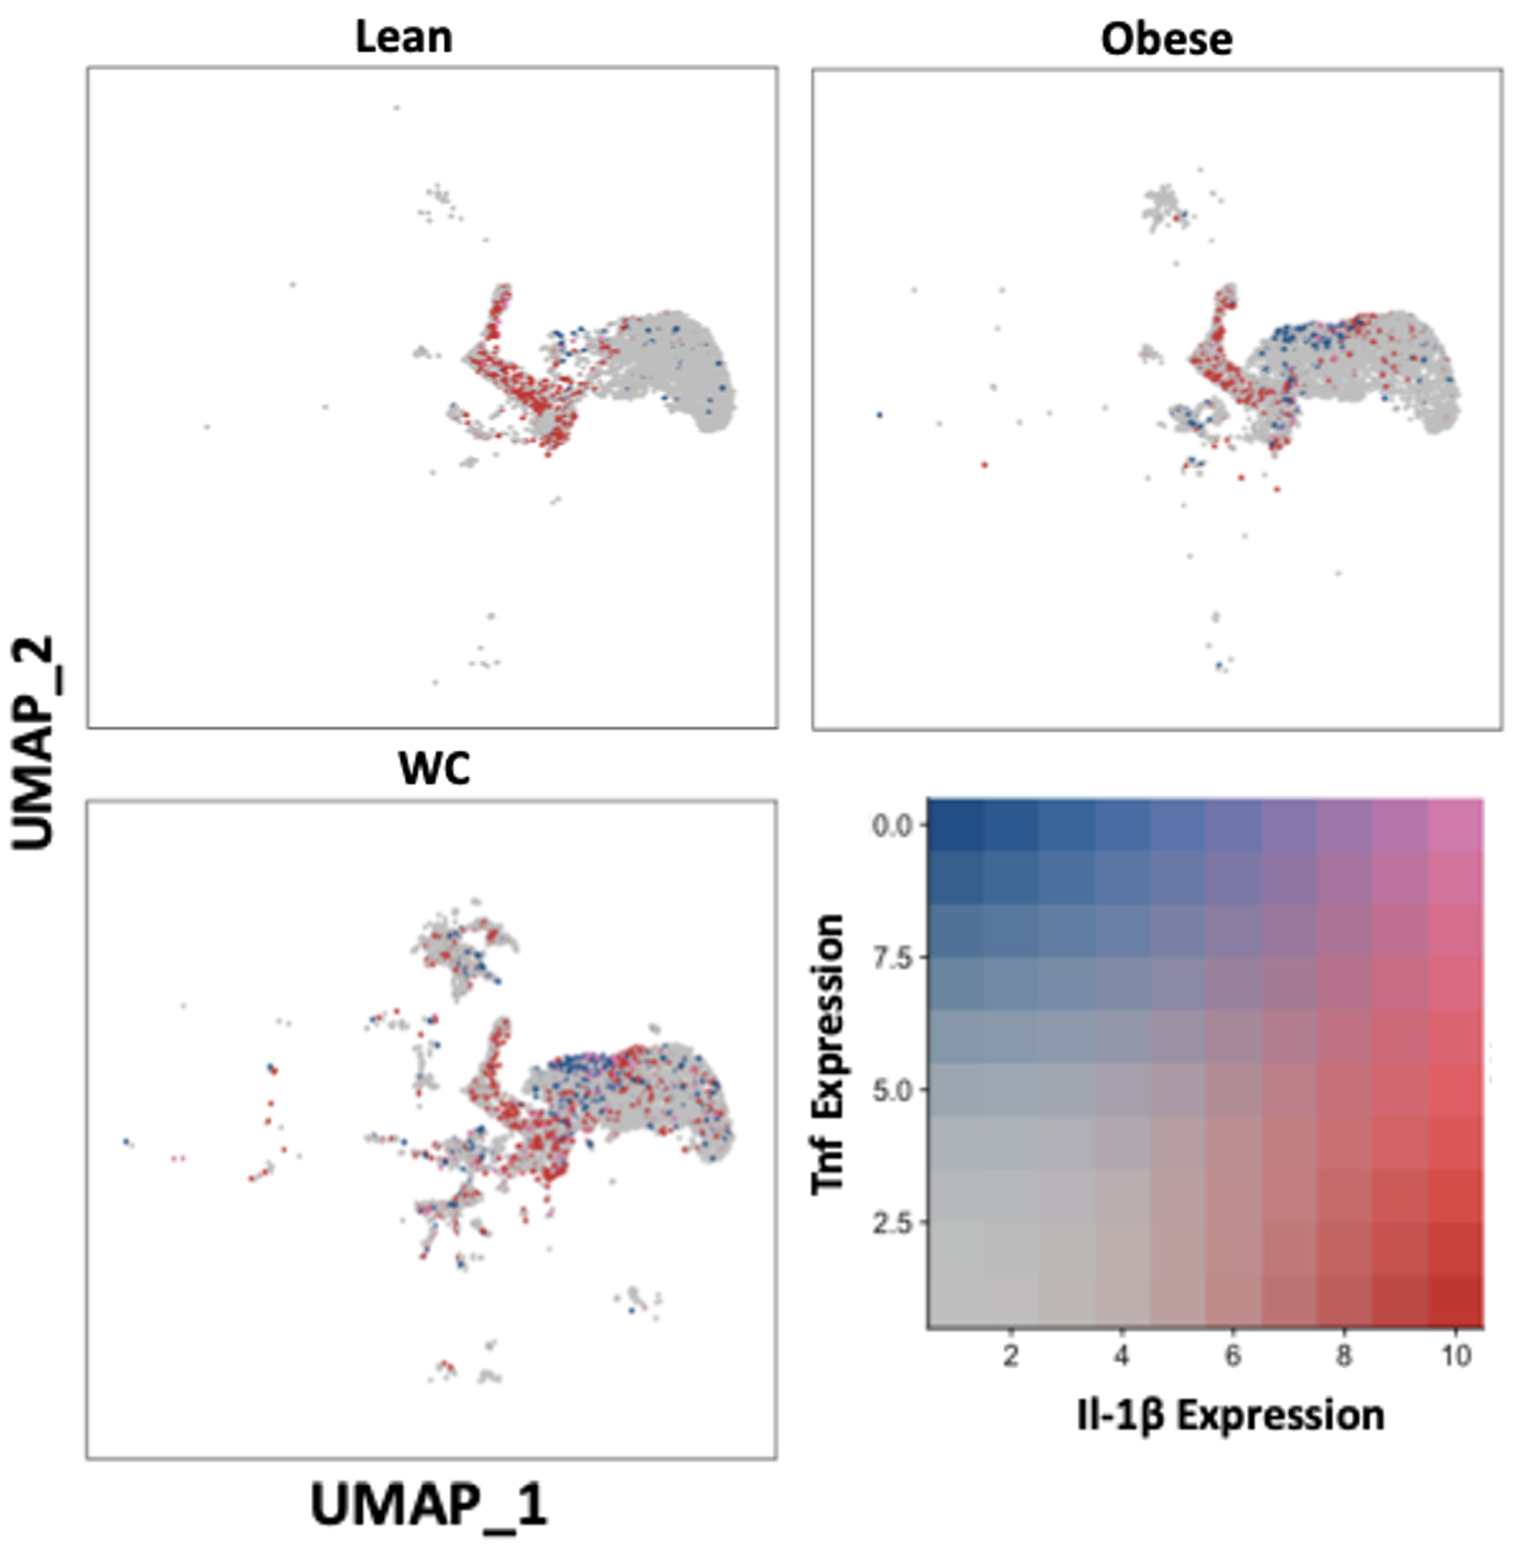
Figure 2. IL-1ß and TNF expression are elevated in at least one macrophage population in WC compared with obese and lean macrophages. UMAP of overlapping expression of the inflammatory mediators in macrophage populations by diet condition. Cell expression of Il-1b and Tnf is reflected by color saturation. Individual points represent individual cells, distributed by subpopulation identification. Subpopulation-specific results in Table S1 & S2.
The expression of glycolytic pathway genes were also quantified in the ATMs. Glycolytic gene expression in general was not significantly different between WC and obese mice ATMs (Table S1), but Ldha and Pkm were significantly elevated in the combined WC and obese ATMs compared to lean groups and in many subpopulations of WC and obese ATMs (Figure 3, Table S2; adj p-value = 1.67E-148 and 1.82E-117, respectively). The glycolytic gene glyceraldehyde-3 phosphate dehydrogenase (Gapdh) was also upregulated in multiple WC and obese ATM subpopulations, though the regulator hypoxia inducible factor (Hif1a) was actually decreased in the WC and obese populations (Table S2).
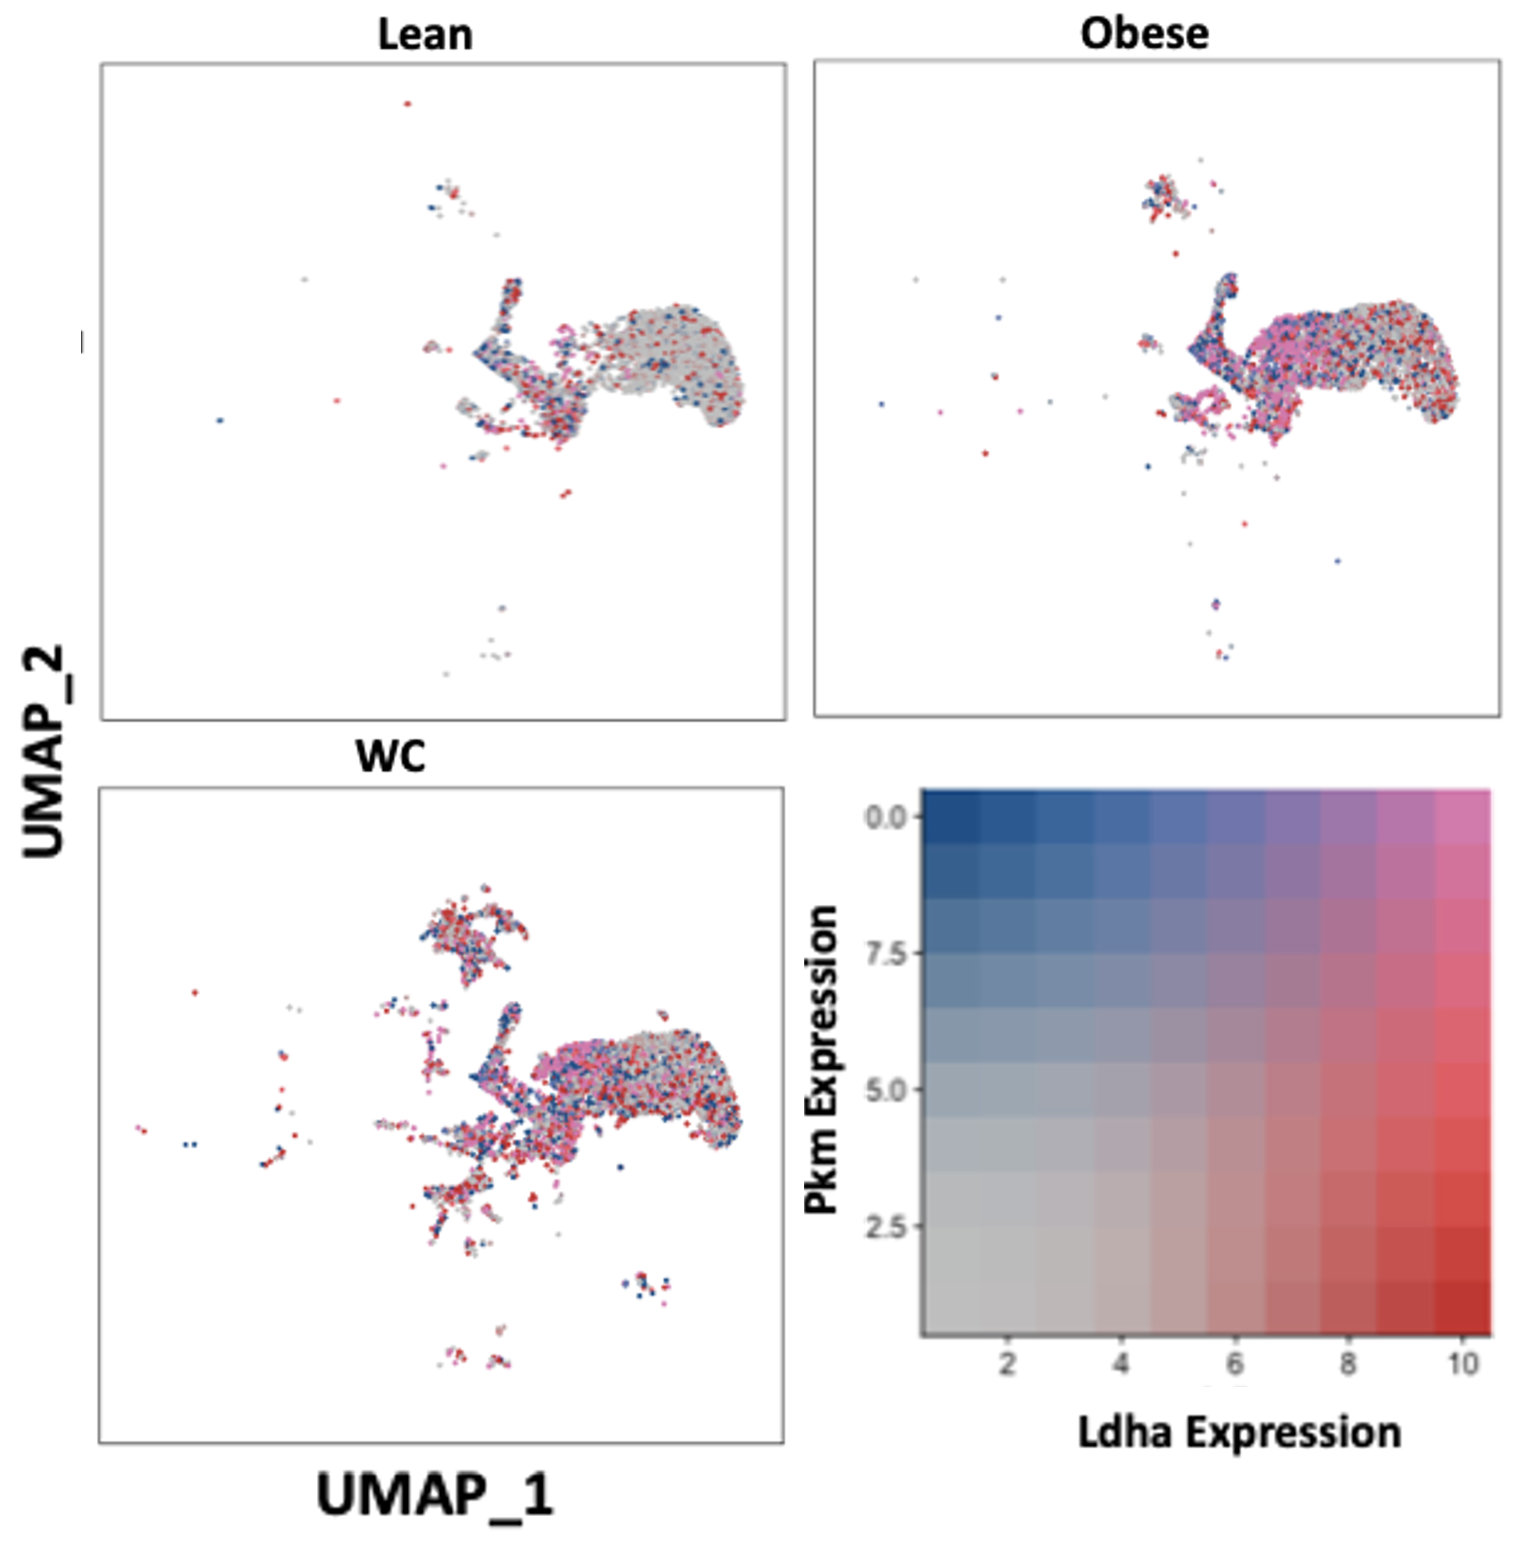
Figure 3. WC and obesity similarly increase glycolytic genes in macrophages compared with lean macrophages. UMAP of overlapping expression of glycolytic genes in ATM populations by diet condition. Cell expression of Ldha and Pkm reflected by color saturation. Individual points represent individual cells, distributed by subpopulation identification. Subpopulation-specific results in Table S1 & S2.
DISCUSSION.
Obesity and the associated chronic inflammation is a major risk factor for cardiovascular and metabolic disease1. While weight loss is often prescribed to reverse obesity’s negative health effects, maintaining substantial weight loss for long periods of time is rare9. Previous studies have found that WC amplifies measures of inflammation and metabolic dysfunction in adipose tissue beyond the levels found in constant states of obesity11. These changes are associated with worsened health outcomes for those with fluctuating weights19. Therefore, understanding the mechanisms pertinent to the formation of WC-associated inflammation is important to developing better treatment protocols for those who struggle to maintain weight loss and for understanding the inflammatory pathway trajectories triggered by obesity.
Previous research has shown that T-cells produce more inflammatory cytokines in AT with WC11. Macrophages, however, are the most prevalent immune cell present in obese AT, so further study was necessary to determine what role, if any, they have in the heightened inflammation observed in WC.
In traditional models of trained innate immunity, a cellular switch to glycolytic processes upon training with the first stimulus is considered necessary for the activation of macrophages, and the formation of innate immune memory, similar to the Warburg effect observed in cancer cells4. Preventing glycolysis (with 2-deoxyglucose) during the cell training process has been shown to nullify the increased inflammatory cytokine release of trained cells4. Diabetes drug, metformin, which impairs glycolysis, has also been shown to inhibit the formation of H3K4me3, which underlies the trained innate immunity response to BCG and B-glucan4. The glycolytic genes Pkm, Ldha, and Gapdh, were significantly upregulated in both the WC and obese conditions, suggesting a switch to glycolytic energy production. However Hif-1α, a metabolic regulator known to induce glycolysis with training, was not upregulated in WC or obese ATMs7. The lack of Hif-1α upregulation could be explained by the timing of the sequencing analysis performed in this study, as Hif-1α is typically described as an important primary inducer of trained innate immunity and may not be directly involved in the inflammation observed in secondary stimulation of trained innate immune cells. Thus, a further analysis of the epigenetic landscape and timing of protein expression in cells is necessary to fully describe the role glycolytic genes play in WC-associated ATM inflammation. Functional data of cellular bioenergetics may also be confirmed by Seahorse metabolic analysis or metabolomics studies.
As glycolytic genes were elevated in both WC and obese ATMs, additional evidence of trained innate immunity in WC ATMs is suggested by the production of inflammatory mediators. Il-1ß and Tnf mRNA were expressed at a higher amount in more cells in multiple WC ATM subpopulations compared to obese subpopulations, suggesting that priming may have occurred in these cells prior to the second bout of weight gain. These inflammatory cytokines have a known role in impairing insulin signaling and promoting lipolysis18, which contribute to diabetes development. Thus, training may contribute to the increased inflammatory cytokines in WC which may help explain the worsened glucose tolerance observed in this group. Further epigenetic analyses will help to determine if this regulation is long term or not.
Together, elevated glycolytic and inflammatory genes in WC ATMs suggest that trained innate immunity may play a role in WC-associated inflammation. Future studies of the epigenetic profile, via methods like ATAC-sequencing, and metabolic pathways, via methods like metabolomics, in WC ATMs should be used to validate these results, further clarify if training is taking place, and identify specific therapeutic targets for treating WC-associated inflammation.
ACKNOWLEDGMENTS.
I would like to extend special thanks to Dr. Heather Caslin for her continued support and mentorship as I completed this project. I would also like to thank Dr. Alyssa Hasty and Matthew Cottam for welcoming me into the Hasty Lab and helping me to complete and review this work. Finally, I would like to thank Dr. Angela Eeds and the SSMV for preparing and guiding me through my first research experience. Research funding was provided by the U.S. Department of Veterans Affairs Grant: 5I01BX002195 to A.H.H
SUPPORTING INFORMATION.
Table S1: Inflammatory and glycolytic gene expression in all macrophages and individual clusters from WC vs obese mice. *adj p<0.05

Table S2: Inflammatory and glycolytic gene expression in all macrophages and individual clusters from WC and obese vs lean mice. *adj p<0.05. No lean Mac7 group.
REFERENCES
- Dandona, P. Inflammation: the link between insulin resistance, obesity and diabetes. Trends in Immunology 25, 4–7 (2004).
- McLaughlin, T., Ackerman, S. E., Shen, L. & Engleman, E. Role of innate and adaptive immunity in obesity-associated metabolic disease. J Clin Invest 127, 5–13 (2017).
- Netea, M. G., Latz, E., Mills, K. H. G. & O’Neill, L. A. J. Innate immune memory: a paradigm shift in understanding host defense. Nature Immunology 16, 675–679 (2015).
- M, M. W. J. et al. Therapeutic targeting of trained immunity. Nature Reviews. Drug Discovery; London 18, 553–566 (2019).
- Curtis, N., Sparrow, A., Ghebreyesus, T. A. & Netea, M. G. Considering BCG vaccination to reduce the impact of COVID-19. The Lancet 395, 1545–1546 (2020).
- Arts, R. J. W. et al. Immunometabolic Pathways in BCG-Induced Trained Immunity. Cell Reports 17, 2562–2571 (2016).
- Arts, R. J. W. et al. Glutaminolysis and Fumarate Accumulation Integrate Immunometabolic and Epigenetic Programs in Trained Immunity. Cell Metabolism 24, 807–819 (2016).
- Castellano-Castillo, D. et al. Human adipose tissue H3K4me3 histone mark in adipogenic, lipid metabolism and inflammatory genes is positively associated with BMI and HOMA-IR. PLoS One 14, (2019).
- Kraschnewski, J. L. et al. Long-term weight loss maintenance in the United States. International Journal of Obesity 34, 1644–1654 (2010).
- Anderson-Baucum, E. K., Major, A. S. & Hasty, A. H. A possible secondary immune response in adipose tissue during weight cycling. Adipocyte 3, 141–145 (2014).
- Anderson, E. K., Gutierrez, D. A., Kennedy, A. & Hasty, A. H. Weight Cycling Increases T-Cell Accumulation in Adipose Tissue and Impairs Systemic Glucose Tolerance. Diabetes 62, 3180–3188 (2013).
- Butler, A., Hoffman, P., Smibert, P., Papalexi, E. & Satija, R. Integrating single-cell transcriptomic data across different conditions, technologies, and species. Nature Biotechnology 36, 411–420 (2018).
- Stuart, T. et al. Comprehensive Integration of Single-Cell Data. Cell 177, 1888-1902.e21 (2019).
- Hafemeister, C. & Satija, R. Normalization and variance stabilization of single-cell RNA-seq data using regularized negative binomial regression. Genome Biology 20, 296 (2019).
- Aran, D. et al. Reference-based analysis of lung single-cell sequencing reveals a transitional profibrotic macrophage. Nature Immunology 20, 163–172 (2019).
- Jaitin, D. A. et al. Lipid-Associated Macrophages Control Metabolic Homeostasis in a Trem2-Dependent Manner. Cell 178, 686-698.e14 (2019).
- Hubler, M. J., Erikson, K. M., Kennedy, A. J. & Hasty, A. H. MFehi adipose tissue macrophages compensate for tissue iron perturbations in mice. Am J Physiol Cell Physiol 315, C319–C329 (2018).
- Cottam, M. A., Itani, H. A., Beasley, A. A. & Hasty, A. H. Links between Immunologic Memory and Metabolic Cycling. J.I. 200, 3681–3689 (2018).

Posted by John Lee on Thursday, May 20, 2021 in May 2021.
Tags: Adipose tissue macrophages, Obesity, trained innate immunity, weight cycling