Identifying Reliable Clients for Microlending: A Data-Driven Approach
ABSTRACT
This study explores how microlending institutions can identify reliable low-income borrowers, focusing on alternative methods to assess borrower reliability beyond traditional credit scores or financial histories. Microlending has proven valuable in offering small loans to underserved groups with unique needs. However, increasing reliance on credit scores, which often works against these borrowers, demonstrates the necessity for an alternative way of determining borrower trustworthiness. This research introduces a demographically aligned model evaluating accuracy, recall, and precision to determine which borrower aspects most influenced loan eligibility. Results showed the demographic model can be effective at emphasising borrower-related factors over the traditional financial criteria in assessing loan trustworthiness.
INTRODUCTION.
Microlending, or microfinancing, is a system that gives small loans to people who do not qualify for traditional bank loans, and it has become an essential method for remedying poverty. Muhammad Yunus made the idea famous in the 1970s when he started the Grameen Bank [1]. The Grameen Bank specialises in helping people in low-income communities, especially women, start their businesses [2]. Not only can it benefit those in poverty, but also for the lenders: reaching new customers, expanding into growing markets, and finding more reliable ways to offer small loans at scale. In the end, it helps drive economic growth. Since Grameen Bank, microlending has spread worldwide, allowing millions to improve their financial situation [3]. Published books and journal articles show that microfinance significantly promotes entrepreneurship and financial inclusion, especially among underserved populations. It highlights successes, such as improved economic independence and community growth, as well as challenges, including high interest rates and limited long-term impact. However, a more significant challenge is evaluating loan qualifications, especially when many applicants may not have credit scores or formal financial histories [4].
The United Nations has set Sustainable Development Goal 1 (SDG 1) to end poverty everywhere. Microlending supports this goal by providing financial access to people who wouldn’t typically qualify for a loan from a bank [5]. However, lenders still face the problem of figuring out which borrowers are most likely to repay their loans if they don’t have credit scores to rely on [6].
Many studies suggest that microlending may help reduce poverty by promoting entrepreneurship, especially among women in rural areas [7]. For instance, a woman from rural India, once harassed by loan sharks, took advantage of a microlending opportunity. She now owns a small herd, operates a clothing shop, and has funded her son’s college tuition and a medical emergency [3]. Since its inception in 2005, Kiva, a prominent microfinance platform, has disbursed over “… USD $1.6 billion to more than 4.1 million borrowers in 77 countries.” Notably, 81% of these borrowers are women, and 56% reside in rural areas, highlighting Kiva’s commitment to underserved populations. Resultantly, they saw “… their farmers increase their annual incomes by 34% to 53% depending on the year.” [8].
However, microlending has its drawbacks, including high interest rates and cycles of debt, mainly because borrowers often lack a robust credit history, which increases risk [9]. Traditional trust-based or group evaluations for creditworthiness frequently prove unreliable at scale due to inconsistencies, bias, and subjective judgments. In contrast, data-driven platforms like Kaggle help identify trends in borrower attributes, loan purposes, and repayment behaviours, providing a quantitative basis for improved risk assessment. To identify trustworthy borrowers, the team developed a novel machine learning method that assesses delinquency risk—using factors like literacy, gender, and loan purposes—without relying on credit scores.
The team merged KIVA’s borrower data [10] with GDP information from the “Countries of the World” dataset [11] to better understand borrowers’ economic contexts. They hypothesized that a Decision Tree model could predict repayment outcomes and offer financial institutions a novel framework for assessing creditworthiness among borrowers without traditional financial histories.
MATERIALS AND METHODS.
In this research paper, the team aimed to find a relationship between various factors that predict a reliable borrower.
Data Collection.
The team used publicly available Kaggle data from kiva.org, a platform offering financial services to low-income populations, to analyse four years (2014–2017) of loans across 87 countries. Borrowers from the Philippines, Kenya, El Salvador, Cambodia, and Pakistan make up about 30% of the dataset, which may limit the applicability of the findings to countries with significantly differing economic profiles. Nevertheless, this data-driven approach enables institutions like Kiva to make informed decisions and better reach disadvantaged borrowers lacking traditional collateral or established field manager ties, supporting the UN’s 2030 poverty eradication goal by considering factors beyond credit history.
After gathering the data, the team explored the various columns and the information they provided. In addition to the information from the KIVA dataset, the team decided to incorporate another dataset from Kaggle, allowing them to leverage information specific to the country where the borrower resides. The KIVA dataset had 17 practical columns, and the ‘Countries Info’ dataset had 20 practical columns to gain information about a specific borrower. The team invested significant time in testing and determining the most impactful features that would yield the best results. Ultimately, the research team narrowed our focus to a few key columns: Repayment Interval, Sector/Activity, GDP($ per capita), Borrower Genders, and Literacy Rate.
For the analysis, the team examined these selected columns in depth. The ‘borrower_genders’ column categorized individuals as “Female” or “Male,” including individual gender information for group loans. The ‘sector’ and ‘activity’ columns classified loans into 15 distinct sectors and 163 specific activities. The ‘repayment_interval’ column specifies four types of repayment schedules: Irregular, Monthly, Weekly, and Bullet (a lump sum payment at loan maturity). Borrowers with irregular repayment intervals were classified as unreliable clients, while those with monthly repayment intervals were considered reliable.
The team found that 0.1% of borrowers in the dataset used a “weekly” repayment schedule, while approximately 5% chose a lump sum (“bullet”) repayment. Due to the limited data for these repayment types, we removed these cases to avoid highly unreliable predictions; this would also ensure that our model focused on the “monthly” and “irregular” repayment intervals, which accounted for about 95% of the data.
From the additional dataset, only the “Country,” “GDP ($ per capita),” and “Literacy (%)” columns were considered. The “Country” column had String values, and the “GDP ($ per capita)” and “Literacy (%)” columns both had floating point values. ‘GDP ($ per capita)’ represents the average economic output/income per person in a country, calculated by dividing the total GDP by the population. Literacy (%) measures the percentage of people aged 15 and above who can read and write, indicating a country’s educational attainment. These supplementary columns were merged with the KIVA loans data using the standard “Country” column to create a more comprehensive dataset. The supporting information section includes a table illustrating the structure and information within the comprehensive dataset [Table S1].
The team focused on high recall for identifying unreliable borrowers and high precision for classifying reliable borrowers. Recall measures how well the model detects unreliable borrowers:
\[TP/(TP+FN)\tag{1}\]
Where TP (True Positives) are correctly identified unreliable borrowers and FN (False Negatives) are unreliable borrowers predicted to be reliable by the model. A high recall ensures most unreliable borrowers are detected, even at the expense of misclassifying some reliable borrowers as unreliable.
Precision measures how accurately the model predicts reliable borrowers:
\[TP/(TP+FP)\tag{2}\]
TP (True Positives) are correctly identified reliable borrowers, and FP (False Positives) are unreliable borrowers predicted as reliable by the model. A high precision score ensures that when a borrower is classified as reliable, they genuinely are, minimizing false positives (FP).
Focusing on recall and precision rather than accuracy is crucial, especially when false positives are costly. In this case, the goal is to prioritize catching all unreliable borrowers (high recall) while ensuring that reliable borrowers are reliable (high precision). This approach is more valuable than accuracy, which counts overall correct predictions, particularly in imbalanced datasets or situations where misclassification costs are high.
Data Cleansing.
This involves removing missing values using Python’s dropna() function. The analysis followed steps: (a) downloading and loading the Kiva and GDP datasets, (b) merging the datasets on the “Country” column, and creating a new data frame with the columns Sector, Borrower Gender, Repayment Interval, and GDP ($ per capita). Integer values are assigned to the Repayment Interval and Sector columns to simplify processing. Finally, a decision tree was built using the selected columns to analyse the data further.
RESULTS.
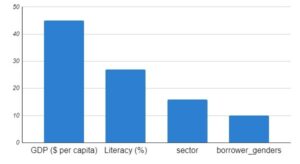
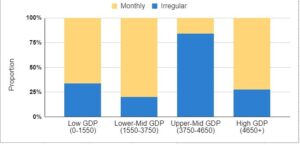
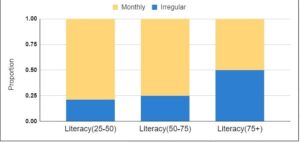
The decision tree model ranked GDP per capita, literacy rate, loan sector, and borrower gender as the most to least essential factors influencing loan repayment [Figure 1]. GDP per capita accounted for 46% of predictive importance, with borrowers from countries with mid-range GDP per capita between $1,550 and $3,750 exhibiting higher repayment rates than those from higher-income nations [Figure 2.]. Literacy rate contributed 27% to predictive significance, with loan repayment being highest in regions where literacy rates ranged between 25% and 75% [Figure 3.]. Loan sector classification influenced repayment likelihood by 16%, highlighting sector-specific risk levels. Borrower gender contributed 10% to the prediction, with female borrowers displaying a slightly higher rate of irregular repayment at 51.31% compared to 47.67% for males. The decision tree model achieved a recall of 91% for identifying unreliable borrowers and a precision of 88% for reliable borrowers. These metrics underscore the model’s effectiveness in distinguishing between borrowers with high and low repayment risk.


DISCUSSION.
A decision tree algorithm consists of a structure of many subsets, creating a tree-like flow chart [Figure S1]. As depicted in the results, the model executed its classification by splitting data based on GDP per capita, literacy rate, loan sector, and borrower gender [Figure 3].
The model demonstrated balanced and consistent performance across regular and irregular repayment classes, with weighted averages of 0.80 for precision, 0.77 for recall, and 0.76 for the F1 score. Most importantly, the model’s high recall (91%) for irregular repayments is particularly noteworthy, indicating its exceptional ability to identify high-risk borrowers. The macro-average of 0.78 across all metrics confirms the model’s robust performance and minimal bias, which is crucial for fair loan management.
The counterintuitive trends regarding GDP ($ per capita) and Literacy(%) described in the Results section could have occurred due to several reasons. In lower-GDP regions, microloans may represent a crucial lifeline for small businesses and individual survival, creating a strong incentive for repayment. Furthermore, the social structures in these communities often incorporate group lending models and social collateral, fostering collective responsibility and peer pressure for timely repayment. Microfinance institutions in lower-GDP($ per capita) countries may implement more rigorous borrower screening and provide ongoing support and financial education, improving repayment outcomes. In contrast, borrowers in higher-GDP countries may have access to a broader range of credit options, including larger loans from traditional banks, potentially diminishing the perceived importance of microloan repayment.
Loan sector classification also influenced repayment probability. With a 16% predictive weight, specific industries posed higher default risks due to market instability, job security, and repayment capacity. Future research should investigate sector-specific repayment patterns to identify high-risk sectors and develop tailored lending strategies. This research would enable microfinance institutions to diversify their loan portfolios and mitigate industry-specific risks.
The close analysis of borrower gender repayment behaviour suggested an interesting result. Female borrowers exhibited a slightly higher rate of irregular repayment than males (51.31% vs. 47.67%). This statistic indicates that gender-specific trends, such as access to resources, social roles, and financial literacy, may influence repayment behaviour. Further investigation, including analysis of loan types, loan sizes, and the specific social and economic contexts of female borrowers, is necessary to determine whether this difference reflects a genuine trend or is due to other confounding factors.
CONCLUSION.
This study demonstrated the effectiveness of demographic-based models, specifically decision trees, in assessing borrower reliability for microlending, particularly among underserved populations. Unlike traditional credit scoring, which excludes those without financial histories, our model uses demographic and economic data to predict repayment, expanding borrower access and ensuring fairer evaluations. Our model, prioritizing factors like GDP per capita, literacy rate, loan sector, and gender, achieved a superior recall (91%) for identifying unreliable borrowers and strong precision (88%) for identifying reliable ones. The model revealed nuanced relationships between demographic factors and repayment behaviour, such as higher repayment rates in mid-lower GDP countries and potential gender-based differences. These insights offer valuable tools for microfinance institutions to make more informed and equitable lending decisions, potentially improving access to capital for low-income communities and tailoring programs to specific societal contexts.
However, the research also acknowledges certain limitations: the current model’s reliance on a specific scope of demographic variables cannot capture the full complexity of borrower behaviour across different societies. Notably, the dataset used is moderately concentrated, with five countries—Philippines, Kenya, El Salvador, Cambodia, and Pakistan—comprising 30% of the data, which may limit generalizability from significantly economically different regions. This slight overrepresentation may introduce regional biases, highlighting the need for possible further validation across the underrepresented financial markets. Additionally, the absence of personalized information could hinder the model’s applicability in diverse settings. Therefore, while the demographic-focused approach suggests a strong foundation, it can only represent one piece of a more comprehensive borrower assessment framework.
Future work aims to enhance the model by incorporating personalized behavioural data. Specifically, we envision a future study involving developing a mobile application that allows borrowers to securely and voluntarily share their daily financial transactions, saving patterns, and employment history. This data would create new features, such as average daily spending, frequency of savings deposits, and employment stability indicators. Combined with the existing demographic data, these features will significantly improve the model’s predictive accuracy. Additionally, we will explore behavioural indicators, like repayment consistency in other contexts (e.g., utility bills, rent payments), as alternative measures of trustworthiness, particularly in regions where credit histories are unavailable. Furthermore, we plan to explore the inclusion of psychometric data, such as measures of financial literacy and risk aversion, which could be collected through in-app questionnaires.
By integrating demographic, behavioural, and financial data, future models can achieve a more nuanced and comprehensive understanding of borrower reliability. This holistic approach can transform microfinance practices, leading to more equitable lending decisions, greater financial inclusion, and a more financially resilient future for marginalized communities worldwide.
ACKNOWLEDGMENTS.
Thank you to the DIYA Research program and Mr. Mahesh Godavarti for mentoring the team through this process.
SUPPORTING INFORMATION.
Supporting information includes a Final Data Table and a Class Balanced Decision Tree Example
REFERENCES.
[1] Why Grameen, Grameen Foundation. Available at: https://grameenfoundation.org/about-us/why-grameen (Accessed: 25 September 2024).
[2] Muhammad Yunus, Grameen Foundation. Available at: https://grameenfoundation.org/about-us/leadership/muhammad-yunus (Accessed: 24 September 2024).
[3] Foundation, T.R. (2022) Microfinance turns India’s rural women into budding entrepreneurs. Available at: https://eb.news/fICr9UuvQqKA (Accessed: 21 March 2025).
[4] Morduch, J. (2013) How microfinance really works, How Microfinance Really Works. Available at: https://wagner.nyu.edu/files/faculty/publications/How20Microfinance20Really20Works_April202013.pdf (Accessed: 29 September 2024).
[5] Goal 1: End poverty in all its forms everywhere – united nations sustainable development, United Nations. Available at: https://www.un.org/sustainabledevelopment/poverty/ (Accessed: 27 September 2024).
[6] Counts, A. (2022) Microfinance and the backlash (SSIR). Available at: https://ssir.org/books/excerpts/entry/microfinance_and_the_backlash (Accessed: 26 September 2024).
[7] Braindeadcoder (2019) Understanding lending club’s data with EDA, Kaggle. Available at: https://www.kaggle.com/code/braindeadcoder/understanding-lending-club-s-data-with-eda#Playing-with-Lending-Club’s-Loan-Data (Accessed: 21 March 2025).
[8] Lebos, J. (2022) How microfinance supports livelihoods in developing countries, Kiva. Available at: https://www.kiva.org/blog/how-microfinance-supports-livelihoods-in-developing-countries?utm_source=social_share_link
[9] Alan, S. (2022) One Hundred Years of Global Aid, The University of Chicago Magazine. Available at: https://mag.uchicago.edu/economics-business/one-hundred-years-global-aid (Accessed: 30 September 2024).
[10] Kiva (2018) Data science for good: Kiva crowdfunding, Kaggle. Available at: https://www.kaggle.com/datasets/kiva/data-science-for-good-kiva-crowdfunding (Accessed: 1 September 2024).
[11] Lasso, F. (2018) Countries of the world, Kaggle. Available at: https://www.kaggle.com/datasets/fernandol/countries-of-the-world (Accessed: 1 September 2024).
Posted by buchanle on Thursday, June 19, 2025 in May 2025.
Tags: Computer Science, Machine learning, Microfinance, Poverty

