Feasibility assessment of heat transfer as an independent variable to compare cold exposure studies of brown adipose tissue
ABSTRACT
Brown adipose tissue (BAT) is a thermogenic tissue found in all human beings, and it has recently been proposed that it might be linked to factors in diabetes. To study the tissue and its energy burning components, characterization studies are performed with chilling devices such as water blankets. In order to maximize the ability to compare data between studies, a device which measures input and output temperatures was constructed to collect temperature and flow data. Using two vortex flowmeters, a dual parallel pipe insert was placed inside of the existing water pump setup. Protocols were run with a known heat pad, and these temperature values were used in conjunction with an energy transfer algorithm to calculate total heat transfer. From this, heat transfer may now be used to standardize data comparison between BAT-related research projects.
INTRODUCTION.
It has recently been rediscovered that brown adipose tissue (BAT) exists in adult humans. It was believed that BAT was only present in infants, but this uncharacterized part of the body is now the topic of discussion for many researchers. Brown adipose tissue is thermogenic, and despite its many unknown qualities, the foreseeable uses in the physiological setting are numerous. White adipose tissue, or subcutaneous fat, is static. However, BAT uses stored lipids and metabolites to generate heat, so it may contribute to weight loss or maintenance [1]. This potential, paired with a drive to discover its factor in regulation of glucose, has sparked interest in the medical community [2]. However, one obstacle which is still present for researchers is comparing data between studies.
To understand BAT and its thermoregulatory qualities, characterization studies involve cold activation techniques. Researchers must utilize modes of cooling such as water blankets, which pump chilled water over the patient to lower their body temperature [3], or temperature-controlled rooms which work similarly [4]. These methods are valid chilling techniques but fall short in ease of comparison; the transfer of heat in a water blanket differs from the transfer occurring in a chilled room. Additionally, since BAT is isolated in the clavicular region it is more arduous to measure than white fat, which is found across the body [1]. Since standardizing the procedures for activation is not yet possible due to the unknown role of the tissue, standardizing the methods for data collection could remedy this problem.
Currently, factors such as first shiver time, sustained shiver time, self-reported temperature, or temperature length are used to relate results. With many varied factors, sharing results is difficult. One current solution to comparison may be found in cooling dose. This construct is defined as a measure of water temperature versus body surface area [3]. Moreover, a normalized cooling dose is factored for differences in subjects for size or body type. These calculations can help to compare cooling processes without the need for extensive independent variables. However, this metric is still difficult to compare between labs since the methods differ.
Although the direct surface temperature may be measured in subjects, the physical heat transfer between the cooling apparatus and the subject’s body has not been assessed. Despite cooling in entirely different experimental designs, the fundamental energy transferred is still present. Providing a potential targetable measurement could allow for standardizing all collected results across subjects and studies. In this system, energy would flow from the warm subject’s body to the cold-water blankets.
The objective of this project was to design and build a sensing device which can measure temperature and flow for water blankets in cooling-based studies. By implementing a minimally invasive sensor array, data was collected during the cooling procedures. Using this data, a heat transfer model was also developed to calculate energy transferred between a heat source and the water. With this model, researchers can not only compare their work with other laboratories, but also to their own models internally.
MATERIALS AND METHODS.
Heat Transfer.
When designing the heat transfer model, an energy transfer formula was utilized. In the system, heat is transferred from the warm body towards the cold-water blankets. Using the differences in temperature and the rate of transfer, total energy can be determined. Energy is conserved in the system, but energy may be added. With the premise of the water blanket absorbing all the heat given off by the pad, outer interference was calculated. It was decided that energy lost from the subject to the bed would be negligible as the bed is insulated and the subject would be entirely wrapped in other cooling blankets (Figure 1) This would remove contact from the mattress [3].
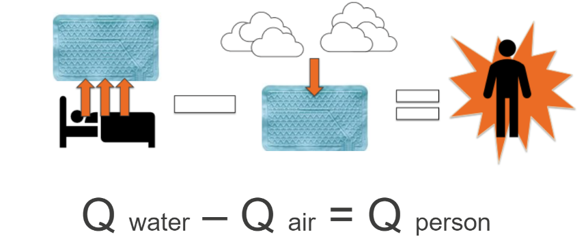
Figure 1. Conceptual model of heat transfer (Q) between a water circulating blanket (Qwater), the external environment (Qair), and a person (Qperson) during a typical cold exposure study of human brown adipose tissue. It was assumed that contribution from the environment is negligible because the water circulating blankets typically cover the participants. The derivation of the formula stated that energy absorbed by the blanket would equal the energy lost from the patient.
The other primary variable to consider was heat gained by the body from the air nearby, but since the water blankets wrap around the subject almost entirely, this too was considered negligible. Then, a formula based on a standard energy transfer was constructed (Equation 1):
Ein + Egenerated = Eout + Elost Eq.1
From this, knowing that the system followed a warm object on a cool plate scenario, the full formula was created (Equation 2):
(ṁ)(Cp)(Tout-Tin) + (hA)(T∞-Tin) = TBody Eq.2
Where ṁ is the mass flow rate of the water in m/s, Cp is the water’s specific heat in J/℃, and Tin-Tout is the difference between the final and initial temperatures measured in ℃. Since external energy was thought to be minimal, the heat transfer coefficient clause for the patient (hA) (T∞-Tin) was removed. This left the final equation (Equation 3):
(ṁ)(Cp)(Tout-Tin) = TBody Eq.3
Device Construction.
The Vanderbilt Imaging Institute currently uses the Blanketrol® III hypo-hyperthermia unit as their chilling device. This apparatus pumps cold water out through a tube to supply a water circulating blanket, while simultaneously drawing the warm water from the blanket back into its reservoir [3]. This current setup was ideal for monitoring a shift in energy as there is a direct inlet and outlet hose which could be modified to display temperature.
Before beginning construction on the system setup, some project parameters were determined (Table 1). Firstly, the sensing rate of the device needed to scan once every minute so that each datapoint could be collected. Any rate longer than one minute would run the risk of skipping over large jumps in cooling temperatures. In conjunction with a temperature range of 0-35℃, the sensors should also have a flowmeter capable of reading speeds of at least 0.6gpm, since this is the speed of the Blanketrol® flow. Not only does the flow indicate whether the Blanketrol® is running properly but would be used in the heat transfer calculation. Collected data also needed to be stored in a file format which would not require excessive transformations or conversions for ease of use.
Table 1. Design requirements for a flow temperature apparatus to measure heat transfer during cold exposure studies.
| Sensing Rate | One minute minimum sample period |
| Temperature | Detection range: 0-35℃ |
| Flow | Should monitor expected 0.6gpm speeds |
| Integration | Must fit existing Blanketrol® tubing |
| File Export | Data must be compatible with Matlab & Excel |
For the sensors, two SV4610 vortex temperature and flow meters from IFM electronic were selected due to their encompassing ranges of sensing as for both temperature and flow (Figure 2). These sensors can transfer information through a USB cable to a computer for data storage Therefore, adding them to existing laptops in the setup gave no challenge. The data are stored as .csv files and display the flow, temperature, and timestamp for each plot point. The sensors were extended with 4 aluminum ½” pipes, with one longer extension placed on the first leg of the system to reduce turbulence via the pump. The aluminum pieces were covered in ½” thick foam pipe insulation to reduce heat loss during the chilling process, and all pipes were sealed with plumber’s tape to prevent any leaks.
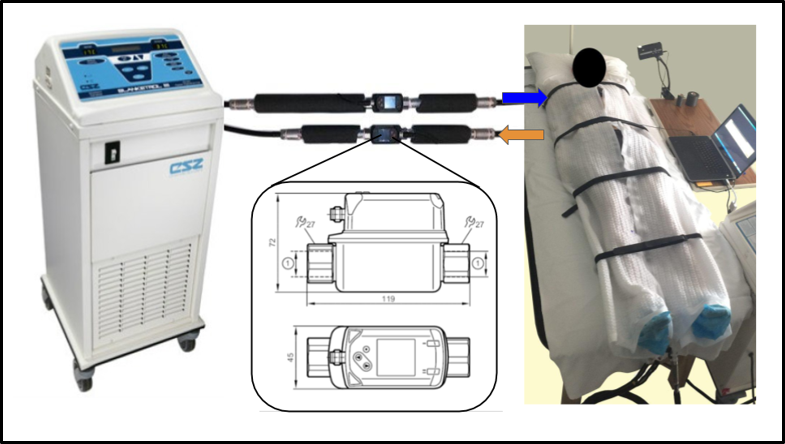
Figure 2. Condensed model of the cooling setup which contains a human subject. The sensor system was laid in line with the Blanketrol® tubing, and the flow data was send to two laptops located nearby. For validation studies, a known 50W heat pad was used.
Validation Testing.
Before testing, the Blanketrol® unit was positioned near the patient bed such that tubing could run parallel to the side. This orientation ensured an extension could be added with minimal flow disturbance. The two vortex flowmeters were placed in parallel on a singular Plasti-Pad blanket using spare Blanketrol® tubing to extend the existing inlet and outlet pipes (Figure 2).
Data was acquired over three cooling intervals: 30℃, 20℃, and 10℃. Each interval began with the Blanketrol® set to the desired temperature, with fifteen minutes to adjust to the cooling. Once it had reached the set value, the sensors were set to record for five minutes. After recording, the Blanketrol® was given another period to chill, during which sensor data was saved and the line recorder software reset. The procedure was repeated again with the heat pad turned off to track energy gained solely by the environment.
Data Analysis.
Flowmeter data was exported into Excel, and representative values of the full datasets were selected to match inlet and outlet temperatures. The temperature and flow values were then entered into the final heat transfer algorithm (Equation 3) to find the final rate of transfer
RESULTS.
Flow-Meter Device.
The sensors used in the flow-temperature system were ideal in the present testing procedure for numerous reasons. Primarily, they measured the values required to calculate heat transfer, doing so in a trackable manner. The vortex flow meters were suitable for the water pump setup due to their ease of access for recording data; no extra computers were needed. Moreover, they were low-cost and easily obtainable for the lab through IFM’s official firm. Sprouting from a factory grade company, these sensors, although stated they could operate under slower speeds, sometimes had difficulty reading the Blanketrol® flow rate. Furthermore, the bare metal housing surrounding the sensors’ chassis did not cool down as fast as the water and inner sensor did, causing a correct reading to be delayed when making larger jumps.
Validation Test.
Experimental data was then compared to a calculated theoretical heat transfer rate (Figure 3). This theoretical rate was created by converting the 50W applied from the heating pad to joules of energy. This was then converted to temperature added or lost and combined with the set temperatures for each interval to create ideal maximum heat transfer values. The experimental data was then adjusted by adding the rate of transfer caused by the ambient air.
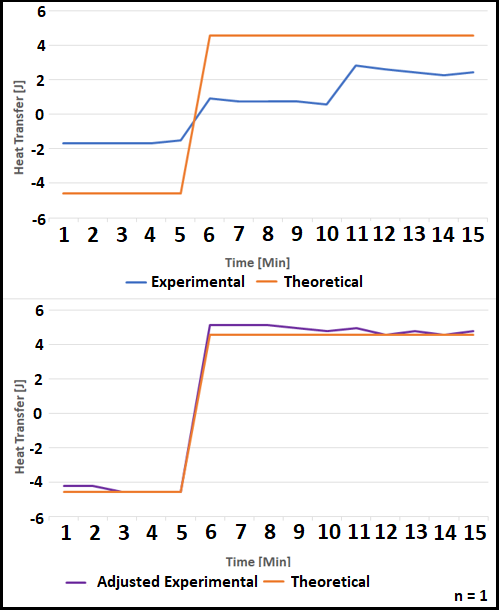
Figure 3. Three 5-minute intervals were collected. A theoretical calculation of heat transfer was created using the 50W heat pad. Experimental data was compared to indicate whether the environment had any impact. The adjusted experimental data contains the energy added by the air in addition to the heat pad.
DISCUSSION.
Upon completion of this study, a device which tracked water temperature and a heat transfer model was successfully created. Heat transfer was also identified as a new independent variable for describing physiological trends in cooling-based procedures. The sensing device, in addition to adequately recording the required temperature and flow, simplifies the recording process. No external wiring is necessary to power the device, as the USB data cable supplies it. Moreover, collection occurs on existing computers. The flowmeters integrate easily to the Blanketrol® tubing without needing changes to the standard cooling setup. Line recorder software was basic to control and allowed for consistent data output and manipulation.
For the heat transfer model, originally it was thought that energy from the environment added to the water system would be negligible. As shown in Figure 3, the original experimental heat transfer is significantly closer to equilibrium. Since no general ambient heat transfer coefficient is applied for every protocol, this solution is applicable on a case by case basis.
Although this model is still a proof of concept, the heat transfer results are extremely positive. To increase the accuracy of the model, a wider scope of trials with in vivo human subjects is necessary. Once a more refined model is produced, the next step would be to apply it to a larger sample of methods. In doing this, the model will hopefully help to standardize the mode in which researchers compare their brown adipose tissue data.
ACKNOWLEDGMENTS.
This project would not have been completed without the mentorship of Dr. Coolbaugh and Dr. Damon. I thank Mark George for assistance with data collection, and Dr. Walker for aid in developing a heat transfer model. This research was funded through NIDDK/NIH R01-DK-105371.
REFERENCES.
- A. Gifford, T. F. Towse, R. C. Walker, M. J. Avison, and E. B. Welch, Characterizing active and inactive brown adipose tissue in adult humans using PET-CT and MR imaging. Am. J. Physiol. Metab. 311, 95-104 (2016).
- K. A. Iwen et al., Cold-induced brown adipose tissue activity alters plasma fatty acids and improves glucose metabolism in men. J. Clin. Endocrinol. Metab. 102, 4226-4234 (2017).
- C. L. Coolbaugh, E. C. Bush, E. S. Galenti, E. B. Welch, and T. F. Towse, An individualized, perception-based protocol to investigate human physiological responses to cooling. Front. Physiol. 9, 195 (2018).
- P. Tikuisis, D. G. Bell, and I. Jacobs, Shivering onset, metabolic response, and convective heat transfer during cold air exposure. J. Appl. Physiol. 70, 1996-2002 (1991).
Posted by John Lee on Wednesday, December 23, 2020 in May 2020.
Tags: brown adipose tissue, cold exposure, thermoregulatory physiology