The Effects of Light Wavelengths on Lipid Content of Saccharomyces cerevisiae
ABSTRACT
Lipotoxicity is when enlarged lipid droplets fail to store more lipids which leads to an increase in free-floating fatty acids in non-adipose tissue, developing insulin resistance (IR). IR is one of the main causes of Type 2 Diabetes (T2D). Hence, decreasing lipid content would decrease IR in T2D. Light-Emitting Diodes (LEDs) have been proven and used in various treatments. Thus, this study was conducted to evaluate the effect of LEDs on the lipid content. LEDs were evaluated to understand the effect on lipid content using Saccharomyces cerevisiae as a model organism which was exposed to red, purple, green, and white light in triplicates. Over two weeks, the cell and lipid masses were recorded on the 0th, 3rd, 6th, and 14th days. The white light was the most effective, having the smallest lipid-to-cell ratio at 2.893 when compared to the other groups (6.843 (green), 7.642 (purple), 10.283 (control), and 12.3 (red)). With the white light’s dramatically low ratio, it seems to be the most efficient at reducing lipid content. The p-value for the data showed statistical significance. The application of white LED should be further researched, especially regarding its possibility as an adjunct to reduce lipid content, thereby decreasing insulin resistance.
INTRODUCTION.
Diabetes is a chronic illness and is the 8th leading cause of death.1 Approximately 1 in 10 Americans have diabetes, with 90%-95% being Type 2 Diabetes and nearly 80.3 % of adult diabetics are overweight.2, 3 Diabetes is mainly caused by insulin resistance and defective insulin secretion. Insulin resistance (IR) is defined as when a body’s cells stop responding to insulin. Enlarged adipocytes (fat cells) struggle to store more lipids and so there is increased lipotoxicity in the body.4
Lipotoxicity is when lipids are not stored in lipid droplets and thus circulate as free-floating fatty acids (FFAs). Lipotoxicity has been proven to be linked with insulin resistance.5 Reducing lipid content would reduce lipotoxicity which would reduce IR and could be a treatment modality for Type 2 Diabetes. Current diabetic treatments are symptom-focused and have side effects, whereas an LED treatment would be safe, cost-effective, and non-pharmacological with minimal side effects.
Phototherapy with LEDs has shown a benefit in scenarios including killing microbial infections, lessening diabetic foot ulcers, and alleviating chronic pains.6 Blue LED light has been shown to suppress cell proliferation7 and red LED light has been shown to reduce inflammation and increase cell inhibition.8, 9 It is important to better understand how light can be used noninvasively to reduce lipid content, indirectly reducing obesity and insulin resistance in patients. To conduct the study, yeast, a eukaryotic cell, is used as a model organism due to its high lipid content and rapid multiplication. Yeast, especially oleaginous yeast cells like Saccharomyces cerevisiae, have a large lipid content because of their big lipid droplets and will be an ideal organism for the study.10
The main objective of this study is to evaluate the effect of various LED lights on the lipid content and to understand which LED light has more impact on lipid content reduction.
MATERIALS AND METHODS.
Study Approval.
The written study design and methodology were discussed and approved by the science department, at Oregon Episcopal School, Portland.
Experimental Set-Up.
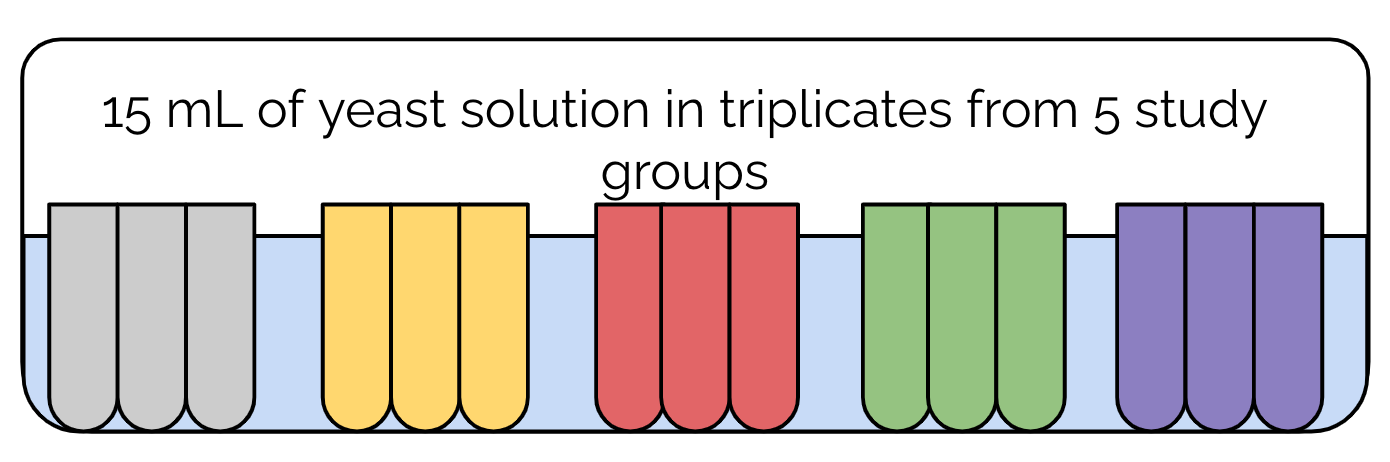
A stock solution was made by mixing the autoclaved Yeast Peptone Dextrose (YPD) powder, from Research Projects International, and 1000 mL of distilled water with 7g of yeast, from a local store. Following the preparation, 60 mL of the stock solution was poured into 15 autoclaved jars. 3 pre-labeled and numbered jars were placed in each of the cardboard triangle compartments, and red (620-750 nm), green (495-570 nm), purple (400-450 nm), and white (380-750 nm) lights of 3600 lumen were positioned above. The control was maintained in similar conditions with room light. The test groups were continuously exposed to light over 14 days.
Sample and Data Collection.
As seen in Figure 1, 15 mL of solution from each jar was taken and placed into pre-labeled test tubes, and the 15 test tubes were placed into a boiling water bath for 15 min to lyse the cells. After the cell debris settled to the bottom of the test tubes, the supernatant was then pipetted into different test tubes. Then, the solids were filtered out using pre-weighed and labeled filter paper.
The filtered out on the filter paper is the biomass and the filtrate was in a test tube. 5 mL of Acetone and 10 drops of Sudan IV dye (a lipid stain), from Carolina Biological, were added to each test tube and mixed thoroughly, as seen in Figure 2. The above solution was poured into pre-weighed petri plates. The petri plates were placed into a fume hood. The weights were recorded with and without biomass and lipid mass in filter papers and petri plates respectively. The biomass on the filter papers and the lipid mass in the petri plates are shown in Figure 3. This procedure was repeated on the 0th day, 3rd day, 6th day, and 14th day.


RESULTS.
The effects of all four LED lights with different wavelengths, red (620-750 nm), green (495-570 nm), purple (400-450 nm), and white (380-750 nm), and control groups on the biomass, lipid mass and the ratio of the lipid mass over the biomass was measured on the 0th, 3rd, 6th, and 14th day.
Biomass.
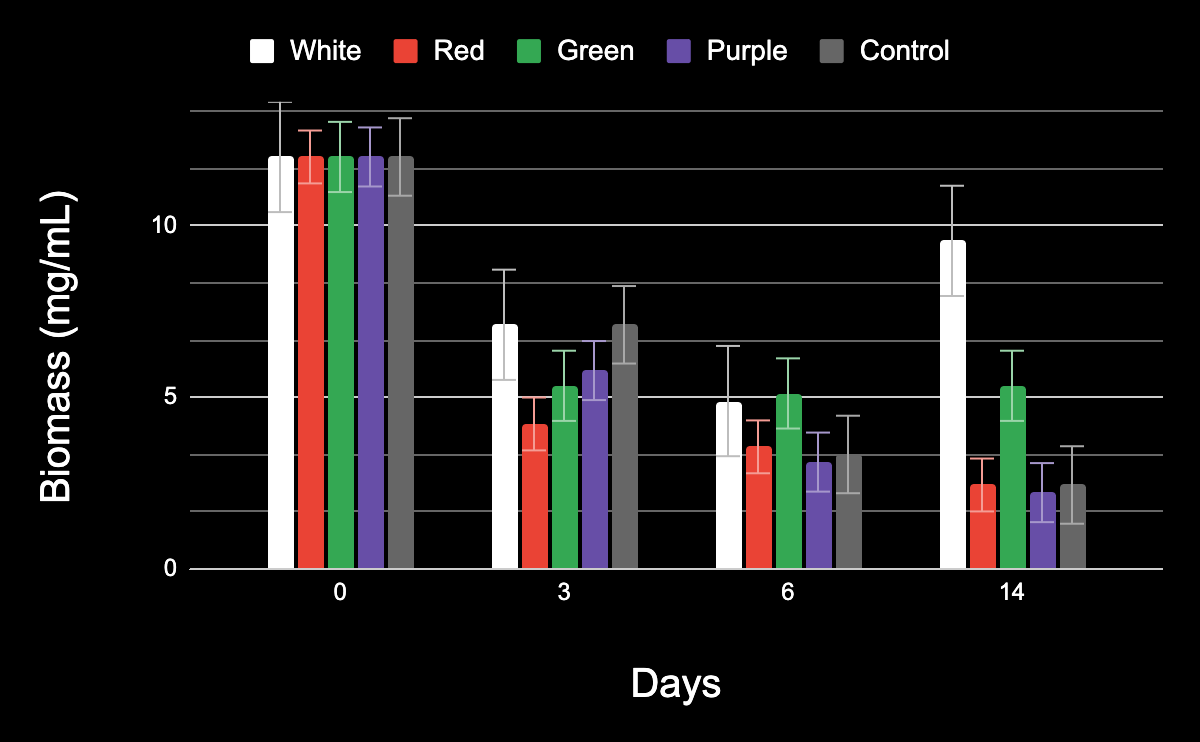
As seen in Figure 4 below, the biomass gradually decreased in the purple, red, and control test groups. However, the green LED test group’s biomass remained stable. It is interesting to note that the wavelength of the green LED is 495-570, which is between the wavelengths of two test groups where the biomass decreased over time, red and purple. Thus, it seems to indicate that there is not a linear relationship between wavelength and biomass. Furthermore, the highest biomass was in the white light test group, after the cells acclimatized.
Using a single-factor ANOVA test for the biomass of all the study groups on the 14th day, a p-value of 0.05 was determined, showing statistical significance in the study groups.
Lipid Mass.
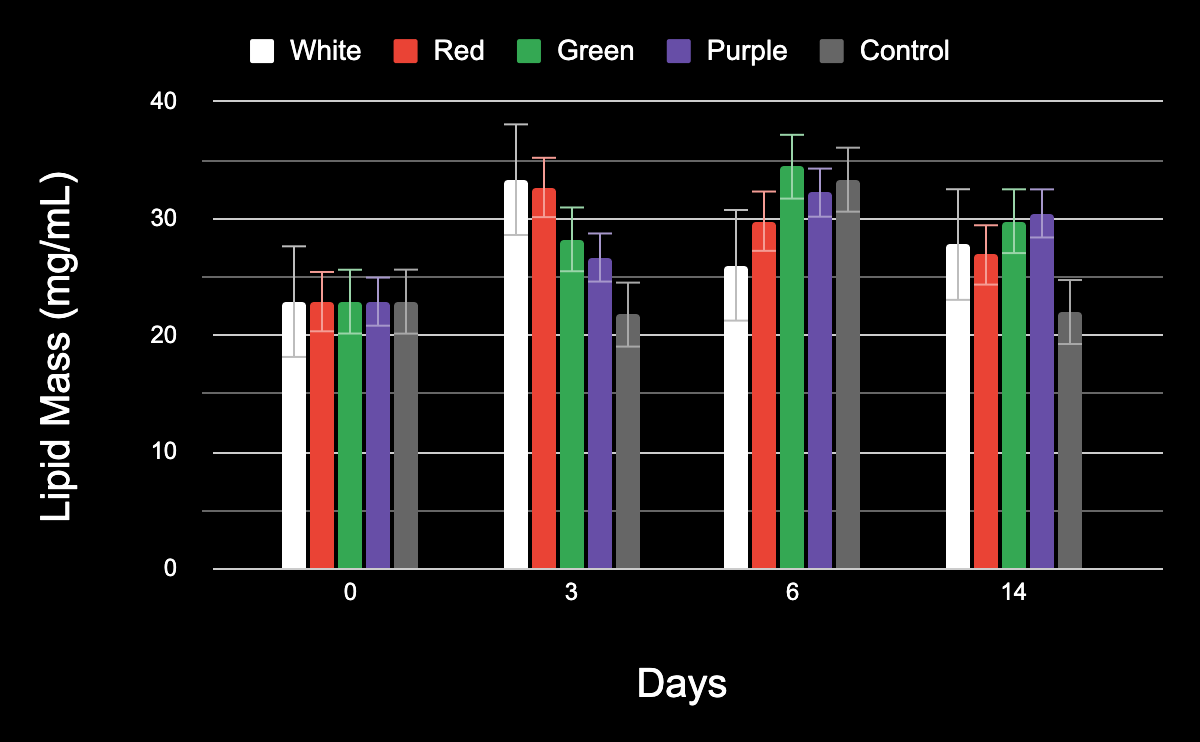
As seen in Figure 5 below, the white and red groups’ total lipid mass decreased from the 3rd day to the 14th day, with red decreasing slowly and white rapidly. The purple, green, and control test groups’ lipid mass seemed to increase from the 3rd to 6th day interval and then decrease from the 6th to 14th day interval.
Using a single-factor ANOVA test for the lipid mass of all the study groups on the 14th day, a p-value of 0.0003 was calculated, showing a statistical significance between the test groups.
Ratio.
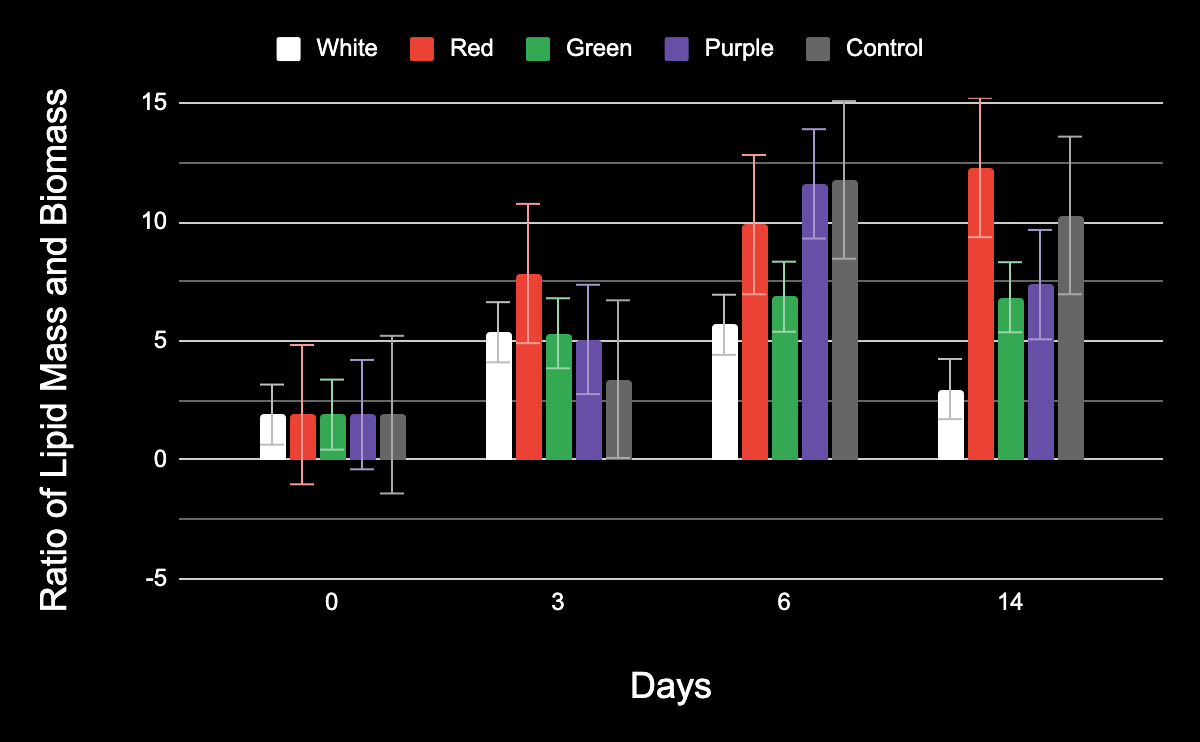
Finding the ratio allows one to see the lipid content per mg of biomass, allowing the project to control for any variance in the biomass the light might cause. As seen in Figure 6 below, red, purple, and the control group ratio increased. This can be due to a small biomass or large lipid mass. The green test group maintained the same ratio from the 3rd day to the 14th day. The white test group’s ratio decreased.
Using a single-factor ANOVA test for the ratio of all the study groups on the 14th day, a p-value of 0.02 was determined, showing a statistical significance between the test groups.
DISCUSSION.
In this study, white light had the best impact on the cells by reducing the lipid content the most, followed by green light. However, more research is needed for more conclusive results. In a study, Brouwer (2015) showed white light improves depressive symptoms and insulin sensitivity by restoring the circadian rhythm.11 Currently, no studies have evaluated the effects of white light on lipid content. Also, as shown in the green test group, the biomass remained the same from the 3rd to the 14th day which might be due to cell death which could have happened early in the study period. It is interesting to note that green light might have shown cell membrane damage and death of cells. Recently, it has also been used for accelerating wound healing.12, 13 It was further proven in the experiment that the green test group maintained the same ratio. In the study, red light showed a decrease in lipid mass which was similar to the research published by Jung et al (2015) who had reported down-regulation of lipid production in human sebocytes.7 Additionally, the wavelengths of light that are on opposite sides of the visible spectrum (400-450 nm (purple) and 620-750 nm (red)) showed less biomass than green, a wavelength range in between the two, indicating that a higher or lower wavelength does not confirm an increase in the biomass. It is interesting to note there is a lack of a linear correlation between wavelength and biomass. As white LED light reduces lipid content, it could be potentially used to reduce lipotoxicity and can be further studied to decrease insulin resistance. In diabetic patients, LED therapy is a cost-effective, non-pharmacological, and non-invasive treatment modality.6, 7, 12
CONCLUSION.
The study showed a unique finding of white LED light being the most effective at reducing the lipid content in Saccharomyces cerevisiae. However, further research is needed to explore the potential of using LED light as a non-invasive treatment modality for lowering insulin resistance. In the future, this study can be conducted over a longer period and with a combination of lights. In addition, it would be interesting to separate lipids into various classes like sterols, esters, and glycols and evaluate the effects of various lights on each specific type of lipid. It would be great to continue this study in vivo as well to see how light would interact with other types of cells.
REFERENCES.
- Centers for Disease Control and Prevention. “Leading Causes of Death.” Accessed December 5, 2022. https://www.cdc.gov/nchs /fastats/leading-causes-of-death.htm.
- Centers for Disease Control and Prevention. “Type 2 Diabetes.” Accessed January 27, 2023. https://www.cdc.gov/diabetes/basics/ type2.html.
- N. T. Nguyen, X. M. Nguyen, J. Lane, P. Wang, “Relationship between obesity and diabetes in a US adult population: findings from the National Health and Nutrition Examination Survey, 1999-2006.” Obesity Surgery, 21, 351-355 (2011).
- Centers for Disease Control and Prevention. “Insulin Resistance and Diabetes.” Accessed December 5, 2022. https://www.cdc.gov/diabetes/basics/insulin-resistance.html.
- Ahmed B, Sultana R, Greene MW. “Adipose tissue and insulin resistance in obese.” Biomedicine Pharmacotherapy, 137, 111315 (2021).
- M. F. de Oliveira, D. S. Johnson, T. Demchak, S. S. Tomazoni, E. C. Leal-Junior, “Low-intensity LASER and LED (photobiomodulation therapy) for pain control of the most common musculoskeletal conditions.” European Journal of Physical and Rehabilitation Medicine, no.58 (2022): 282–289.
- Y. R. Jung, et. al., “Regulation of lipid production by light-emitting diodes in human sebocytes.” Archives of Dermatological Research, 307, 265-273 (2015).
- P. Avci, T. T. Nyame, G. K. Gupta, M. Sadasivam, M. R. Hamblin, “Low-level laser therapy for Fat Layer Reduction: A comprehensive review.” Lasers in surgery and medicine, 45, 349-357 (2013).
- S. C. P. S. de Oliveira, et. al., “LED antimicrobial photodynamic therapy with phenothiazinium dye against Staphylococcus aureus: An in vitro study.” Journal of Photochemistry and Photobiology, 175, 46-50 (2017).
- G. Schaffner, P. H. Matile, “Structure and Composition of Baker’s Yeast Lipid Globules.” Biochemie und Physiologie der Pflanzen, 176, 659-666 (1981).
- A. Brouwer, et. al., “Light therapy for better mood and insulin sensitivity in patients with major depression and type 2 diabetes: a randomised, double-blind, parallel-arm trial.” BMC Psychiatry, 15, 169 (2015).
- T. Fushimi, S. Inui, T. Nakajima, M. Ogasawara, K. Hosokawa, S. Itami, “Green light emitting diodes accelerate wound healing: Characterization of the effect and its molecular basis in vitro and in vivo.” Wound Repair Regen, 20, 226-235 (2012).
- L. L. Bolton, “Wound Phototherapy.” Wounds. 32, 262-264 (2020).

Posted by buchanle on Wednesday, June 26, 2024 in May 2024.
Tags: Insulin, LED Lights, Lipids, Saccharomyces cerevisiae, Wavelengths