Study on Optimal SARS-CoV-2 Containment Strategies Using Ex-tended SEIR Model
ABSTRACT
Since 2019, the SARS-CoV-2 pandemic has caused more than 11 million deaths and created severe economic decline. In many cases, hospitals overflow due to the mass influx of patients, so to respond appropriately and enforce the right measures, models that predict how the virus peaks are needed. Epidemiologists traditionally use SIR or SEIR models to model a pandemic. Additionally, since the initial wave of the pandemic, scientists introduced pharmaceutical interventions like vaccines and tests, but variant-specific vaccines take time to develop and are limited by production capacity. Thus, besides creating an extended SEIR model incorporating vaccine efficacy, vaccination coverage, and testing accuracy, this work also aims to analyze pragmatic policies for control of the SARS-CoV-2 pandemic. We demonstrate the applications of our model by creating a 4D plot that illustrates how each of the aforementioned factors impacts the peak number of cases. Results from this study can be used to forecast future pandemics.
INTRODUCTION.
The Severe Acute Respiratory Syndrome Corona Virus 2 (SARS-CoV-2) pandemic continues to infect people three years after its initial discovery. SARS-CoV-2 currently serves as the third leading cause of death after heart disease and cancer, accounting for nearly 1 in 8 deaths in the U.S. [1]. Its main characteristics include a 2-14 day incubation period in which those infected have no symptoms but can still spread the virus [2]. Initially, many countries enforced a “lockdown” policy, forcing people to stay in their homes. Other policies governments enforced include mask mandates and social distancing, but despite all these policies, the virus still continues to spread around the world, often creating new mutations that are more transmissible [3]. A promising turn in the pandemic occurred when pharmaceutical interventions like antibody tests, which help identify those who are infected with the virus, were developed. The two main types of tests are the rapid antigen test and the Reverse Transcription Polymerase Chain Reaction (RT-PCR) test. Both have strengths and weaknesses: rapid tests are more convenient to take and can give results quickly but are less accurate than PCR tests, which generally take more time to obtain results [4]. Another key landmark in the pandemic was the creation of promising vaccines by Pfizer, Moderna and Johnson & Johnson. As people obtained their first and second doses of one of the vaccines, the number of severe infections decreased [5]. However, the effectiveness of vaccines decreased as new variants emerged. In addition to vaccine efficacy, the total number of vaccinated individuals is another important factor to consider. The concept of “herd immunity” involves vaccinating a certain amount of individuals in order for everyone to receive protection, both direct and indirect [6]. Although some countries are leading the distribution of vaccines, others are lagging behind due to a lack of available vaccines, issues in affording vaccines, or a low willingness for people to receive vaccinations [7]. Thus, even though people want high testing accuracy, vaccine efficacy, and vaccination rate, in reality, dispersing accurate vaccines takes time. In conjunction with the unpredictable nature of when the virus will peak, finding the impact of new vaccines and tests also calls for modeling of SARS-CoV-2. There are many types of these models, including mathematical models like the Susceptible-Infected-Recovered (SIR) model or more computer-based models like agent-based modeling. Many existing studies [8, 9] use compartment models like SIR or Susceptible-Exposed-Infected-Recovered (SEIR) model because they are simple. This paper attempts to update these models by incorporating more recent advances in pharmaceutical interventions like vaccines and tests. Another issue regarding each SARS-CoV-2 “wave” is exceeding hospital ICU capacity. By adjusting the vaccine efficacy, testing accuracy, and vaccination rate, both the peak number of cases and the number of severe infections can be reduced. Furthermore, this type of modeling also applies to other viruses and can provide insights on how certain factors affect the general shape of the pandemic.
The main contributions in this paper are: 1) an extended SEIR model that considers vaccine efficiency, vaccine coverage and testing accuracy; 2) simulations using this extended SEIR model to show the impacts of the variables; and 3) pragmatic policies for effective control of SARS-COV-2 in different regions around the globe.
MATERIALS AND METHODS.
Overview of Existing Models for Epidemic Diseases. A few different models are widely used to forecast the spread of a pandemic:
1) A SIR model uses a series of differential equations to simulate how populations move between three classes: Susceptible, Infected, and Recovered [8-13].
2) An Agent-Based model analyzes the process on a smaller scale by zooming in on interactions between individuals [8]. Each individual has their own set of characteristics, e.g. if they are vaccinated or not vaccinated.
3) Supervised Machine Learning models learn from a training set consisting of features and corresponding labels [15,16]. Of course, the model cannot solely depend on time; factors like vaccination rate or efficacy should also be taken into consideration.
In this paper, we selected the SIR model for several reasons: 1) This model allows us to easily change the parameters built into differential equations so that we can examine how the output changes. 2) Although a machine-learning approach has similar functionality, the SIR model is more natural in the sense that the shape of a curve generated by a SIR model already roughly follows the general shape of any pandemic. 3) In agent-based models, modeling the individual behavior of every person in a population of millions is an intensive process; although this approach might lead to more accurate results, it is over-complicated. Furthermore, SIR models are also more versatile compared to other models.
Problem in the SIR model for SARS-CoV-2. There are many extensions to the SIR model to better simulate a pandemic. This paper utilizes a SEIR model, which has an additional exposed class, containing people that are incubating; they do not experience symptoms and are not yet infectious. However, we modified the exposed class to account for the fact that an individual with SARS-CoV-2 can spread the virus even when incubating. Taking all these factors into account, this paper introduces an extended SEIR (ESEIR) model shown in Fig. 1 that can be used to analyze containment policies.
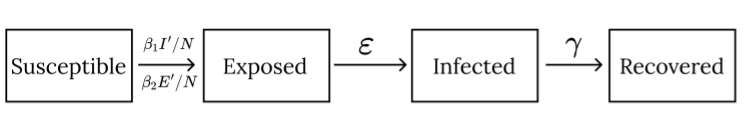
Figure 1. The Proposed Extended-SEIR (ESEIR) Model: Susceptible, Exposed, Infected, and Recovered classes along with additional parameters of testing accuracy, vaccine efficacy, and vaccination rate.
Derivation of the Proposed Extended SEIR model. We introduce three new parameters to the original SEIR model, namely testing accuracy \(\alpha\),vaccination rate r, and vaccine efficacy \(\eta\).
As discussed earlier, we modify the Exposed class so that people can still transmit the disease when incubating. The CDC suggests that people transmit the virus starting 1-2 days before symptoms appear, so the E class transmits the disease with rate \(\beta_2\) ( measures the probability of infection per contact multiplied by the number of contacts per unit time), less than that of the corresponding parameter \(\beta_1\) in the I class.
We assume individuals only test when they have symptoms (in the “I” class), so from the “S” class to the “E” class, only r and \(\eta\) will impact that transmission rate \(\beta\). Here, we analyze two cases separately:
1) For those who are vaccinated (a fraction r of the population), per encounter, the probability they will contract the disease is \(\beta_2\left(1-\eta\right)\). Thus, for all encounters, the proportion of vaccinated people who contract the virus is \(\beta_2r\left(1-\eta\right)\).
2) For those who are not vaccinated (a fraction 1 – r of the population), per encounter, they have the normal value of contracting the disease \(\beta_2\).
We add these two independent cases up to obtain:
\[\beta_2r\left(1-\eta\right)+\beta_2\left(1-r\right)=\beta_2\left(r-r\eta+1-r\right)=\beta_2\left(1-r\eta\right)\tag{1}\]
And
\[\frac{dS_E}{dt}=-\beta_2S\cdot\frac{E}{N}\left(1-r\eta\right)\tag{2}\]
From the “S” to the “I” class, we have to include the additional parameter , and we assume the individual immediately starts to quarantine after receiving a positive result. But \(1 – \alpha\) of the people (who are falsely negative) will continue to spread the disease, so
\[\frac{dS_I}{dt}=-\beta_1S\cdot\frac{I}{N}\left(1-\alpha\right)\left(1-r\eta\right)\tag{3}\]
Thus, the total movement from the “S” class to the “E” and “I” classes is then
\[\frac{dS}{dt}=\frac{dS_E}{dt}+\frac{dS_I}{dt}=-\left(1-r\eta\right)\cdot\ S\left[\beta_1\frac{I}{N}\left(1-\alpha\right)+\beta_2\frac{E}{N}\right]\tag{4}\]
Exposed or incubating individuals then move into the Infected, or “I” class with a rate \(\varepsilon\), where \(\frac{1}{\varepsilon}\) represents the incubation period. Thus, we have
\[\frac{dE}{dt}=-\frac{dS}{dt}-\varepsilon\ E=\left(1-r\eta\right)\cdot\ S\left[\beta_1\frac{I}{N}\left(1-\alpha\right)+\beta_2\frac{E}{N}\right]-\varepsilon E\tag{5}\]
Infected individuals recover with a rate \(\gamma\), where \(\frac{1}{\gamma}\) represents the average time for an individual to recover. Thus, the changes in the “I” and “R” classes are then
\[\frac{dI}{dt}=\varepsilon\ E-\gamma\ I;\ \ \ \frac{dR}{dt}=\gamma\ I\tag{6}\]
Model Parameters. This study examines the impact of (\(\alpha\),r,\(\eta\)) on a pandemic’s peak, which in turn helps determine if a region’s hospital capacity has been exceeded. Since we only want to obtain a high-level picture of the relative impacts of \(\alpha, \beta,\) and \(\eta\) on the peak, the exact starting values of each class are not that important for our purposes. In other words, even though the shape may change as the initial conditions change, the intrinsic roles of \(\alpha\), \(\beta\) and \(\eta\) on the peak of the pandemic will stay the same. Hence, we used million people, which is the approximate population of California, and people as a starting point. The parameters \(\beta\), \(\eta\), \(\gamma\) that govern the transmission of the pandemic all have physical significance: taking the incubation period to be 4 days [18], we have \(\eta = 1/4\) Taking the recovery time to be 10 days [19], we have \(\gamma = 1/10\). Finally, taking \(R_0 \approx5.08\) [17], we have \(\beta_1 = \gamma R_0\approx0.508\) In the model, we have two parameters for the transmission coefficient, \(\beta_1\) and \(\beta_2\), to differentiate between the interactions of E and I with S. In our model, we used \(\beta_2 = \frac{\beta_1}{1.75}\) because a person is most contagious around two or three days before symptom onset [9], so they will be less contagious during the early stages of incubation.
Model Validation. It is hard to obtain a closed form solution of the differential equations listed in Eq. (1) – (6). Instead, it is convenient to simulate the results on a computer. For a quick validation of the model, we consider four extreme cases and see if the model behaves as expected.
Case 1 (\(\alpha\),r,\(\eta\)) = (0,0,0): When no additional measures are imposed, the model grows without any restrictions and behaves similarly to the normal SEIR model (except for the fact that the “E” class can interact with the “I” class). As shown in Fig. 2A, the peak number of cases is around 17.5 million people. In this case, close to of the entire population would become infected.
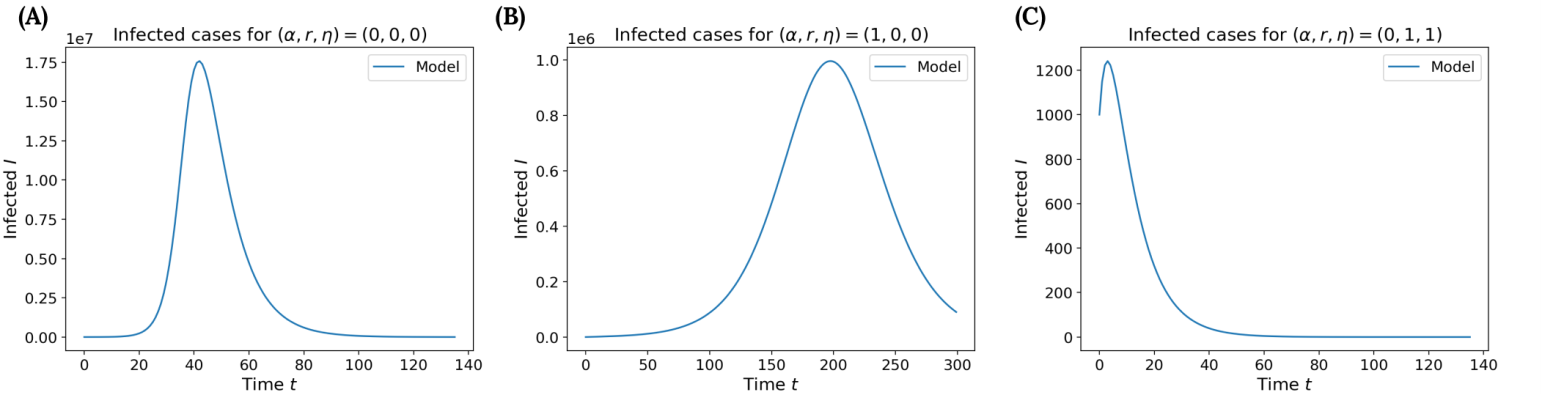
Figure 2. Validation of the ESEIR Model: Simulation with (A) no testing and no vaccines, (B) only testing, and (C) an ideal vaccine with an efficacy of 100% that the whole population receives.
Case 2 (\(\alpha\),r,\(\eta\)) = (0,1,0); (\(\alpha\),r,\(\eta\)) = (0,0,1): It turns out these cases are equivalent to the previous case and thus follow the same shape as Fig. 2A. Even though either the vaccine efficacy or vaccination rate is 100%, we need some of both to see a difference. For the first combination, the entire population is vaccinated but the vaccine provides no protection, and for the second combination, the vaccine has an efficacy of 100%, but nobody receives a dose. Thus, we should expect the same result as in Case 1.
Case 3 (\(\alpha\),r,\(\eta\)) = (1,0,0): When the testing accuracy is 100%, all infections are eliminated between the “S” and “I” classes but not the “S” and “E” classes. Thus, this addition cannot fully suppress the pandemic, although we would still expect the cases to be far less than the peak in Case 1. Indeed, as shown in Fig. 2B, the peak number of cases is around , which is far less than Case 1.
Case 4 (\(\alpha\),r,\(\eta\)) = (0,1,1): Unlike Case 2, we now have both a vaccine efficacy and coverage of 100%. These measures should quickly suppress the pandemic, as shown in Fig. 2C. However, it’s worth noting the graph does not suddenly drop to zero, which makes sense because the initial exposed and infected individuals will still move for a while before converging to zero.
RESULTS.
Now that we validated our ESEIR model, we summarize our simulation results in a 4D plot, shown in Fig. 3A. The plot allows us to visualize the effects of each parameter on the predicted peaks. For the axes, we vary testing accuracy \(\alpha\) from 0.6 to 0.9, vaccination rate r from 0.5 to 0.8, and vaccine efficacy \(\eta\) from 0.4 to 0.9. Color serves as the fourth dimension, with warmer colors indicating higher peaks, and cooler colors indicating lower peaks. As expected, higher testing accuracies, vaccine efficacies, and vaccination rates lead to cooler colors. For instance, regions having access to vaccines with an efficacy (\(\eta\)) of 90% or higher are almost all light-blue. Even with intermediate values of \(\eta\), say 60%, we already start to see many more light blue regions in the graph.
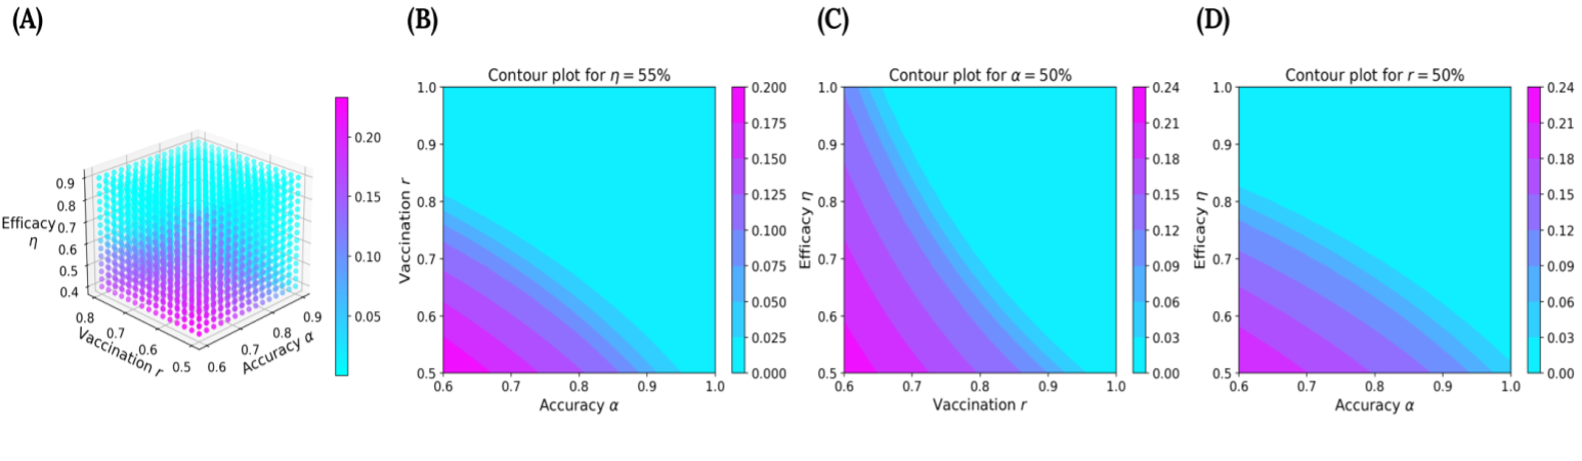
Figure 3. Simulation Results: (A) 4D plot showing how the peak (magnitude shown through color) varies with . Contour plots showing what combinations of (B) when , (C) when , and (D) when yield a peak in the light-blue region.
In addition to the 4D plot, we analyze specific cross-sections, or contours, of the plot shown in Figs. 3B to 3D. These contour plots keep one parameter fixed and reveal how changes in the other two influence the peak. For instance, Fig. 3B reveals that when the vaccine efficacy is stagnant at 55%, the light-blue boundary intersects the testing accuracy at 95% and the vaccination coverage at 80%. If the vaccination coverage is lower than 80%, the testing accuracy must be increased to stay in the light-blue region. Similarly, Fig. 3C reveals that for a low testing accuracy, the light-blue region intersects the vaccination rate at 95%, and Fig. 3D reveals that for a low vaccination rate, the light-blue region intersects the vaccine efficacy at around 83%.
Overall, Figs. 3B to 3D emphasize testing accuracy more as compared to vaccination rate or vaccine efficacy. The low incubation period helps explain this result: individuals are flowing from the E class to the I class rapidly, so we need them to start quarantining almost immediately when they enter the I class, which happens with a high testing accuracy.
Note that depending on the variant, the percentage that requires medical intervention is only a portion of the infected population. This is easy to adjust based on the variant type and therefore not included in the model. For some bad variants like alpha, beta and delta, we would want a combination deeper into the blue region, e.g. a vaccination rate of 95% and a vaccine efficacy of 90% when the testing accuracy/coverage is 50%. These plots generated from our model are useful in finding appropriate pandemic containment strategies in different regions. By using the right parameters, this ESIER model can be used for epidemic diseases other than SAR-CoV-2 as well.
DISCUSSION.
In this work, we presented an extended SEIR model to quantify the impacts of three crucial pharmaceutical interventions: vaccination rate, vaccine efficacy, and testing accuracy. After selecting the parameters for our model, we performed analysis by creating two plots: a 4D plot that helps visualize how different combinations of (\(\alpha\),r,\(\eta\)) influence the peak number of cases, and a few contour plots that examine the peak when one parameter is fixed. We noticed that throughout the plots, testing accuracy seemed to play the biggest role in suppressing the peak in a low incubation variant.
Our model makes a few fundamental assumptions that approximately hold when looking at the Delta variant but no longer hold in recent practices – some companies force employees to test once per week, not just when they have symptoms. Thus, the model would have to be modified so that testing accuracy also affects infections between the S and E classes. This process shouldn’t be too tedious due to the versatility of ESEIR model. This model also assumes that people would immediately quarantine upon receiving a positive test result. However, in reality, people may fail to follow this rule. This behavior may drastically change the shape of the pandemic to something that a normal SIR or SEIR cannot predict but adding another factor to model this under our ESEIR model is also straightforward and possible for future works.
ACKNOWLEDGMENTS.
I would like to acknowledge Mr. Scott DeRuiter, my AP computer science teacher, for supporting me throughout the investigation process.
REFERENCES.
- M. S. Shiels, A. T. Haque, et al., Leading Causes of Death in the US During the COVID-19 Pandemic, March 2020 to October 2021, JA-MA Intern Medicine, (2022)
- H. Esakandari, M. Nabi-Afjadi, J. Fakkari-Afjadi, et al., A comprehensive review of COVID-19 characteristics, Biol Proced Online. 22, 19-28 (2020)
- D. Kaimann, I. Tanneberg, What containment strategy leads us through the pandemic crisis? An empirical analysis of the measures against the COVID-19 pandemic, PLoS ONE. 16, 6-22 (2021)
- V. T. Chu, N. G. Schwartz, M. A. Donnelly, et al, Comparison of Home Antigen Testing With RT-PCR and Viral Culture During the Course of SARS-CoV-2 Infection, JAMA Intern Med. 182, 701-709 (2022)
- B. J. Wright, S. Tideman, G. A, Diaz, et al., Comparative vaccine effectiveness against severe COVID-19 over time in US hospital ad-ministrative data: a case-control study, The Lancet Respiratory Medi-cine. 10, 557-565 (2022)
- C. Aschwanden, Five reasons why COVID herd immunity is probably impossible, Nature. 591, 520-522 (2021)
- Understanding Vaccination Progress, Johns Hopkins University https://coronavirus.jhu.edu/vaccines/international
- J. M. Carcione, J. E. Santos, C. Bagaini, J. Ba, A Simulation of a COVID-19 Epidemic Based on a Deterministic SEIR Model, Front. Public Health. 8, 230-243 (2020)
- Y. Ge, L. Martinez, et al., COVID-19 Transmission Dynamics Among Close Contacts of Index Patients With COVID-19 A Population-Based Cohort Study in Zhejiang Province, China, JAMA Intern Med. 181(10), 1343-1350 (2021)
- K. Pattni, D. Hungerford, et al., Effectiveness of the BNT162b2 (Pfizer-BioNTech) and the ChAdOx1 nCoV-19 (Oxford-AstraZeneca) vaccines for reducing susceptibility to infection with the Delta variant (B.1.617.2) of SARS-CoV-2, BMC Infectious Diseases. 22, 270-281 (2022)
- A. Radulescu, C. Williams, K. Cavanagh, Management strategies in a SEIR-type model of COVID 19 community spread. Sci Rep. 10, 21256 (2020)
- S. Mwalili, M. Kimathi, V. Ojiambo, D. Gathungu, R. Mbogo, SEIR model for COVID-19 dynamics incorporating the environment and social distancing, BMC Res Notes. 13, 352-357 (2020)
- B. Nogrady, What the data say about asymptomatic COVID infections. Nature. 587, 535-535 (2020)
- C. C. Kerr, R. M. Stuart, D. Mistry, et al., Covasim: An agent-based model of COVID-19 dynamics and interventions, PLoS Comput Biology,. 17, 7-38 (2021)
- M. Marzouk, N. Elshaboury, A. Abdel-Latif, S. Azabd, Deep learning model for forecasting COVID-19 outbreak in Egypt, Process Saf Environ Prot. 153, 363–375 (2021)
- X. Xing, Y. Xiong, R. Yang, et al., Predicting the effect of confinement on the COVID-19 spread using machine learning enriched with satellite air pollution observations, Earth, Atmospheric, and Planetary Sciences. 118, 33-42 (2021)
- Y. Liu, J. Rocklöv, The reproductive number of the Delta variant of SARS-CoV-2 is far higher compared to the ancestral SARS-CoV-2 virus, J Travel Med. 28, 1-3 (2021)
- T. Ogata, H. Tanaka, F. Irie, et al., Shorter Incubation Period among Unvaccinated Delta Variant Coronavirus Disease 2019 Patients in Japan. Int J Environ Res Public Health. 19, 1-15 (2022)
- CDC, Ending Isolation and Precautions for People with COVID-19: Interim Guidance, https://www.cdc.gov/coronavirus/2019-ncov/hcp/duration-isolation.html

Posted by John Lee on Tuesday, May 30, 2023 in May 2023.
Tags: COVID, Epidemic Disease Modeling, SARS-CoV-2, Virus Containment