Strong signatures of toponium via \(t\bar{t}\) decay in ATLAS
ABSTRACT
It has been believed that the top quark in the standard model of physics, due to its giant mass and unique properties, would allow for new physics to be discovered. Currently, one of the newest theories suggests the existence of toponium, a hypothetical meson formed between a top quark and its anti-quark. Toponium is speculated to exist in heavy-ion collisions but is considered unlikely to be seen in a proton-proton (pp) particle collider. Initial studies [1] looked at reported deviations between data and theoretical predictions of dileptonically decaying top quarks to find a signal of toponium formation. This paper proposes a further analysis of other toponium distributions to contribute more information to whether toponium might exist. Specifically, measurements of the sum of the transverse momenta, pT, of the dilepton system of toponium, were taken. The resulting simulations of this study show an abundance of toponium signatures at 40-80 GeV which concur with that of the ATLAS detector data at the Large Hadron Collider.
INTRODUCTION.
Looking at the Standard Model of Elementary Particles, the top quark has been one of the most difficult to find and one of the most interesting to study, due to its huge mass (172.69±0.3 GeV) [2]. It is by far the largest subatomic particle and has a high decay rate, which does not allow for the reclustering of jets into hadrons. This specific property makes the top quark unique, as it permits scientists to investigate the quark in its bare state.
In theory, the top quark should never exist on its own, but undergo hadronisation to form a bound state hadron with a neutral colour charge. This happens because of the colour confinement phenomenon in Quantum Chromodynamics (QCD), which bounds all quarks (subatomic particles that make up matter particles such as protons) to have a neutral colour charge [3]. In this case, hadronisation of the top quarks should result in formation of toponium, a meson (type of hadron) formed between a top and its anti-top quark. However, the meson cannot form due to the hadronisation rate being slower than the rate at which both the top and anti-top quark decay [4].
Nonetheless, studies from the LHC’s 2nd run [1] investigated reported deviations between predicted pairs of dileptonically decaying top quarks and ATLAS data, and so proposed how the existence of toponium would explain those deviations. They used measurements of energy and momenta in x, y and z directions of any particle, from a given pp collision (event) at the ATLAS detector at the LHC, which allowed them to calculate the different signatures of particle decay/formation.
The ATLAS detector, located at the Large Hadron Collider, and is a large particle detector which identifies and counts every subatomic particle that is produced when 40 million bunches of 40 protons collide at high energies and are broken apart every second. Although there are many protons in the system colliding, a measured observable is usually taken down to a single event, consisting of two protons making a head on collision. The detector itself is divided into many layers: an inner tracker, electromagnetic and hadronic calorimeters, a superconducting solenoid, and a muon spectrometer (Figure 1.). The superconducting solenoid has a total of zero resistance and so it can generate a magnetic field of 2 Tesla (T). This allows to differentiate between charged and uncharged particles, as charged ones will begin to curve as they interact with the magnetic field, allowing to calculate their momentum and charge using the curve radius. The charged particles such as muons or electrons will also leave hits in the inner tracker which consists of a pixel detector, a silicon strip tracker, and a transition radiation tracker. The pixel detector uses silicon pixels to determine the momentum of charged particles through leftover energy traces. It is located with the silicon strip tracker and the transition radiation tracker, which use electronic sensors to trace back charged particles’ tracks to a specific point of collision and provide information about the type of particle. Furthermore, the two calorimeters are present to absorb all known particles, except for muons and neutrinos and measure their energies. The electromagnetic calorimeter is made from layers of metal that absorbs particles converting them to lower energy. It also consists of liquid argon which ionises the lower energy particles producing an electric current. The hadronic calorimeter is constructed from a dense material – steel, and from plastic scintillators, which measure the leftover energy from the electromagnetic calorimeter, by producing photons that are later converted into current. Lastly, the muon spectrometer is placed at the end of the ATLAS detector because muons are so highly penetrative, that they can pass several metres of iron without having any sort of interaction with it. The spectrometer consists of 4 different layers with individual detectors, that do detect muons but are far less precise than the silicon tracker. All these parts of the ATLAS detector allow data about particles from pp collisions to be measured and used for comparison with simulated data of how a particle would behave [5].
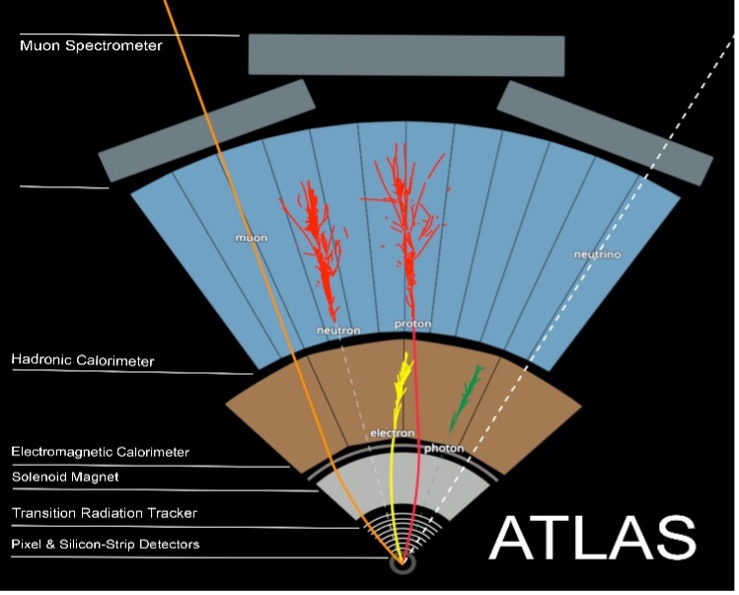
Figure 1. Transverse slice through the ATLAS detector [6].
Fuks, Hagiwara, Ma and Zheng [1] used published data collected at the ATLAS detector and found that delta Phi and invariant mass distributions from dilepton systems of toponium could account for the same observed deviations from data and therefore provide evidence as to why toponium may exist. The research conducted in this paper, is a phenomenological study that is compared to published results by ATLAS, and follows that of Fuks and his colleagues by measuring the distribution of the sum of pT (momenta in the transverse direction) of the dilepton system from toponium to account for missing data in the ATLAS prediction for the same distribution.
MATERIALS AND METHODS.
Event Simulation. Simulated toponium data used to compute the distributions was provided from a Monte Carlo (estimated outcomes of uncertain events) event generator MadGraph5_aMC@NLO2.6.5 [7]. The simulation also had to account for parton (quarks and gluons) showers, which are cascades of radiation produced from high energy particle collisions, such as pp collisions [8]. Each collision also contains underlying events which are additional interactions at the collision point and have to be accounted for in the simulation [9]. Therefore, parton showering was performed by Pythia8.240 [10] with the underlaying event tune Tune CP5 [11] applied. The simulation also had to account for parton distribution functions which provide the likelihood that partons will be found in a hadron [12]. The Parton Distribution Function set was LHAPDF6:NNPDF31_nnlo_as_0118 [13, 14]. On shell particles, which are particles that can be described in terms of their motion against time, and off shell particles, which are particles opposite to that of on shell, were included [15]. On shell decays were specifically looked at of the toponium particle and off-shell decays were included but were not considered as they represent ≤ 1% of the overall data set. Furthermore, all this data has been provided in the form of root files in a NumPy directory.
Data Analysis. For the data analysis, Python was used to open the data directory and extract the needed values, such as energies and momenta of a dilepton system, for every single event. A pp collision event contained 1 single toponium particle that eventually decayed into a top and anti-top quark pair (Figure 2.) [1].
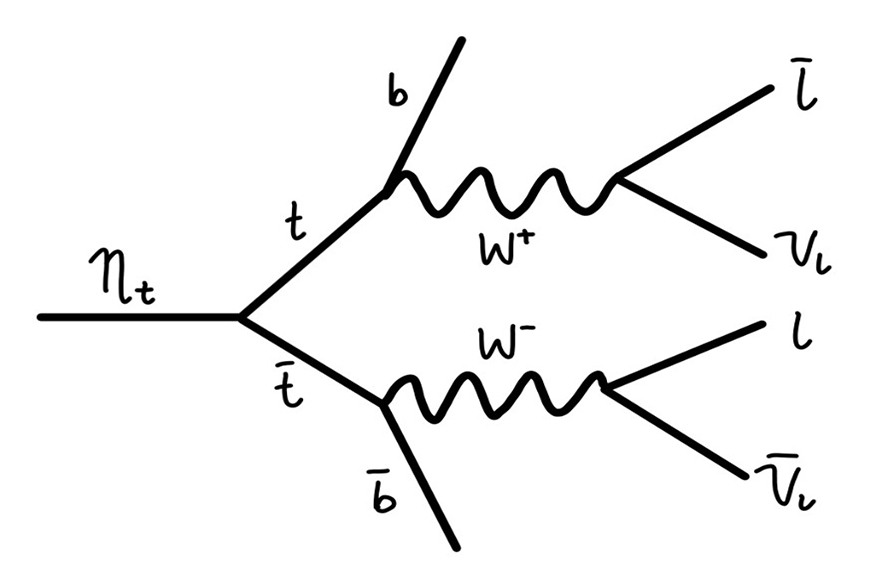
Figure 2. Feynman diagram showing the decay process of toponium into a pair of top quarks through the weak interaction, producing a W+/- and a bottom quark, into a dilepton system.
NumPy in Python was specifically used for this data analysis, as it supports the use of multidimensional arrays for big blocks of data and allows mathematical calculations to be performed on all of the separate data pieces in an array at once. This was useful as the directory contained millions of events which therefore could be easily analysed. The code tracked down the anti-lepton from the top quark and the lepton from the anti-top quark so the invariant mass of the dilepton ( ) system could be calculated. This was done to compare the resulting distribution to that of Fuks, Hagiwara, Ma and Zhengs paper to make sure that the code worked. The distribution resulted in looking the same and so the same process was carried out for the sum of the transverse momenta of the two leptons. After tracking down the leptons, their pT values were added for every event in a singular root file. Coded loops were used to circulate from one file to the next one and add all the collected values to a new file, which now contained an array of momenta in the transverse direction of every dilepton system.
However, during this section, the following limitations were kept in mind: the processing of all 100 files of data provided would have taken almost 100 hours for each signature, so only 10 files were analysed resulting in a less precise distribution; the on shell decays were not accurately described in the Monte Carlo, as no matrix element reweighting was applied to correct for the momentum distribution of the and constituents, which would impact the on-shell particles.
Computing of Distributions. Using the arrays created that stored the sum of the pT of the dilepton system from toponium, distributions had to be shown in a histogram formation with appropriate bin widths and titles, for valid comparison with measurements of production cross-sections from the ATLAS detector [16]. Therefore, the data was loaded and adjusted to fit the comparison.
RESULTS & DISCUSSION.
Figure 3 (A) shows the distribution of the sum of pT values of the decay from the ATLAS detector with the original reported deviations in the first bin of 40-80 GeV. Specifically, it shows more events observed in the first bin than predicted and means that there are factors missing from the ATLAS prediction that would account for this gap between the prediction and the data. Furthermore, there has been less data observed for high energies than the ATLAS prediction showing a possible normalisation issue. This makes the sum of the pT values distribution a good region to look for toponium at low energies.
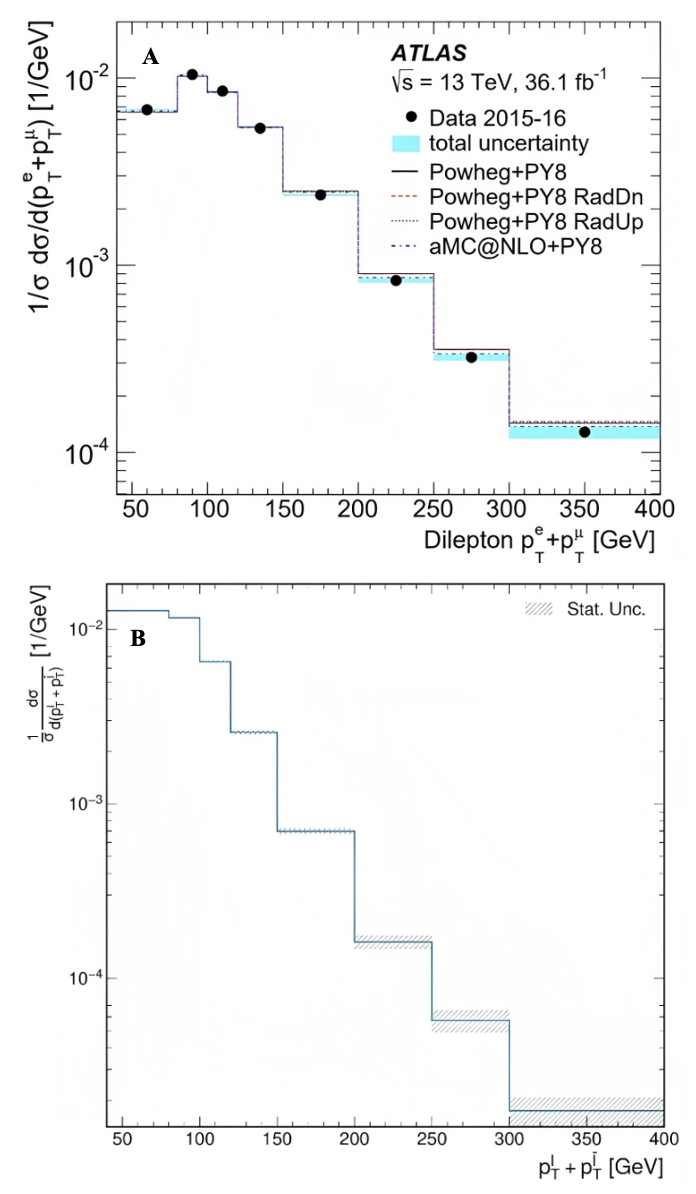
Figure 3. (A) The sum of pT measurements of production cross-sections from the ATLAS detector (dots) along with the predictions (lines). (B) Simulated data for the pT sum of the toponium events [16].
Essentially, one would expect toponium to have a peak at a lower sum of dilepton pT, as it has a very short-lived resonance [17], a property that occurs when the net energy of a system can only produce its rest mass, and then decay within a very short time. Therefore, the total energy of the system is restricted to be around 340 GeV [2], which comes from the mass of the top and anti-top quarks in toponium at rest. This means that the total energy of the decay components should equal to that of the system of toponium, and through further calculations, taking into account the energy of other components, one will find that the energy of the sum of the dilepton pT should be in the range of approximately 40-80 GeV.
Consequently, the toponium simulation in Figure 3 (B) shows that there is a higher abundance of simulated data in the first bin (40-80 GeV) of the toponium distribution as expected. This shifts the other bins down resulting in the data from the ATLAS detector to match the simulation at higher energies, solving the normalisation issue. Therefore, one can see that the addition of toponium to the ATLAS prediction in Figure 3 (A) will close the gap between the collected data and the original prediction, supporting the theory of formation of toponium, as only these types of events from rest masses of the top-quarks in their hadronic state would result in enough energy to account for the missing data in the ATLAS prediction.
This is evidence suggesting that this deviation in the distribution in the Fuks paper is consistent with the toponium hypothesis. However, we also know that our Monte Carlo modelling is not accurate and needs improvement to obtain more accurate results. Following this research, the next steps would be to investigate other distributions of toponium such as the Delta Phi of the dilepton system, and compare them to ATLAS data to further support or eradicate the toponium hypothesis.
ACKNOWLEDGMENTS.
Many thanks go to Andrew J. Wildridge from Purdue University, who has provided me a lot of guidance throughout this project as a mentor and has provided all the simulated MadGraph data which allowed this project to advance.
REFERENCES.
- B. Fuks, K. Hagiwara, K. Ma, Y. J. Zheng, Signatures of Toponium Formation in the LHC run 2 data. Phys. Rev. D 104. 1-6 (2021)
- R.L. Workman et al. (Particle Data Group), Particle Listings: t quark. Prog.Theor.Exp.Phys.2022, 083C01, 1 (2022)
- J. Greensite, An Introduction to the Confinement Problem. Lecture Notes in Physics, Volume 821, 1-2, 21-34 (2011)
- Particle Data Group, 67. Top Quark. Prog.Theor.Exp.Phys.2022, 083C01, 2 (2019).
- ATLAS Collaboration, “ATLAS detector and physics performance : Technical Design Report, 1” (CERN-LHCC-99-014 ; ATLAS-TDR-14, Geneva : CERN, 1999. – 460 p., 1999)
- S. Mehlhase, ATLAS Collaboration, ATLAS detector slice (and particle visualisations). ATLAS-OUTREACH-2021-052, file 3 (2021)
- J. Alwall, R. Frederix, S. Frixione, V. Hirschi, F. Maltoni, O. Mattelaer, H. S. Shao, T. Stelzer, P. Torrielli, M. Zaro, The Automated Computation of tree-level and next-to-leading order differential cross sections, and their matching to parton shower simulations. Journal of High Energy Physics (Print), 1407, 079 (2014)
- Z. Nagy, D. E. Soper, What is a Parton Shower? Phys. Rev. D 98, 3-4 (2018)
- CDF Collaboration, Studying the Underlying Event in Drell-Yan and High Transverse Momentum Jet Production at the Tevatron. Phys.Rev.D 82, 4 (2010)
- T. Sjöstranda, S. Askb, J. R. Christiansen, R. Corkea, N. Desai, P. Ilten, S. Mrenna, S. Prestelf, C. O. Rasmussen, P. Z. Skandsh, An Introduction to PYTHIA 8.2. Comput. Phys. Comm. 178 (2008)
- CMS Collaboration, Extraction and validation of a new set of CMS PYTHIA8 tunes from underlying-event measurements. The European Physical Journal C 80 (2020)
- D. E. Soper, Parton Distribution Functions, Nucl.Phys.Proc.Suppl. 53, 1 (1997)
- NNPDF Collaboration, Unbiased global determination of parton distributions and their uncertainties at NNLO and LO. Nucl. Phys. B 855 (2012)
- NNPDF Collaboration, Parton distributions for the LHC Run II. JHEP 04 (2015)
- M. Thomson, Modern particle physics (Cambridge University Press, 2013) pp. 117–119.
- The ATLAS Collaboration, Measurement of the production cross-section and lepton differential distributions in eµ dilepton events from pp collisions at √ s = 13TeV with the ATLAS detector. Eur. Phys. J. C 80, 38 (2020)
- Editors of Encyclopaedia Britannica, “resonance”. Encyclopedia Britannica (2008)

Posted by John Lee on Tuesday, May 30, 2023 in May 2023.
Tags: Dileptonic Decay of Top Quarks, Distribution of Transverse Momenta, Top Quarks, Toponium