Resilience Assessment of Power Distribution Systems: Preliminary Data Analysis of the Impact of Power Outages on Communities
ABSTRACT
Critical infrastructures are complex systems subject to a variety of disruptions that cause disturbances to residential, commercial, and industrial users. When power systems are disrupted, decision makers want to know who is affected and how to quickly restore power as people rely on these systems for daily use and economic livelihood. Data from the Energy Information Agency (EIA), consisting of power outages in the United States and Puerto Rico from 1999 through 2016, is analyzed to assess the resilience associated with regional power systems. An outlier and correlation analysis are performed to build a regression model to estimate the impact of disruptions on the community. Once outliers are identified and removed, no linear correlation is found between the three quantitative variables: megawatt loss, customers affected, and duration. A set of linear regression models are built to measure the impact of specific disruption scenarios on the resilience of a system quantified here as duration. Results indicate that there is a non-linear relationship between the dependent variable duration and megawatt loss and customers affected. In addition, extreme weather events such as hurricanes and floods increase the duration of outages that also varies by region and time of year.
INTRODUCTION.
Critical infrastructure systems, such as gas, water, or power systems, which are vital to modern society can be disrupted by natural disturbances, man-made complications or accidents. Current research focuses on measuring the resilience of critical infrastructure systems, defined as the ability of a system to withstand and recover from a disruptive event [1]. A system is considered more resilient when it is less vulnerable to risks and able to regain functionality quickly after a disruption [2-4].
This project focuses on analyzing data from regional power outages to quantitatively measure the resilience of critical infrastructure systems. The project uses publicly available data from the EIA database on national power outages across the United States from 1999 to 2016. The data is classified according to the North American Energy Reliability Corporation (NERC) regions, start date, end date, duration, disturbance type, megawatt loss, and number of customers affected [5]. This research explores the relationships between quantitative variables such as duration of an event, megawatt loss, and number of customers affected, as well as how these variables may be affected by specific disturbance types, regions, months, and years. To model the resilience of the system, correlations between variables must be explored to understand the relationship between key variables. To measure the resilience of critical infrastructure systems, a series of multiple linear regression models are built using both qualitative and quantitative variables to estimate the impact of disruptions to consumers. The variable used to describe the resilience of the system is duration, which describes the length of the disturbance. The other variables recorded can be used to estimate duration, because each variable relies on duration for the outcome.
METHODS.
For this project, R, an open source, statistical computing programming language is used for an in-depth analysis [6]. This analysis is performed on power outage data provided by the EIA because it contains information on how the system is impacted by a disruption. First, an outlier analysis is performed on the number of customers affected and megawatt loss. This allows for observations that are not consistent with the data set to be removed to avoid discrepancies in the model. Second, correlations are evaluated between customers affected, megawatt loss, and duration to determine the suitability of a linear regression model to estimate duration. Third, a set of linear regression models are fitted to test the impact of interaction and polynomial terms. This allows us to determine the suitability of regression models to estimate the resilience of power systems to outages.
Outlier Analysis.
Outliers are points that are inconsistent with most of the data set and can potentially skew or bias any analysis preformed. In multiple linear regression models, outliers are more difficult to detect via simple scatterplots, so residuals from regression models are analyzed to detect outliers in both the predictor and response variables. To identify extreme values in the data set, Bonferroni’s outlier test is performed, which reports the p-values for residuals of the multiple linear regression model, and labels inputs as extreme if they are statistically different from other values [7].
Correlation Analysis.
While correlation and independence are associated and often used interchangeably, these terms represent two different concepts. Independence is the statistical relationship between two variables that represents that one event occurring has no impact on another event, and correlation is the extent to which those two variables have a linear relationship with each other [7]. Two events may have no linear correlation, but can still be dependent on one another for results. The Chi-Square test, a goodness of fit test, is a statistical method of determining whether there is dependence in the data based on theoretically expected values of the underlying distribution. Results of this test can determine whether two variables are independent, but there is an underlying assumption that the data follows a normal distribution [7].
A correlation analysis on the quantitative variables, customers affected, kilowatt loss, and duration, is performed using Pearson’s correlation coefficient, Spearmen’s rank correlation coefficient, and Kendall’s Tau tests. If the relationship between the two variables is non- linear, Spearman’s rank correlation and Kendall’s rank correlation tests can be used.
Pearson’s correlation test varies between -1 and +1 with a value of -1 describing a perfectly negative linear relationship, a value of 0 describing no linear relationship, and a value of +1 a perfectly positive linear relationship [7]. Spearman’s rank correlation test is used to determine a non-parametric relationship by measuring the intensity and trend of the data [7]. Like Pearson’s test, Spearman’s test is also measured on a -1 to +1 scale. Similarly, Kendall’s Tau coefficient tests for non-parametric relationship between two variables, but Spearman’s is more widely used and has similar interpretations [7].
Regression Analysis.
Linear regression is used for modeling the relationship between a dependent variable and multiple independent variables. To estimate the dependent variable, model parameters are fitted from the data. The fit of the model is related to the strength of the relationship between the dependent variable and independent variables. One way to assess the strength of the model is to examine the R2 statistic which is also known as the coefficient of determination. The value of R2 is between zero and one, with zero indicating the model explains none of the variability of the data and one indicating the model explains all the variability [7]. There are two interpretations of R2 values, a multiple R2 and an adjusted R2. The adjusted R2 is modified for the number of predictors of the model, and increases only if the new variable improves the model fit more than would be expected by chance. For this research, the adjusted R2 value is used to prevent overfitting of the data that is often caused by an excessive number of predictors.
Linear regression models are built using the quantitative variables, start year, start date (one through thirty-one), start time, customers affected and megawatt loss, as well as the qualitative variables NERC region, start day of the week (Sunday through Saturday), start month, and disturbance type. These variables are used to predict the resilience of the system, described here as duration, which is a measure of the length of a disruption. The first model tested is a multiple linear regression model with all independent variables and no interaction terms. Interaction terms allow for the relationship between two variables that may be correlated to be represented by the model if those two terms impact the dependent variable. The second model tested consisted of all variables, plus an interaction term. The third model is created with all independent variables, in addition to megawatt loss and customers affected squared. Squaring the quantitative terms tests if there is a non-linear relationship between the independent and dependent variables. The fourth model is created with all independent variables, plus the variables megawatt loss and customers affect both squared and cubed. The fifth and sixth models replicate the third and fourth respectively, but interaction terms are added to each. Models seven through twelve used only variables with significant values from models one through six. By only fitting significant variables from models one through six, models seven through twelve can be examined to see if only significant variables improve the fit of the data. Model seven contained only significant variables from model one, model eight from model two, and so forth. Variables are considered significant if the p-value from the initial model (Models 1-6) is less than 0.1.
RESULTS.
The results of the analysis are discussed below in three sections: outlier analysis, correlation analysis, and regression analysis. Bonferroni’s test is used to identify outliers in the data set. Once outliers are removed, correlation tests and the twelve linear regression models discussed previously are analyzed. The correlation analysis is performed using three different tests: Pearson’s correlation, Spearman’s correlation, and Kendall’s correlation. Next, linear models are fitted to estimate duration.
There are 697 observations out of 1,586 with no unknown values in the data provided by the EIA. Megawatt loss and customers affected had the most unknown values at 713 (45%) and 389 (25%), respectively. Unknown values could be a result of inadequate equipment or measurement error. Due to the limited number of variables, no additional information could be extracted about the unknown values. All data points with unknown fields are removed from the data set, which resulted in 44% of the values used for the later analyses.
Outlier Analysis.
The average duration, megawatt loss, and number of customers affected are all below the median of the data, however they do not fall outside the range of data. After removing outliers, average values decreased. This justified removing outliers because they had an impact on the results of the analysis. When examining customers affected and megawatt loss, both variables have a wide range of values, however these values are predominately under 1.5 million customers affected and 50,000 megawatts lost. When examining the impact of disturbance type on both variables, severe weather has the widest range, while load shed has the shortest. The data from both variables are mostly consolidated in the lower range of values, indicating that the data might have outliers or an underlying extreme value distribution and need further investigation.
In the outlier analysis, a linear model is created, and Bonferroni’s outlier test is performed to identify observations with residuals that are statistically different from the model. Three outliers are found to be statistically different from the rest of the data set, as shown in Figure 1. Point number 27, as shown in the upper right corner, is the most extreme value, but all three values are identified as extreme and removed. There is no common extreme variable value between the three outliers identified.
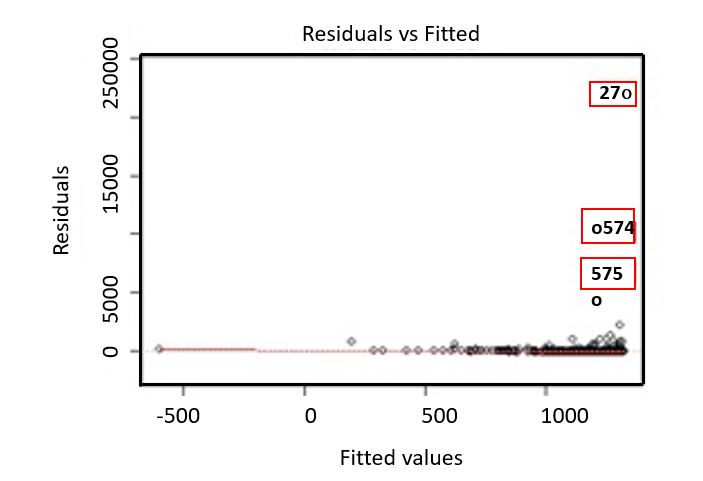
Figure 1. Results of linear model plotting residuals vs fitted results with outliers shown in red boxes.
Correlation Analysis.
A correlation analysis on the quantitative variables, customers affected, kilowatt loss, and duration, is performed, using Pearson’s correlation coefficient, Spearmen’s rank correlation coefficient, and Kendall’s Tau tests. Results indicate low linear correlation between the three variables tested, where the correlation coefficients are all less than 0.5. The highest correlation is weakly positive between duration and customers affected at 0.302. Generally, if the number of customers affected is larger, the duration of the outage is longer, but this relationship might not be linear. Although the correlation coefficients are relatively low, the variables still need to be tested for independence using a Chi-Square test. A Chi-Square test is used to determine independence between dependent variables. Results indicate significant p-values which means the variables cannot be assumed to be independent of each other. Customers affected and megawatt loss, as well as NERC region and disturbance type are not assumed to be independent.
Regression Analysis.
Multiple linear regression models are considered as discussed previously to estimate the resilience of the system with duration as the dependent variable. Table 1 shows the adjusted R2 values for each model. Models 9 and 11 had the highest R2 values, while models 10 and 12 had the lowest. It is important to note that all four of these models consisted only of significant variables from the initial six models. Several models have the same adjusted R2 values. This could be a result of only using significant variables for models 7-12, where R2 values are repeated, because if a variable is significant in one model, it is usually significant in the others as well. In general, all models had a relatively low R2 value which indicates that more descriptive parameters are needed to accurately estimate the duration of an outage event.
Table 1. Adjusted. R2 values of all models.
| Model | Description | Adjusted R2 Value |
| 1 | All variables | 0.2563 |
| 2 | All variables, interaction term | 0.2558 |
| 3 | All variables, squared, no interaction term | 0.2574 |
| 4 | All variables, squared and cubed, no interaction term | 0.2590 |
| 5 | All variables, squared, interaction term | 0.2569 |
| 6 | All variables, squared and cubed, interaction term | 0.2584 |
| 7 | Significant variables from model 1 | 0.2604 |
| 8 | Significant variables from model 2 | 0.2604 |
| 9 | Significant variables from model 3 | 0.2622 |
| 10 | Significant variables from model 4 | 0.2555 |
| 11 | Significant variables from model 5 | 0.2622 |
| 12 | Significant variables from model 6 | 0.2555 |
CONCLUSIONS
This research is conducted to assist decision makers in understanding how a disturbance may impact a community. Three outliers are identified using linear regressions in R and removed from the data set. A correlation analysis is performed with the variables megawatt loss, duration, and customers affected. Finally, multiple linear regression models are fitted to estimate the duration of an outage given certain parameters.
Correlations found in the data are not significant, but not irrelevant to the research. Though having little correlation, values may have been dependent on one another, which would not require correlation. The chi-square test validated that there is a relationship between the variables being tested. Twelve linear regression models are tested to determine if the data provided enough information to create predictive models for decision makers and stakeholders. There are several variables discovered in the models, such as disturbance type and NERC region which offer insight on the duration of an event.
Removing missing data is necessary because regression models cannot comprehend unknown or missing values, however it would be beneficial to look more into the missing variables of data to see if missing data could be estimated. One way to accomplish this would be to average the known values from a specific variable, and input them for the unknown. This would also allow for more data to be used in testing, but it may be less accurate because the values are estimated.
The results of the model indicate that the relationship between the independent and dependent variables is non-linear due to the low adjusted R2 values reported. More data could result in a linear relationship between the independent and dependent variables which could improve the model fit; however non-linear models should be explored to allow more accurate assessment of the resilience of regional power systems. This project is expected to provide risk managers and decision makers with the necessary information to promote preparedness for and recovery from major disasters by hardening the infrastructure systems in advance and optimizing resource allocation in the aftermath of hazardous events.
ACKNOWLEDGMENTS.
I would like to thank Dr. Hiba Baroud for allowing me to work with her on this project, as well as Mackenzie Whitman and Leslie Gillespie-Marthaler for their mentorship. I would also like to thank Dr. Lesa Brown and the other instructors at The School for Science and Math at Vanderbilt.
REFERENCES.
- T. Aven, Risk assessment and risk management: Review of recent advances on their foundation. European Journal of Operational Research 253, 1–13 (2016).
- I. Linkov, L. Read, C. Fox-Lent, L. Bakkensen, Validating resilience and vulnerability indices in the context of natural disasters. Risk Analysis 37, 982-1004 (2016).
- M. Panteli, P. Mancarella, The Grid: Stronger, Bigger, Smarter?: Presenting a Conceptual Framework of Power System Resilience. IEEE Power and Energy Magazine 13, 58-66 (2015).
- Y. Haimes, On the Definition of Resilience in Systems. Risk Analysis 29, 498-501 (2009).
- US Department of Energy. Electric Power Monthly – U.S. Energy Information Administration. Eia.gov. (2017)
- 6. R Core Team (2013). R: A language and environment for statistical computing. R Foundation for Statistical Computing, Vienna, Austria. ISBN 3-900051-07-0, URL http://www.R-project.org/.
- D. Mari, S. Kotz, Correlation and dependence (Imperial College Press, London, 2004).
- G. James, D. Witton, T. Hastie, R. Tibshirani, An Introduction to Statistical Learning with Applications in R (Springer, New York, 2013)
Posted by John Lee on Tuesday, December 22, 2020 in May 2018.
Tags: Linear Modeling, Power Outages, Systems Resilience