Investigating the Metabolic Characteristics of Brain Microvascular Endothelial Cells
ABSTRACT
Neurovascular disease is now the number two cause of death in the U.S., necessitating further understanding of the mechanisms behind this disease.1 Dementia, aneurysms, strokes are all diseases linked to neurovascular disease, characterized by dysfunction of the blood vessels in the brain and spine.1 To approach the problems with these blood vessels, this research focused on brain microvascular endothelial cells (BMECs) which are cells that make up the blood brain barrier (BBB).3 The BBB is an important part of the blood vessels of the brain, which, when in a state of dysregulation, is a large contributor to neurovascular disease.3 Specifically, this research focused on understanding the metabolic characteristics of these cells based on the hypothesis of metabolic dysregulation as a factor in neurovascular disease. This was done by testing lactate and glucose outputs and cell count in in-vitro BMECs under different culture media conditions. It was found that BMECs survive without significant cell death for 24 hours without glucose, contradicting the expected death of other endothelial cells under those conditions.4 This supports assumed metabolic characteristic differences between BMECs and peripheral ECs. Additionally, it was found that BMECs cultured in amino acid free media were more glycolytic, indicating that amino acids are important for metabolic processes outside of glycolysis in BMECs. A better understanding of the metabolic characteristics of BMECs can help create models and treatments for regulation and maintenance of the BBB, ultimately aiding in the prevention of neurovascular disease.
INTRODUCTION.
Neurovascular related disease, characterized by a dysfunction in the blood vessels of the brain and spine, is currently the number two cause of death in the U.S.1 Neurovascular disease linked conditions include dementia/Alzheimer’s, cerebral aneurysms, strokes, and many smaller vessel disorders. The economic burden from unpaid caregivers for these diseases alone results in billions of dollars of lost wages.2 Based on this, there is currently an unprecedented need to advance the understanding of neurovascular disease in order to aid in its prevention and treatment.1 One promising point of investigation in the path to minimize neurovascular disease is a better understanding of the blood-brain barrier (BBB). The BBB is a restrictive and highly regulated vascular system, which serves to impede the movement of compounds between the central nervous system (CNS) and the bloodstream .3 As such, it holds an important role in maintaining brain homeostasis in regulating which compounds in the bloodstream are allowed to reach the brain, while also removing toxic molecules from the CNS.3 Thus, because of its crucial role in the interaction between blood vessels and the brain, dysfunction of the BBB can cause neurovascular disease.
Brain microvascular endothelial cells (BMECs) are a primary component of the blood-brain barrier (BBB).3 BMECs are functionally distinct from peripheral endothelial cells (ECs), which are endothelial cells found outside of the CNS, because their barrier-forming property results in extremely low permeability to ions, hydrophilic molecules, and small lipophilic compounds, among others.4 This low permeability arises from high-fidelity intercellular tight junctions (TJs), suppression of nonspecific transcellular transport, and a variety of efflux transporters that prevent small molecules from passively diffusing through the BMECs. Other CNS cell types such as astrocytes, pericytes, and microglia are also involved in the maintenance and regulation of the BBB; however, BMECs, with their specialized TJs and efflux transporters remain primarily responsible for the barrier function.3 Research on the fundamental biological role and responsibilities of the BBB has been well developed over time. However, this study will give novel contribution to the field through studying metabolism within the ECs of the BBB.
All organisms must convert nutrients into energy, and cells use one of two primary metabolic pathways to meet their energetic demands. First, glycolysis is a metabolic process that occurs in the cytoplasm and ultimately breaks down glucose into lactate, while also producing adenosine triphosphate (ATP), the cells primary source of energy.5 Peripheral ECs have been confirmed as primarily glycolytic.5 Second, oxidative phosphorylation (OxPhos) occurs in the mitochondria and uses electrons and NADH extracted from the TCA cycle to generate ATP through the electron transport chain.5 OxPhos produces energy more efficiently, but it requires high amounts of oxygen, causing oxidative stress. Each cell type holds a specific balance between these two processes and understanding this balance is important to understanding the regulatory processes of the cell, but currently the metabolic balance of BMECs is unknown. Previous work and the lab’s preliminary data suggests that the primary metabolic pathways utilized by BMECs are different from those used in peripheral ECs. Relevantly, a cell’s metabolic status is dynamic and capable of directly altering the function of the cell. In ECs, this can be seen during vessel sprouting, which is the angiogenic process of the creation of new blood vessels from pre-existing ones.6 Specifically, it has been shown that upregulation of glycolytic activator PFKFB3 is associated with vessel sprouting.6 Further, this impact of metabolic status on cellular function occurs in the differentiation of induced pluripotent stem cells (iPSCs), in which forcing the cells to utilize OxPhos instead of glycolysis causes the iPSCs to lose their pluripotent state and differentiate.7 Furthermore, BMECs have elevated mitochondrial concentrations relative to peripheral ECs.8 Thus, the metabolic properties of BMECs are currently unknown and investigating how BMEC metabolism may differ from peripheral EC metabolism could have significant implications to our understanding of the role of both metabolism and the BBB in health and disease.
A better understanding of the mechanisms regulating the BBB during health and disease is expected to provide important insights for treatment of a variety of neurological disorders. In peripheral ECs, metabolic dysregulation has been confirmed as a cause of various diseases such as fatty liver disease, cancer, diabetes, hypertension9 and BMEC dysfunction has been associated with neuronal dysfunction, neuroinflammation, and neurodegeneration.3 One source of BMEC dysfunction is oxidative stress caused by reactive oxygen species (ROS) generated during OxPhos.3 This suggests a connection between metabolic stress and BMEC dysfunction as a contributor to neurological disease. Additionally, a strong relationship between metabolic dysfunction and Alzheimer’s Disease has been shown in previous work, though the metabolic pathways involved are completely uncharacterized at present time, providing strong motivation for this research.5,10 Collectively, BMEC metabolism could have a critical role in maintaining BBB health and a better understanding of this role could allow for the development of therapeutic approaches to regulate BMEC metabolism. Glycolysis and OxPhos can be manipulated through increasing uptake, changing concentrations of original substrates, or inhibiting metabolic pathways.11 Thus, enhancing the understanding of metabolic pathways and how they contribute to regular function in BMECs can provide novel progress in the development of treatments for neurovascular disease.
The overarching goal of this research is to characterize the metabolic properties required to maintain the specialized function of BMECs. Specifically, this study aims to define the metabolic properties of BMECs as a potential contributor to neurodegeneration, with the long-term goal of identifying therapeutic targets that are disrupted in disease. This goal will be approached by testing the metabolic reactions of BMECs under different media conditions. Media-based testing of glucose and lactate levels helps understand the use of glycolysis in tested cells. OxPhos cannot be directly measured from glucose and lactate levels, but it can be inferred from observations in levels of glycolytic energy production. Through this method, it will be possible to begin to understand the balance between OxPhos and glycolysis for BMECs, what media components are essential for energy production, and how BMECs can adapt when essential nutrients are lost.
MATERIALS AND METHODS.
Media Sample Acquisition.
A mature BMEC monolayer with strong barrier phenotype was formed as previously described.4 Another lab member was responsible for BMEC differentiation which preceded conditional media testing. After differentiation into mature BMECs, standardized growth media was switched with conditional media. Generally, three wells of BMECs were used for each condition in order to create a larger and more representative population. Media conditions in this study were: Neurobasal (NB) control media, low glucose (LG) media, high glucose (HG) media, and amino acid free (AAF) media. Samples of media from each well were taken at incremental time points T=0, 6, 12, 24, 48, 72 hr. Testing time periods were capped around 72 hours because it was difficult to maintain barrier phenotype and life for long after cells come to maturity. Additionally, sample collection ended before the cells died so they could be fixed and counted.
Immunofluorescence Staining:
In order to prevent any cell degradation and to obtain an accurate understanding of the state of the cells at the final media sample time point, the staining process began immediately after the final samples were taken. First, cells were fixed in 4% paraformaldehyde (PFA) for 10 min and washed. Then, they were pre-blocked in PBS-DT (9.5ml Phosphate buffered saline, 0.5mL donkey serum, and 30μL Triton-X 100). Most cell culturing was done in 12 well plates so the volume of PBS-DT and subsequent antibodies were 300μL per well. After pre-blocking, DAPI solution was added for 10 min to stain nuclei for cell count imaging.
Imaging.
Four images of each well were taken to estimate cell count. After images were taken, ImageJ was used to make composites of multiple staining layers as well as to run the “analyze particles” function to obtain a cell count for each image. Cell counts were taken from 4 different images in each well. Then the average of the images was multiplied by 1055.408 in order to account for the difference between the area of one image and the area of the entire well. This calculation gives an estimate for the total number of cells in the entire imaged well. All cell counts were converted to cells per well estimates.
YSI media sample testing.
Once all media samples were taken from the cells in conditional media, the samples were tested. Glucose and lactate readings for this research were taken using the YSI 2300 STAT Plus Glucose Lactate Analyzer. For the YSI, all media samples were at room temperature in 2mL tubes. First, calibration was performed. After calibration, the machine ran 24 samples at a time and took two measurements of glucose and lactate for each sample. Glucose and lactate concentrations from the YSI 2300 Stat Plus were used as the primary means of understanding the metabolic reactions of the BMECs. Once raw molar concentrations of glucose and lactate were taken, they were normalized based on evaporation factor (EF). EF was a calculation taken from the gain of concentration, caused by a lower fluid to lactate/glucose ratio, taken from cell free media controls in the testing period.
Statistical Analysis.
Standard deviations were taken and graphed in the form of error bars for the figures of the study. T-tests were performed to analyze the significance of lactate and glucose readings and cell counts. A p-value of <0.05 was assumed to be significant while >0.05 had no significance.
RESULTS.
Lactate Production and Glucose Consumption
Testing was done on the lactate output of cells in media of different glucose concentrations in order to understand how glucose concentration affects the amount of glycolysis that occurs.
Figure 1 examines the relative glycolysis occurring in the cells through measuring lactate production which is assumed to be directly proportional to the use of glycolysis. The lack of difference between lactate production in the high glucose and low glucose conditions indicates that the increased availability of glucose does not increase glycolytic activation. However, the lactate production stopped for the low glucose media at the 24 hr mark, where glucose levels were recorded at ≈0nm. The combination of the lack of glucose and no lactate output indicates that no energy was being created using glycolysis in the LG condition for the last 24hrs of the testing period.
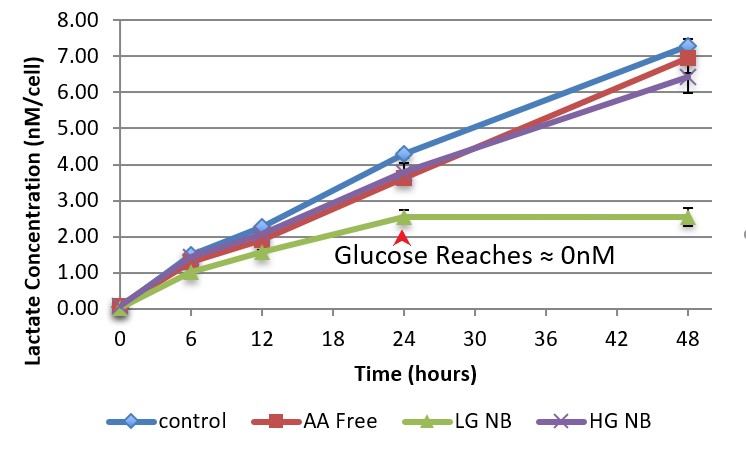
Figure 1. Cellular Lactate Concentration. This figure shows lactate concentration at T=0,6,12,24, and 48hrs in nanomolars per cell for media conditions low glucose (LG), high glucose (HG), amino acid (AA) free, and NB control. Error bars show standard deviation of lactate measurements (n=6 per point). The red arrow indicates the time point in which glucose concentration testing showed the cellular glucose concentration for the low glucose media reach zero. There was no significant difference found between the lactate production rates for the high glucose and low glucose media through the first 24 hrs (p=0.58).
In order to understand the effects of no glycolytic energy production on the LG media condition cells, cell counts of the LG and HG media conditions were taken at 48 hrs. This testing showed that there was no significant cell count difference as a reaction to the LG media cells having no access to glucose for the final 24hrs of the testing period (Figure 2), indicating no significant cell death. Thus, the inability to create energy from glycolysis did not cause cell death of BMECs in the short term.
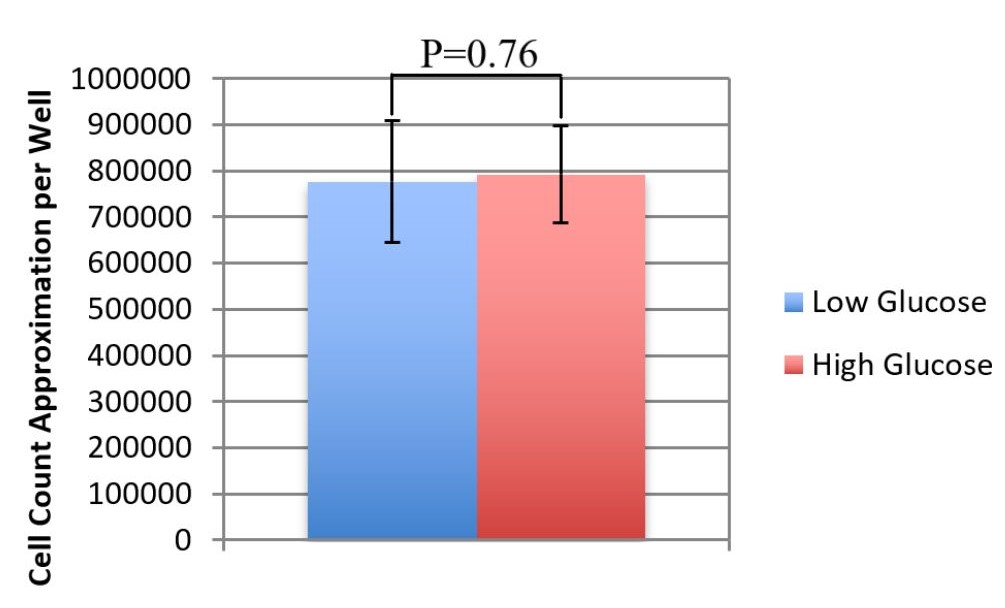
Figure 2. High Glucose vs. Low Glucose Cell Counts. This graph shows average cells per image for high glucose media and low glucose media at T=48hrs. There is no significant difference between the two cell count averages (p=0.76). Averages: LG=7.8*105, HG=7.9*105. Error Bars show standard deviation of the estimates (n=12 per condition).
Glucose/Lactate Ratio.
One important point of research for BMEC metabolism was the balance between Ox-Phos and glycolysis for energy production. This balance was tested by comparing glucose intake to lactate output in a glucose/lactate ratio. A higher glucose ratio means less relative use of glucose through glycolysis while a lower glucose ratio means more glycolysis in comparison to other processes (Ox-Phos).
Figure 3 shows that AA free media cells, in having a significantly lower glucose/lactate ratio than the LG and control conditions, had a higher rate of conversion of glucose to lactate through glycolysis than the other tested media conditions. This indicates that the lack of amino acids causes BMECs to use higher proportional glycolysis for energy production than when amino acids are present.
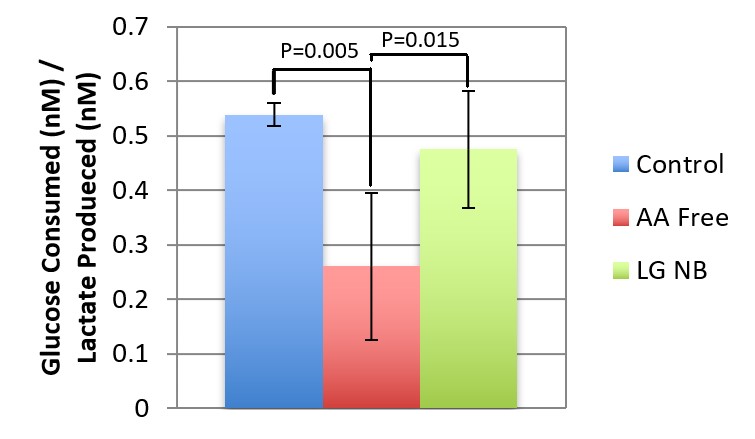
Figure 3. Glucose/Lactate Ratio. This figure shows the ratio of glucose consumed to lactate produced for the neurobasal control media, the low glucose media condition, and the amino acid free media condition. Error bars show the standard deviation of the glucose/lactate ratios for the 3 conditions (n=6 per condition). There were significant differences between the control and the amino acid free media (P=0.005) and the low glucose and amino acid free media (P=0.015).
DISCUSSION.
BMEC metabolism in the BBB has not yet been adequately explored, but in conditional media testing, changing the availability of nutrients in the media can show what nutrients are essential to achieve BBB functionality. This can become important in the case of diseases which may deplete stores of these nutrients, making the BBB more susceptible to breakdown and permeability.
An unexpected result of this research was that BMECs were capable of surviving in the short term without creating energy from glycolysis (Fig. 1, 2). This was discovered when the low glucose media condition reached 0 glucose and 0 lactate output at the 24hr mark during a 48hr testing period. Surprisingly, at the end of the period, the low glucose wells had cell counts that were insignificantly different than those of the high glucose media. Thus, it seems apparent that, in the short term, BMECs did not rely on glycolysis for survival. This is an unexpected result because peripheral endothelial cells rely on glycolysis as it serves as the primary method of energy production.5
If it is further confirmed that BMECs survive without glycolytic energy production in the short term, there can be at least two primary potential conclusions drawn. First, it is possible that BMECs do not rely heavily on the conversion of glucose to lactate in general, primarily creating energy through Ox-Phos. However, it is also possible that BMECs utilize glycolysis for a significant amount of energy production but were able to temporarily adapt to Ox-Phos based on the availability of nutrients. A possible experiment for determining which of these two possibilities is accurate would be to test for mitochondrial activation protein concentration with a western blot or immunofluorescence staining in BMECs that have available glucose in comparison with BMECs that survive without glucose for a period of time. In this testing, if the final mitochondrial protein levels are higher in BMECs that went through a period of hypoglycemia, this would indicate an Ox-Phos increase after running out of glucose, as Ox-Phos occurs in the mitochondria.
Figure 3 indicates a significantly higher proportional use of glycolysis in amino acid free media. While the implications of this finding are uncertain, it seems to indicate that the presence of amino acids is necessary for heightened Ox-Phos. Inversely, there was a higher observed glycolytic conversion to lactate when less amino acids were contained in the media. This research supports that amino acids are crucial to regular function and energy production within BMECs.
Figure 1 shows that lactate production does not increase significantly as a result of changing glucose media concentrations. This indicates a natural inhibition on the amount of glycolysis that will occur inside of BMECs that exists even when excess glucose is present. Additionally, the observation that glucose concentration does not determine glycolytic activation suggests the existence of other factors which determine the rate of glycolysis in BMECs. These could vary from the developmental state of the cell to simply another present compound.
Conditional media testing in this study can begin to show the metabolic properties and adaptations of BMECs by testing how BMECs react with available nutrients in order to produce energy. However, confirmation and expansion of these initial understandings will require similar testing on peripheral endothelial cells. This will allow for effective comparison of the metabolic characteristics of BMECs and peripheral ECs. Comparative analysis could also illuminate a further understanding of BMECs. This is because EC metabolism is well researched, making it easier to extrapolate conclusions from the discovered differences which could help push BMEC metabolism research forward.5 It is also important to note that all differences found in comparative testing between BMECs and peripheral ECs should be understood in the context of the unique functionality of BMECs in their role within the BBB.
This study implemented a relatively broad approach to the study of BMEC metabolism which creates unique results. Findings in this research will be verified by future experiments. However, based on the relative absence of previous BMEC metabolism research, the primary interest in the first stages of conditional media testing in BMECs is the discovery of points for further investigation. For example, recognizing differences in glucose/lactate ratio of amino acid free media may not provide definitive answers currently, but it does create questions regarding why and how amino acid concentration affects the rate of glycolysis. Another point for exploration is how BMECs adapt to no availability of glucose. How long can they be sustained without additional glucose? Is there a heavy reliance on glycolysis? There is also interest in the observed cap of glycolysis in BMECs and how it functions and if it can be defined. All of these questions are bred from a broad and useful pool of observations and conclusions about BMEC metabolism in this research.
Due to an unprecedented need for understanding neurovascular disease, research into the BBB at a cellular level has become increasingly important.1,2 Specifically, research into the metabolism of BMECs is a developing area of study which promises to provide novel insight into the function of BMECs and the elements which are important for maintaining proper function.3,5 This research applied a broad, conditional media based testing approach to understanding the metabolic characteristics of BMECs. It was this broad approach which allowed for the success of this study in progressing research into BMEC metabolism. Currently, there is a need for a foundation for this research to build off of and this type of wide and observation driven research can help contribute to that foundation.
ACKNOWLEDGMENTS.
Dr. Angela Eeds – For help throughout every aspect of the project: making connections with the lab, advising on research direction, giving feedback on proposals, papers, and this poster, and being available for any questions.
Kameron Hagerla – For assisting and guiding in many procedures in the lab, working alongside me in data analysis, YSI trials, and imaging, and answering a number of questions relating to the research.
Dr. Jamey Young – For allowing use of the resources of the Young lab, most notably the YSI 2300 STAT Plus that was used for a large portion of the testing for this project.
REFERENCES
- F. Fan, J. L. Saver, Neurovascular disease is the second leading cause of death in the United States (US): a modern disease burden analysis. Stroke. 49, (2018).
- E. Nichols, Global, regional, and national burden of Alzheimer’s disease and other dementias, 1990–2016: a systematic analysis for the Global Burden of Disease Study. The Lancet Neurology. 18, 88-106 (2019).
- B. Obermeier, Development, maintenance and disruption of the blood-brain barrier. Nature Medicine. 19, 1584-1596, (2013).
- E. Lippmann, Derivation of blood-brain barrier endothelial cells from human pluripotent stem cells. Nature Biotechnology. 8, 783-791 (2012).
- G. Eelen, Endothelial cell metabolism. Physiological Reviews. 98, 3-58 (2017).
- K. Bock, Role of PFKFB3-driven glycolysis in vessel sprouting. Cell. 145, 651-663 (2013).
- X. Zhong, Mitochondrial dynamics is critical for the full pluripotency and embryonic developmental potential of pluripotent stem cells. Cell Metabolism.29, 979-992 (2019).
- W. H. Oldendorf, M. E. Cornford, W. J. Brown, The large apparent work capability of the blood-brain barrier: a study of the mitochondrial content of capillary endothelial cells in brain and other tissues of the rat. Annals of Neurology. 1, 409-417 (1977).
- X. Pi, L. Xie, C. Patterson, Emerging roles of vascular endothelium in metabolic homeostasis. Circulation Research. 123, 477-494 (2018).
- S. Merlo, Alzheimer’s disease: brain expression of a metabolic disorder?. Trends in Endocrinology and Metabolism. 21, 537-544 (2010).
- W. C. Stanley, G. D. Lopaschuk, J. L. Hall, J. G. McCormack, Regulation of myocardial carbohydrate metabolism under normal and ischaemic conditions: potential for pharmacological interventions. Cardiovascular Research. 33, 243–257 (1997).
Posted by John Lee on Wednesday, December 23, 2020 in May 2020.
Tags: Blood Brain Barrier, Brain Microvascular Endothelial Cells, metabolism, Neurovascular Disease