Gli2 Regulation of Parathyroid Hormone-Related Protein Expression in Metastatic Breast Cancers
ABSTRACT
Breast cancer is the most common cancer in women, accounting for 30% of new cancer cases in women in 2017 [1]. Breast cancer often metastasizes to bone, causing tumor-induced bone disease (TIBD), which is irreversible. In TIBD, the transcription factor Gli2 has been shown to induce Parathyroid Hormone-Related Protein (PTHrP) expression in tumor cells, which causes an increase in osteoclastogenesis, resulting in a net bone loss. While much research has been done on the role of Gli2 in regulating PTHrP expression, the binding site of Gli2 on the PTHrP promoter remains unclear. In the pre- sent study, we investigate the potential binding site of Gli2 on the PTHrP promoter. Four versions of the PTHrP promoter (4.0kb, 1.1kb, P3, P3 smad mu) were transfected into MDA- MB-231 breast cancer cells. Cells were stimulated with Gli2 protein and PTHrP promoter activity was measured by luciferase assay. It was found that as regions of the promoter were taken out, PTHrP promoter activity decreased. The full length promoter (4.0kb) yielded more PTHrP activity than the P3 promoter, containing just region P3 of the promoter, suggesting that the primary binding site of Gli2 may reside on regions P1 or P2. Determining the primary binding site of Gli2 on the PTHrP promoter would be very helpful in developing drugs and therapies to combat TIBD.
INTRODUCTION.
Breast cancer is the most common cancer in women, accounting for 30% of new cancer cases in women in 2017 [1]. Breast cancer also remains the second leading cause of cancer death among women, with 14% of all cancer deaths due to breast cancer [1]. Breast cancer often metastasizes to bone, where it can cause bone destruction or Tumor-Induced Bone Disease (TIBD) [2]. Bone destruction leads to hypercalcemia, severe pain, and can heavily impact a patient’s quality of life [3]. TIBD is driven by a process coined “The Vicious Cycle of Bone Metastasis,” in which tumor cells expressing Parathyroid Hormone-Related Protein (PTHrP) stimulate receptor activator of nuclear factor kappaB (RANKL) signaling in osteoblasts, which causes an increase in osteoclast formation, resulting in a net bone loss. Growth factors such as Transforming Growth Factor β (TGF-β) are then released from the bone matrix, which further promote Gli2 and PTHrP production by tumor cells. Gli2, a transcription factor in the Sonic hedgehog signaling pathway, has been shown to induce PTHrP expression in tumor cells [4]. Furthermore, when Gli2 is inhibited, PTHrP expression is significantly decreased. The resulting PTHrP inhibition in bone-metastatic tumor cells reduces TIBD, either slowing down or stopping the vicious cycle all together [4].
However, Gli2’s direct method of regulating PTHrP remains un- known. This could be due in part to the complexity of the PTHrP promoter and a lack of information regarding Gli2 binding sites on the promoter [5]. The PTHrP promoter contains three primary binding regions: P1, P2, and P3 (Figure 1). On region P3 resides the smad binding element, a downstream mediator of the TGF-β pathway which drives Gli2 activation, and may be important in regards to PTHrP stimulation by Gli2 [6,7].
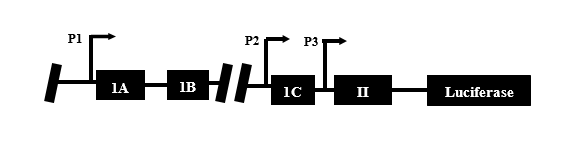
Figure 1. The PTHrP promoter showing regions P1, P2, and P3.
In order to develop treatments for TIBD, the regulation of PTHrP by Gli2 must be understood better. To further study this relationship between Gli2 and PTHrP, we need to first determine the possible binding sites for Gli2 on the PTHrP promoter. Based on previous research by our group and others, we hypothesize that the P3 region of the PTHrP promoter will contain the primary binding site for Gli2, and is important in Gli2 activation of PTHrP [8-10].
In this study, four variations of the PTHrP promoter were used (4.0kb, 1.1kb, P3, P3 smad mu). The 4.0kb promoter contains the full-length promoter. The 1.1kb promoter is missing region P1. The P3 and P3 smad mutant promoters are missing both regions P1 and P2. Furthermore, the P3 smad mutant contains a deletion of the smad binding element located on region P3 of the PTHrP promoter. Ideally, as regions of the promoter are taken away, the region that is most important for Gli2 binding will become clearer. To test PTHrP promoter activity, four variations of the PTHrP promoter were cloned out of DNA vectors and placed into new luciferase expression vectors containing a mammalian cell inhibitor for positive selection of tumor cells containing the vector DNA. Differences in luciferase activity between the vectors containing the different PTHrP promoters were compared in order to assess regions of importance on the PTHrP promoter, which could be beneficial in developing drugs and therapies to combat TIBD.
MATERIALS AND METHODS.
Cells.
Our lab derived a bone metastatic clone of the human breast cancer cell line MDA-MB-231 (American Type Culture Collection, Manassas, VA). MDA-MB-231 cells were cultured in Dulbecco’s Modified Eagle Medium (DMEM, Corning, Corning, NY). All media was supplemented with 10% FBS (Peak Serum, Colorado, USA) and 1% Penicillin streptomycin solution (Mediatech, Virginia, USA) [11].
PTHrP Promoters.
Four variations of the PTHrP promoter were cloned into a Luciferase pGL4.1 vector with mammalian cell inhibitors in order to determine regions of importance (Figure 2).
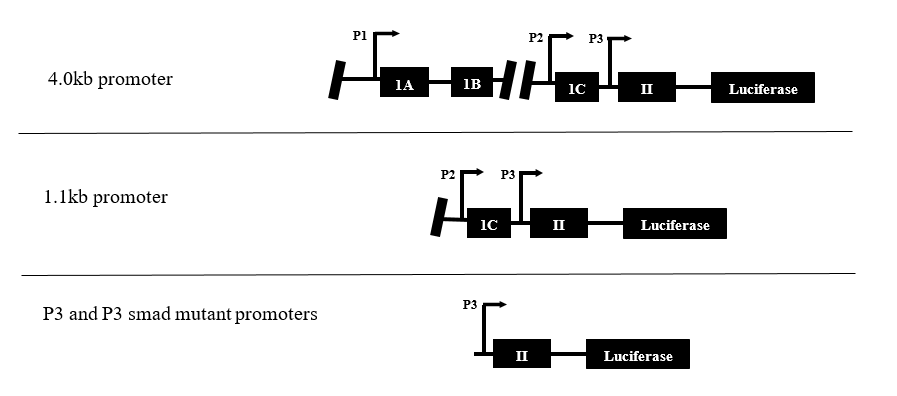
Figure 2. All variations of the PTHrP promoter used in the present study. The 4.0kb is the full-length promoter, the 1.1kb has only regions P2 and P3, and the P3 and P3 smad mutant promoters contain only region P3. The P3 smad mutant promoter contains a deletion of the smad binding element.
DNA Cloning.
The PTHrP promoters were first amplified out of Luciferase pGL3b vectors through PCR. The primer sequences are as follows: 4.0kb, ATCGGTACCAGGATCCCATCAGCTTGATG (sense) and ATCCTCGAGCATCGTCTCCGCTCGCGC (antisense), 1.1 kb, ATCGGTACCGGATCCGCCGCGCCGGCAGGA (sense) and ATCCTCGAGCATCGTCTCCGCTCGCGC (antisense) and P3, ATCGGTACCTAGGGCGCCACCTCTTTGC (sense) and ATCCTCGAGAGGCCCTTTCGTTCCAGAG (antisense). The following cycling conditions were used: 94°C for 2 minutes, (94°C for 30 seconds, 58°C for 30 seconds, 72°C for 1 minute per kb) x35 cycles, 72°C for 5 minutes, and then 4°C until taken out. PCR products were purified by gel extraction using the Qiaquick gel extraction kit following manufacturer’s instructions. The purified promoters and recipient vectors were then digested using enzymes KpnI-HF and XhoI overnight at 37˚C. Promoters were inserted into Luciferase pGL4.1 vectors by ligation at a 3:1 molar ratio of promoter to vector DNA.
Transfections.
The promoter-containing pGL4.1 vectors were transfected into MDA-MB-231 breast cancer cells in order to measure Luciferase activity. Cells were plated on a 24 well plate at a density of 7.5 x 10⁴ cells per well the day before transfection. Cells were transfected with 5ng of pcDNA, a Gli2 protein expression vector, and the PTHrP promoter-containing luciferase vector. A renilla luciferase vector, PrLTK, was added as a transfection efficiency control. All transfections were done using LipofectAMINE Plus (Invitrogen) reagent per manufacturer’s instructions.
Luciferase Assay.
Forty-eight hours after transfection, cells were harvested to measure luciferase expression using the Dual-Luciferase Reporter Assay (Promega, Madison, WI). Briefly, 100μl of 1x passive lysis buffer was used to lyse the cells. 20μl of cell lysate was added to 100μl of Luciferase Assay Reagent II to measure firefly luciferase activity. 100μl of Stop & Glo reagent was added to measure Renilla luciferase activity. Luciferase expression from the PTHrP promoters was calculated by dividing the Firefly luciferase (PTHrP promoter activity) by the Renilla luciferase (internal control).
RESULTS.
Cloning of the PTHrP Promoters.
In order to ensure stable transfections further down the line, we cloned all four variations of the PTHrP promoter into a pGL4.1 luciferase expression vector containing a mammalian cell inhibitor. The 4.0kb, 1.1kb, P3, and P3 smad mutant promoters were all cloned out of Luciferase pGL3 vectors and into Luciferase pGL4.1 vectors. The promoter size was read in kilobases on a 1% Agarose gel to confirm the successfulness of the cloning process (Figure 3). The digested promoters match the original promoters used for PCR, with no change in band size.
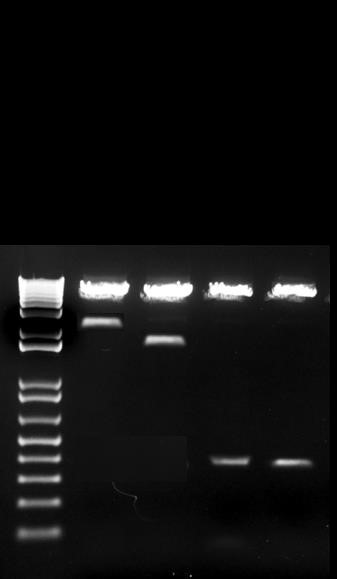
Figure 3. Representative gel of digested plasmids. PTHrP promoters 4.0kb, 1.1kb, P3, and P3 smad mutant were cloned out of Luciferase pGL3 vectors and into Luciferase pGL4.1 vectors. The digested promoters are representative of the original promoters.
PTHrP promoter activity from promoter constructs.
To determine which regions of the promoter are important, luciferase expression vectors containing the four variations of our PTHrP promoter were transfected into MDA-MB-231 cells. A luciferase assay was performed to measure PTHrP promoter activity (Figure 4). It was found that as the size of the promoter decreases, so does promoter activity. The 4.0kb yielded the highest PTHrP promoter activity (p<0.0005 compared to PcDNA), while both the P3 and P3 smad mutant promoters yielded the least (not significant compared to PcDNA). The 4.0kb promoter had an increase in luminescence at a fold change of 50, while the 1.1kb promoter had a fold change of about 25, and both the P3 and P3 smad mutant promoters had a fold change of about 18 compared to PcDNA control.
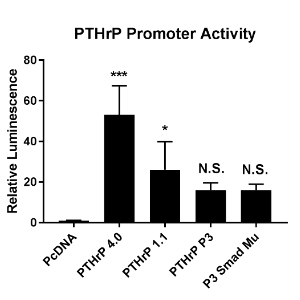
Figure 4. Cells were transfected with the PTHrP promoters cloned into the Luciferase pGL4.1 vector. A Luciferase assay was performed to measure PTHrP promoter activity when in the presence of Gli2. Relative luminesce is representative of the PTHrP promoter activity. Gli2 significantly induced PTHrP promoter activity in the PTHrP 4.0 and 1.1kb promoters (compared to PcDNA), but no significant induction was seen in the P3 or P3 smad mu promoters. Data is presented as fold change over pcDNA. Error bars represent standard deviation. * p<0.05, *** p<0.0005
DISCUSSION.
This study sought to investigate how Gli2 regulates PTHrP expression, or more specifically where Gli2 interacts with the PTHrP promoter in order for PTHrP expression to occur. Julie Sterling et al. (2006) found a link between Gli2 and PTHrP expression [4]. More specifically, Gli2 has been shown to drive PTHrP expression, as PTHrP expression is greatly reduced in the absence of Gli2 [4]. This is the first study to further investigate the mechanism by which Gli2 and PTHrP interact at the promoter level. Knowing how Gli2 and PTHrP interact at the promoter level would be greatly benefit efforts in drug development to combat TIBD.
We initially were successful in cloning the four versions of the promoter (4.0kb, 1.1kb, P3, P3 smad mutant) into Luciferase pGL4.1 vectors (Figure 3). Cloning of the promoters was necessary in order to stably transfect them into MDA-MB-231 cells. Our observations that the 4.0kb promoter, the full length promoter, yielded more PTHrP promoter activity than the 1.1kb, P3, and P3 smad mutant promoters (Figure 4), can perhaps be due to the primary binding site of Gli2 potentially residing on regions P1 or P2 on the PTHrP promoter Moreover, as promoter size decreased, so did PTHrP promoter activity. The P3 and P3 smad mutant promoters both yielded the least amount of PTHrP, suggesting that regions P1 and P2 may be important for Gli2 binding, for as we add regions P2 and P1, promoter activity increases. However, this goes against our original hypothesis that, based on past research done by our lab and others, the P3 region will be the most important in Gli2 induction of PTHrP expression because of the presence of coding regions found within the P3 promoter region, as well as the amount of P3 initiated transcripts found in tumor cell lines and patient samples [5]. It is possible that some of the untranslated regions found in P1 and P2 are important for Gli2 induction of PTHrP expression. Furthermore, the smad binding element found in the P3 region of the promoter was deleted in the P3 smad mu sample. Since TGF-β signaling has been shown to regulate Gli2 induction of PTHrP [2]. We hypothesized that deleting the binding element for Smad2/3 (a downstream mediator of TGF-β signaling) could affect Gli2 induction of PTHrP. However, the P3 and P3 smad mutant promoters had the same amount of activity, suggesting that the smad binding element that resides on region P3 is not important for Gli2 to bind to the PTHrP promoter. Finding the primary binding site of Gli2 on the PTHrP promoter is crucial for understanding the mechanism of TIBD and for discovering therapies for combatting bone destruction by breast cancer metastasis.
Due to decreasing luminescence as promoter size decreased, it can be concluded that regions P1 and P2 on the PTHrP promoter may contain the primary binding site of Gli2. In addition, the smad binding element on region P3 holds no effect on PTHrP expression. Many methods can be done to further this research. First, we could treat MDA-MB-231 cells with Transforming Growth Factor-β, which promotes Gli2 production, 24 hours after transfection in order to stimulate further PTHrP expression. Furthermore, further sequencing analysis can be done to determine the exact binding location of Gli2 onto the PTHrP promoter and any potential binding partners. It would be ideal to validate our results in vivo, and in cell lines outside of MDA-MB-231 to further support our conclusions. If an exact binding location were to be found, it could be beneficial in developing drugs and therapies to combat metastases in bone and put a stop to bone destruction by breast cancer metastasis all together.
ACKNOWLEDGMENTS.
I would like to thank Dr. Julie Sterling for allowing me to work in her lab as well as my mentor, Alyssa Merkel, for all of her guidance and support throughout this project. I would also like to express my gratitude towards the School for Science and Math at Vanderbilt, as well as my advisor Dr. Jordan Grigor.
REFERENCES.
- Cancer Facts & Figures 2017. Cancer.org. https://www.can- cer.org/content/dam/cancer-org/research/cancer-facts-and-statis- tics/annualcancer-facts-and-figures/2017/cancer-facts-and-figures- 2017.pdf
- R. W. Johnson, et al. TGF-β Promotion of Gli2-Induced Expression of Parathyroid Hormone-Related Protein, an Important Osteolytic Factor in Bone Metastasis, Is Independent of Canonical Hedgehog Signaling. Cancer Research.. 71, 822-831 (2011).
- L. E. Ekem,. A. R. Merkel. J. A. Sterling. Assessment of Hedgehog/GLI2 signaling inhibitors within metastatic breast cancers. Young Scientist. 6, 12-15 (2016).
- J. A. Sterling, et al. The Hedgehog Signaling Molecule Gli2 Induces Parathyroid Hormone-Related Peptide Expression and Osteolysis in Metastatic Human Breast Cancer Cells. Cancer Research. 66, 7548-7553 (2006).
- V. Richard, et al. Quantitative Evaluation of Alternative Promoter Usage and 3 Splice Variants for Parathyroid Hormone-related Protein by Real-Time Reverse Transcription-PCR. Clinical Chemistry. 49, 1398-1402 (2003).
- D. Javelaud, et al. TGF-β/SMAD/GLI2 Signaling Axis in Cancer Progression and Metastasis. Cancer Research. 71, 5606-5610 (2011).
- R. K. Lindemann, P. Ballschmieter, A. Nordheim, J. Dittmer. Transforming Growth Factor Regulates Parathyroid Hormone-Related Protein Expression in MDA-MB-231 Breast Cancer Cells through a Novel Smad/Ets Synergism. The Journal of Biochemistry. 276, 46661-46670 (2001).
- L. J. Suva, et al. Structure of the 5’ flanking region of the gene encoding human parathyroid-hormone-related protein (PTHrP). Gene. 77, 95-105 (1989).
- J. Southby, L. M. Murphy, T. J. Martin, M. T. Gillespie. Cell-Specific and Regulator-Induced Promoter Usage and Messenger Ribonucleic Acid Splicing for Parathyroid Hormone-Related Protein. Endocrinology. 137, 1349-1357 (1996).
- R. Campos, C. Wang, D. Drucker. Regulation of Parathyroid Hormone-Related Peptide (PTHrP) Gene Transcription: Cell and Tissue Specific Promoter Utilization Mediated by Multiple Positive and Negative CisActing DNA Elements. Molecular Endicrinology. 6, 1642-1652 (1992).
- Y. Yoneda, et al. A Bone-Seeking Clone Exhibits Different Biological Properties MDA-MB-231 Parental Human Breast Cancer Cells and a Brain-Seeking Clone In Vivo and In Vitro. Journal of Bone and Mineral Research. 16, 1486-1495 (2001).
Posted by John Lee on Tuesday, December 22, 2020 in May 2018.
Tags: Gli2, Metastatic Breast Cancer, Promoter, PTHrP, Tumor-Induced Bone Disease