Gender Difference in Adolescent Body Temperature
ABSTRACT
Body temperature is a complex physiological indicator, and understanding its gender differences among adolescents is important for rigorously assessing infectious disease processes at school. This study investigates gender differences in skin temperature among adolescents in a free-living environment. As part of the campus prevention and control measures during coronavirus outbreaks, regular temperature checks were conducted at Beijing No. 4 High School. Temperature data were collected from a 10th-grade class (13 males and 12 females) twice a day for 14 days between September and October 2022. Through the use of ANCOVA analysis and a linear mixed-effects model, it was found that the average wrist temperature of males was slightly higher than that of females (p<0.050). Additionally, the average skin temperature in the morning was lower than that at noon (p=0.000), and the average body temperature decreased as the outside weather got colder with increasing variations. No significant effect on the temperature measured at noon was identified when the last two classes in the morning were physical education classes. These findings have additional implications for informing class schedules, classroom design, and health checks for adolescents.
INTRODUCTION.
Body temperature has been regarded as a complex, non-linear data point, subject to many sources of internal and external variation [1]. As a vital physiological indicator, the degree and fluctuation of body temperature contain essential information about how the body works, and understanding the sources of variation is key for its proper interpretation. A potentially important aspect of the variation in body temperature is gender difference, and there is a particular need to investigate adolescents as a separate group from adults. This is because age is regarded as one of the most important factors in defining normal body temperature [2].
This study aims to investigate how skin temperatures differ between adolescent males and females in a free-living environment. Temperature checks have been considered as a non-invasive measure to restrict campus access for prevention of Covid-19 spread, and been widely implemented during infectious disease outbreaks. Temperature data at the wrist were collected from a cohort of Grade 10 students in the classroom during coronavirus screening temperature checks for this analysis.
This work is related to two strands of literature. One strand has provided insights into how body temperature differs between males and females. Results from existing studies were mixed depending on site of measurement, circadian, menstrual, ambient temperature, among many others. First, a systematic review of temperatures conducted by Sund-Levander et al. [3] summarized how the gender difference in body temperature varies with the site being monitored. It indicated that the mean temperature for adult women is lower than that for adult men when measured orally, slightly higher when measured tympanically, and the same when measured rectally. Second, body temperature has a circadian rhythm, and in women, also a menstrual rhythm. Numerous studies (i.e., Baker et al. [4]) have found differences in the circadian temperature rhythms between men and women. Third, sex differences in thermoregulation have been evaluated [2,5], and the temperature sensitivity and response of each gender to the ambient environment may differ [6].
Another strand involves a discussion about the feasibility and effectiveness of daily temperature screening in preventing the spread of infectious diseases, especially COVID-19. These discussions are based on real data collected from a large public university [7], a university clinical center [8] and an academic hospital emergency department [9]. Experimental research that focuses on examining the accuracy of thermography-based methods in public spaces [10,11] has also been conducted.
This study offers an additional insight into determining restrictions for high school campus entry because adolescents have been shown to have different body temperatures compared to adults or children. Lee and Chun [12] found that adolescents have a higher mean skin temperature than adults. According to Gillum [13], body temperature was unrelated to age in children aged 6 to 11 years old and there was almost no sex difference. However, mean body temperature fell with increasing age in adolescents aged 12 to 17 years old, with females having higher mean body temperatures than males except at ages 16 to 17.
By identifying sex and local ambient conditions as sources of temperature variation, this analysis can assist in interpreting temperature readings more rigorously, especially when monitoring infectious disease processes at school. More broadly, these differences should be taken into account when setting class schedules, designing classroom environments, and conducting health checks for adolescents.
MATERIALS AND METHODS.
Study setting and subjects.
Regular temperature screening was used to detect COVID-19 at Beijing No. 4 High School (International Campus) between September and October 2022. The school required all students attending in person to have their temperatures measured in the classroom at two distinct times of day. One student was designated to repeatedly measure and record the body temperatures of their classmates every day in each class. The detection equipment used was a hand-held infrared thermometer gun (Model: TP500, CONTEC). It was pointed at the inner-side of the wrist from a distance of 2-3 inches without physical contact to check the skin surface temperature in free-living conditions. On a daily basis, the first temperature check was performed early in the morning before class started at 8 am., and the second was taken at noon during the lunch break which ended at 1 pm.
The school granted approval to use the collected temperature data of students in one class for this study, and the data was de-identified by removing names. The class consisted of 25 Grade 10 students (15 to 16 years of age), including 12 females and 13 males. Data are available for 14 non-consecutive days during the study period spanning from September 15th to October 24th, with disruptions due to a self-isolation period caused by coronavirus close contacts, weekends, and holidays. There are 22 missing values when a student was absent from school or skipped the temperature check occasionally, resulting in a total of 678 observations. No fever was detected and the highest temperature level was 36.8°C, which was strictly below the threshold for permitting campus entry.
Statistical analysis.
Temperature differences between females and males were explored using analysis of covariance (ANCOVA) adjusted for the time of day (morning or noon) and the date of collection. The date of collection was considered an important potential covariate due to known variations in the classroom environment (e.g., temperature, humidity and CO2 concentration) and class schedules over time. Pearson correlations were conducted between skin temperature and outdoor air temperature. I also constructed a variable that indicates whether noon followed a morning with physical education (P.E.) class in the last two sessions. This indicator was added to the ANCOVA analysis as an independent variable to examine whether exercise is an additional factor contributing to variations in skin temperature.
Considering the repeated measures, I further employed a linear mixed-effects model to investigate how body temperature varies with gender, time of day and date of collection. First, I transformed the data into longitudinal form, where all repeated measures of body temperature over time of day and date taken from the same individual, were listed as one observation. Second, a random intercept and random slopes across individuals were added to account for variation across individuals in addition to the fixed effects in the regression model. This approach is not only analogous to conducting a repeated measures ANOVA, but also allows for missing observations within subjects. All statistical analyses were performed using SPSS (Version 27, IBM). Values of P < 0.05 were considered statistically significant.
RESULTS.
Table 1 presents the mean skin body temperature levels. The temporal patterns observed in the pairwise associations between sex and time of day (females in the morning, females at noon, males in the morning, and males at noon) are illustrated in Figure 1. The decreasing trends over 14 days were apparent for each subgroup with increasing fluctuations, which could be largely driven by declining outdoor air temperature. I collected the lowest and highest outdoor temperature data for each day in Beijing from China Meteorological Administration. The lowest temperature was considered the outdoor temperature corresponding to the skin temperature measured in the morning, while the highest temperature corresponded to the outdoor temperature when skin temperature was measured at noon. By correlating skin temperature with outdoor temperature, I found that their Pearson correlation coefficient was 0.432 and significant (p=0.000). Nevertheless, differences existed between the four subgroup profiles, with females in the morning tending to have the lowest mean body temperatures, and males in the morning having the second lowest, compared to other subgroups in general.
| Table 1. Descriptive Statistics of the Body Temperature | ||||||
| Total Participants | Females (n=13) | Males (n=12) | ||||
| Mean (°C) | SD (°C) | Mean (°C) | SD (°C) | Mean (°C) | SD (°C) | |
| Morning | 35.14 | 1.04 | 35.06 | 1.04 | 35.23 | 1.04 |
| Noon | 35.47 | 0.87 | 35.42 | 0.89 | 35.53 | 0.86 |
| Overall | 35.30 | 0.98 | 35.24 | 0.98 | 35.37 | 0.97 |

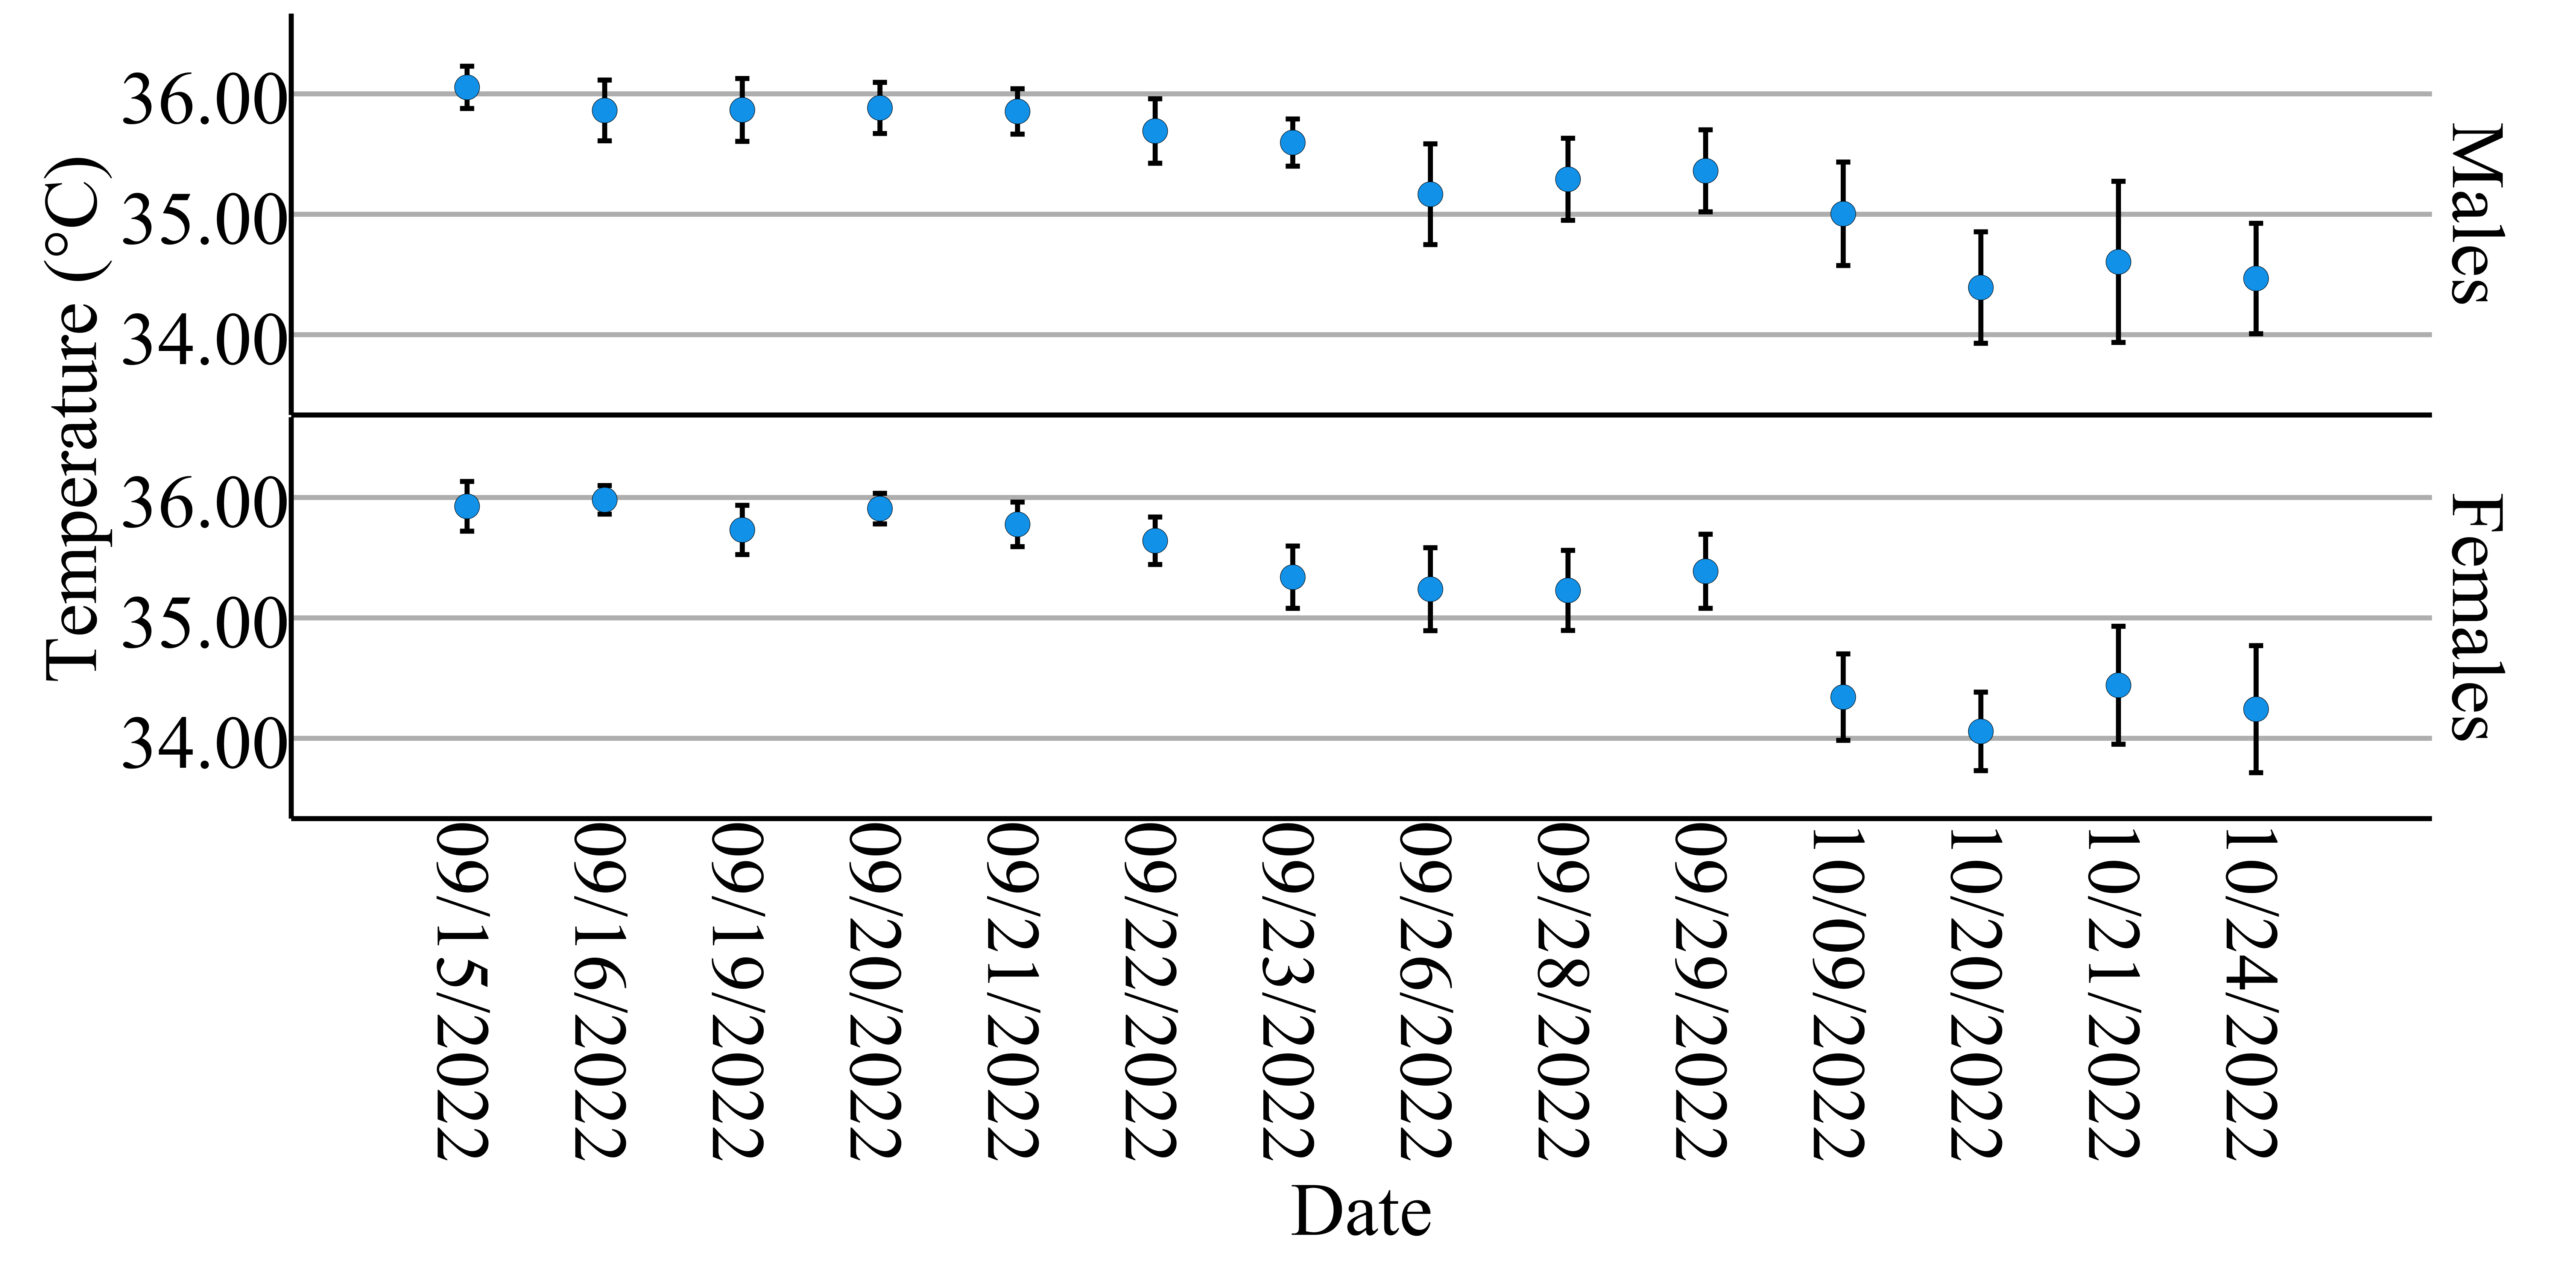
Similar decreasing patterns in mean body temperature by sex with 95% confidence intervals over time are shown in Figure 2. The first discontinuity occurred between September 29th and October 9th due to the national holiday. There were no records after October 9th until October 20th because of a suspected coronavirus infection case. After October 24th, he school campus was closed and classes were held online until the next semester.
The ANCOVA test revealed a significant difference in body temperature between females and males (F1,622=5.138, p=0.024) with time of day (F1,622=30.497, p=0.000) and date of collection (F13,622=31.345, p=0.000) and their interactions as covariates. This indicates that males have higher body temperatures than females after accounting for the effects of time of day and the date of collection. No statistically significant interaction effects were found. Physical Education (P.E.) lessons are scheduled from 9:40-11:10 a.m. on Mondays and Fridays. I investigated whether physical activity could affect body temperature measured at noon after intensive exercise. I used an indicator for Monday noon or Friday noon and added an interaction term between this indicator variable and gender for ANCOVA analysis, but no significant effects were found.
To account for the non-independence of repeated measures on both time of day and date of collection with missing values, I used a linear mixed-effects model to further explore the variations in body temperature. Figure 3 shows a simple scatter plot of body temperature over 14 days, highlighting differences between individuals by allowing each student to have her own regression line. The linear mixed-effects model incorporated a random intercept and multiple random slopes to account for repeated measures taken from the same individual. There were significant effects for gender (F=5.074, p=0.025), time of day (F=30.068, p=0.000) and date (F=32.999, p=0.000). Therefore, the linear mixed-effects model yielded similar results to the initial ANCOVA analysis.

DISCUSSION.
By using an infrared thermometer gun to monitor body temperature twice a day for a total of 14 days in a 10th-grade class (13 males and 12 females), I found that the average wrist temperature of males was slightly higher than that of females. The found gender differences in skin temperature measured in a free-living environment can arise from sexual dimorphisms in both thermogenesis (the internal heat production mechanism) and thermosensation (the perception of external temperature). As stated in Audureau and Geoffroy [14], these discrepancies can be explained by hormonal and mechanical factors such as muscle mass, fat mass and metabolic rate. According to their findings, male hormones inhibit cold sensation. Some studies [15,16] have shown that women have a comparatively larger percentage of body fat distributed subcutaneously, which correlates with lower average skin temperatures. In particular, temperatures are affected by changes in reproductive hormones during the menstrual cycle [17].
This analysis also found that, regardless of gender, the average skin temperature in the morning was lower than that at noon. Additionally, the average body temperature decreased with colder outside weather, and the variations increased. Peripheral body temperature can be quickly and easily monitored using thermometers or infrared-based probes and is more susceptible to ambient conditions. According to Thomas [18], the vessels in our skin constrict, reducing the volume of blood in the skin and heat loss to the environment, on cold mornings. Unlike core temperature, skin temperatures are clearly lower in women than in men, especially in cold air.
This study did not find evidence for a main effect of P.E. class or its differential interaction effects with gender on noon temperature. Changes in skin temperature in response to exercise have been conjectured, but the results in the literature are mixed [7, 19]. Lima et al. [20] explained that about 30% of the heat produced during physical exercise is transformed into work and the other 70% is distributed to the body, thus increasing the body temperature. A possible limitation is that noon temperature was not measured immediately after the end of the exercise.
There are also several other limitations related to this study. First, although the temperatures of all subjects were measured during the same time periods, it was not possible to control for the confounding effects of other individual differences such as activity and clothing. Although the environment is almost all the same, there are still some differences. Second, the sample consisted of students from one class and may not be representative of the general population due to the specific classroom environment, such as whether the air conditioners were on or whether the windows were open. Finally, measurement errors may exist and reduce the power to reveal significant effects if the distance and angle from the thermometer gun could not be kept exactly the same all the time. The accuracy of the thermometer gun can also be affected by its power level.
ACKNOWLEDGMENTS.
I would like to express my gratitude to numerous people from my school: my mentor Jinjing Zeng for her encouragement and guidance; my teacher Lina Li and my classmates who entrusted me with the responsibility of temperature measurement in our class, which sparked the inspiration for this research; my teachers Xiaohua Weng and Hong Li for providing data and agreeing to its use after ensuring the removal of personal information. I would also like to thank my family for their support.
REFERENCES.
- G. Kelly, Body Temperature Variability (Part 1): A Review of the History of Body Temperature and its Variability Due to Site Selection, Biological Rhythms, Fitness, and Aging. Alternative Medicine Review 11, 278–293 (2006).
- I. I. Geneva, B. Cuzzo, T. Fazili, W. Javaid, Normal Body Temperature: A Systematic Review. Open Forum Infectious Diseases 6 (2019).
- M. Sund-Levander, C. Forsberg, L. K. Wahren, Normal oral, rectal, tympanic and axillary body temperature in adult men and women: a systematic literature review. Scand J Caring Sci 16, 122–128 (2002).
- F. C. Baker, et al. Sleep and 24 hour body temperatures: a comparison in young men, naturally cycling women and women taking hormonal contraceptives. The Journal of Physiology 530, 565–574 (2001).
- R. Yanovich, I. Ketko, N. Charkoudian, Sex Differences in Human Thermoregulation: Relevance for 2020 and Beyond. Physiology 35, 177–184 (2020).
- M. B. Andreucci, A. Marvuglia, M. Baltov, P. Hansen, Eds., Rethinking Sustainability Towards a Regenerative Economy (Springer International Publishing, Cham, 2021)
- S. N. Facente, et al. Feasibility and effectiveness of daily temperature screening to detect COVID-19 in a prospective cohort at a large public university. BMC Public Health 21, 1693 (2021).
- P. Filipowicz, M. Kowalewski, K. Slominska, M. Kaczmarek, “Analysis of the influence of external conditions on temperature readings in thermograms and adaptive adjustment of the measured temperature value” in 2022 15th International Conference on Human System Interaction (HSI), pp. 1–6.
- C. T. Berdahl, et al. Using body temperature and variables commonly available in the EHR to predict acute infection: a proof-of-concept study showing improved pretest probability estimates for acute COVID-19 infection among discharged emergency department patients. Diagnosis 8, 450–457 (2021).
- K. A. Goggins, E. J. Tetzlaff, W. W. Young, A. A. Godwin, SARS CoV-2 (Covid-19) workplace temperature screening: Seasonal concerns for thermal detection in northern regions. Applied Ergonomics 98, 103576 (2022).
- G. Lippi, R. Nocini, C. Mattiuzzi, B. M. Henry, Is body temperature mass screening a reliable and safe option for preventing COVID-19 spread? Diagnosis 9, 195–198 (2022).
- J. Lee, C. Chun, Adolescents’ thermal comfort and skin temperature compared to young adults. Healthy Buildings-Europe, https://hdl.handle.net/11250/2976051 (2021).
- R. F. Gillum, Body temperature and its relationship to demographic and cardiovascular risk factors in a national sample of children and adolescents. Journal of the National Medical Association. 84, 591–599 (1992).
- W. Audureau, R. Geoffroy, Why are women more sensitive to the cold than men? https://www.lemonde.fr/en/les-decodeurs/article/2023/01/18/why-are-women-more-sensitive-to-the-cold-than-men_6012097_8.html (2023).
- E. B. Neves, A. C. C. Salamunes, R. M. De Oliveira, A. M. W. Stadnik, Effect of body fat and gender on body temperature distribution. Journal of Thermal Biology 70, 1–8 (2017).
- A. C. C. Salamunes, A. M. W. Stadnik, E. B. Neves, The effect of body fat percentage and body fat distribution on skin surface temperature with infrared thermography. Journal of Thermal Biology 66, 1–9 (2017).
- M. Shilaih, et al. Modern fertility awareness methods: wrist wearables capture the changes in temperature associated with the menstrual cycle. Bioscience Reports 38 (2018).
- 18. Thomas, Monday’s medical myth: men are hotter than women. https://theconversation.com/mondays-medical-myth-men-are-hotter-than-women-6738 (2012).
- D. Gagnon, G. P. Kenny, Sex differences in thermoeffector responses during exercise at fixed requirements for heat loss. Journal of Applied Physiology 113, 746–757 (2012).
- W. A. Lima, et al. Body temperature and dehydration rate in adolescents undergoing the Cooper’s 12-minute run test. Manual Therapy, Posturology & Rehabilitation Journal, 15, 1–5 (2017).

Posted by buchanle on Tuesday, April 30, 2024 in May 2024.
Tags: Adolescents, Body Temperature, COVID-19, Gender Difference