Electrodialytic Crystallization for Non-Evaporative Water and Salt Recovery
ABSTRACT
The goal of the electro-dialytic crystallization (EDC) project was to create a system for desalinating brine from reverse osmosis (RO) and producing salt crystals. The system had to be efficient, modular, and non-evaporative. The tests consisted of running a brine solution through the electrodialysis system and outputting the concentrated brine into a crystallizer that was cooled at low temperature. Many similar studies have yielded similar results, but almost all of them use non-coherent systems that separate the electrodialysis cell from the crystallizer. This resulted in higher rates of crystal production. The conclusion of the continuing experiments was that the EDC system can theoretically achieve zero liquid discharge (ZLD) in the form of pure salt crystals with a sodium sulfate solution. In the future we hope to test different kinds of solutions to see if they can also potentially achieve ZLD.
INTRODUCTION.
The creation of many of the commodities that are enjoyed today by the general public output some form of saline brine. Some examples include the water used to carry ores out from deep in mines, the water that is created when washing preserving salts off of food, as well as to be used in the washing of ore to find impurities. All of these processes create wastewater of some sort and if this wastewater is at all saline, then it is considered to be wastewater brine. In order for it, or the water used in (Thirsty? how ’bout a cool, refreshing cup of seawater?), to be safely handled, this brine must be put through a series of systems that makes use of evaporation in order to separate the salts from the then distilled water. The salts are then either collected for reuse or disposal, and the water can then be either put back into the ecosystem or reused. This process is known as Zero Liquid Dishcharge (ZLD) and is the goal all of processes for reclaiming pure water and pure salt from saline brine. While these processes are effective, they are not efficient. That is because this process evaporates the water, thus breaking the hydrogen bonds between the water molecules. While this process is “free” due to the fact that the only energy input that is necessary is the current flow and the thermal energy that is harnessed from the sun, the breaking of these bonds does take a massive amount of energy that could be better served elsewhere. Thus, the goal of the EDC (Electrodialisis Crystalization) project was to eliminate the two most energy intensive steps in the saltwater brine treatment process, those being the concentration and crystallization steps, and replace them with a system that can achieve ZLD and do it non-evaporatively, thus with less energy. ZLD will be defined as achived when the rate of suspended solids that are being removed is at a level that apon scaling the system to a theoreticly industrial level, the two outputs of the system are pure water and pure salt. The modern methods can be seen in Figure S1.
Electrodialysis is a process that makes use of ion exchange membranes and an electric field to desalinate water very efficiently. It works through forcing solutes of different charges in and out of different channels in order to input one dilute channel, one brine channel, and a looped rinse channel to satisfy the charge in both solutions. A similar method is described in the Experimental Setup section of (Vallejo-Castaño & Sánchez-Sáenz, 2017).
An electrodialysis cell can be made with a varying number of channels. The number of channels determines the exact number of diluted solution input and output as well as the number of brine outputs and inputs. As seen in Figure 1, the salt solution, in this case sodium chloride, is inputted on the second and fourth channels. All of the chlorine anions are drawn to the anode, and the sodium cations are drawn to the cathode. The different membranes inside of the ED cell only allow specifically charged particles to pass through.
|
||
|
||
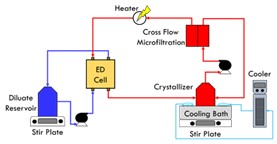
| Figure 1. A) The layout of the EDC system that was used in the experiments. B) A diagram of the inside of the ED cell in a traditional EDC system. |
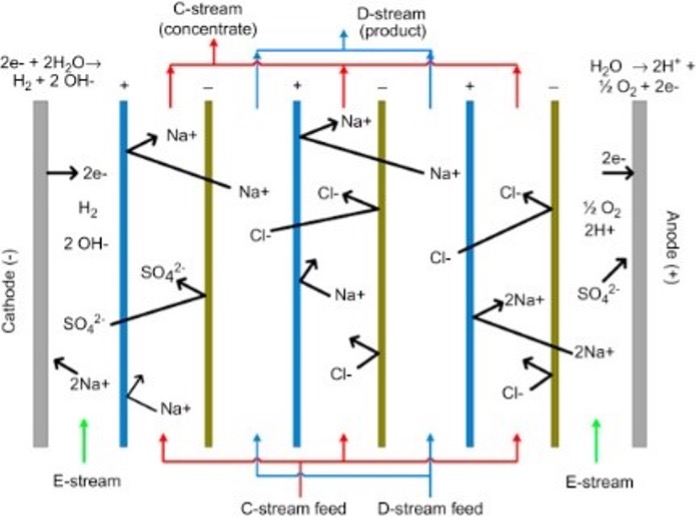
The result, as shown in Figure 1, is that one of the outflow channels has a higher concentration of sodium chloride. Thus, the two remaining outflow channels have a diluted solution and after enough cycles should be water with very low concentrations of salt.
The ED cell that is used in the ED.C is very similar, but it is oriented such that there is one dilute channel, one brine channel and rinse channels on either side.
Similar systems have been used before to some effect such as in (Ryu et al., 2012), and many of the fundamental elements have been thoroughly tested in countless studies. The main difference between these systems and the one that was tested in this study is that the crystallizer and the electrodialysis cell were a part of the same system.
MATERIALS AND METHODS.
The EDC is a system of devices that makes use of primarily electrodialysis. As seen in Figure S2, the basics of an EDC system involve filtering the brine therefor increaseing the concentration. As Figure S3 demonstrates, after the brine has produced crystals or the system has theoretclly achieved ZLD, the salt crystals can be collected for repurposing or disposal.
As seen in Figure S3, as the brine tank increases in concentration, the solution becomes supersaturated and as the salt crystals are increasing in density in the brine tank the individual crystals increase in size. Past experiments with the electrodialysis cell and the crystallizer system were separate. In the separated system, some of the salt crystals got to as large as 0.5 cm in diameter. The goal of the combined system was to produce similar results.
The EDC system specifically uses of two different containers of solution. As seen in Figure 1, one container has 63.8 g/L Na2SO4 dilute solution and the crystallizer has a saturated brine solution (192g/L, corresponding to Na2SO4 solubility at 20 degrees Celsius). The brine solution will be kept at 18 degrees Celsius with a cooling water bath. The process starts in the brine solution and is then put through the microfiltration cell and ED cell. This then filters out a diluted channel of the ED cell and a brine channel that is more highly concentrated. With the force of the electric field, ions are enriched in the brine solution. The brine is then fed back into the crystallizer and when the concentration exceeds the solubility, the salt crystals continue to form in the crystallizer. A cross-flow microfiltration (MF) unit is placed between the ED cell and crystallizer in order to prevent salt crystals from entering the ED cell and the consequent channel blockage.
The experiments are conducted at constant current mode and measurements are taken every 15 minutes on the voltage running through the system. In the measurement windows, both the temperature and conductivity are recorded for both the brine and dilute solutions. Every hour, additional measurements of total suspended solids (TSS) are taken in the form of gathering crystal samples from the top, middle and bottom of the container of brine solution. These samples are then fed through an additional microfiltration membrane that separates the salts from the solution. The volume of the water is then recorded and discarded. The remaining salts are then put into an oven on the membrane for one hour to evaporate any remaining water and the mass of the dried salt crystals will be recorded. The average ratio of the mass/volume will be recognized as the TSS result. This process was repeated for each of the three samples, and again every hour. Just before preparing the next samples, the weight of the evaporated salt was recorded. The data collection window was three hours each time.
At differing points throughout the experimentation windows, pictures were taken using a microscope to determine the average size of the salt crystals in the brine mixture. This was then analyzed and recorded. In addition, the density of salt crystals was also determined using the data that had been gathered. Figure S6 is a group of a few examples of the pictures that were taken. This measurement, combined with the conductivity and the time at which the measurements were taken were some of the major components as to determining if a solution was capable of achieving ZLD.
RESULTS.
As expected, the voltage was stable within the system once the current density was set (Figure S5) and the concentration of salts in the dilute solution decreased over time as the system ran (Figure S4). The voltage remained the same as the current remained stable. Although ZLD was never achieved in the 3-hour observation periods, the data shows that given enough time and a high enough current density, the EDC system could achieve ZLD with specific conditions. As shown in Figure 2, the higher current densities have shown to increase salt production rate and the crystal production increases with the extension of time. The size of the salt crystals also increases with higher current densities, as shown in Figure S6. Detailed inspection of samples gathered from the top, middle, and bottom of the brine container showed that although the brine was kept at a constant temperature and continuously stirred using a magnetic stirrer, a large percentage of the salt crystals accumulated closer to the bottom of the container at 300 rpm, as shown in Figure 3. This suggests that modifications of the stirring speed may need to be made to the design in order to measure and filter the brine more accurately/effectively. Another observation during experiments was the need for small pumps in order to ensure that the flow of water in all sections of the tubing was constant.
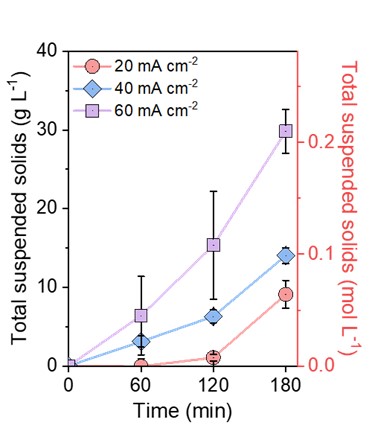
Figure 2. Total suspended solids (TSS) production rate in the EDC system at different current densities.
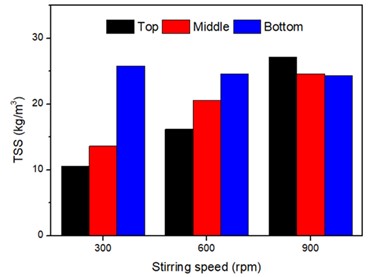
Figure 3. The effect of stirring speed and sampling position on TSS values. The saturated Na2SO4 brine (192 g/L) was crystalized at 18 degrees Celsius without being pumped into the ED cell.
DISCUSSION.
The data provided above proves that the EDC performs well enough to meet the minimum goals of the project – to simultaneously achieve the desalination of RO concentrate and crystallization of salts. The experiment is still ongoing and will continue to test different solutions, different concentrations, and possibly different mixtures of solutions. After looking through various sources, interesting results were seen in (Ryu et al., 2012). This paper made use of a similar ED cell as the one used in this project, except the remainder of the system was made with the goal of power extraction and made use of sea water and river water as opposed to the salt brine and distilled water used in this project. This may be a possible direction that the project could be taken in the future. Despite the efficiency of the system, the slower speed of it is evident by the three-hour recording period to be able to gather a reasonable amount crystals in the brine tank. The system still needs further research and refinement if it is to overtake evaporative methods in the crystallization of industrial saltwater brine, but it has shown that the potential for this system is realistically obtainable.
ACKNOWLEDGMENTS.
Many thanks to Dr. Shihong Lin for permitting me to write this paper and for allowing me to work in the laboratory. Thanks as well to Xudong Zhang and Ruoyu Wang for helping me in ensuring this project’s success.
SUPPORTING INFORMATION.
Supporting information includes additional illustrations of the experimental systems, plots of the concentration and voltage over time for different energy densities, and example images of salt crystals.
REFERENCES.
- S. Vallejo-Castaño, C. I. Sánchez-Sáenz, Design and optimization of a reverse electrodialysis stack for energy generation through salinity gradients. DYNA, 84(202), 84–91 (2017).
- Msmart, Thirsty? How ’bout a cool, refreshing cup of seawater? (msmart, msmart.vn, 2019)
- H.-W. Ryu, Y.-M. Kim, and Y.-J. Wee, “Influence of operating parameters on concentration and purification of L-lactic acid using electrodialysis,” Biotechnology and Bioprocess Engineering, 17(6), 1261–1269 (2012).

Posted by John Lee on Tuesday, May 30, 2023 in May 2023.
Tags: Brine, Crystallization, Electrodialysis, Salt