Devising a Method for Physically Generating Phase Aberration in Ultrasounds Using Phantoms
ABSTRACT
Phase aberration is a form of ultrasound image degradation caused by acoustic waves propagating through different media possessing different speeds of sound. To generate more realistic models of phase aberration, in this study, we developed Polydimethylsiloxane imaging phantoms that can be used as physical phase aberration layers during ultrasound imaging. These phantoms are created from 3D printed molds, which allows them to produce precise profiles. We demonstrated that our proposed method produces phantoms with a profile that has less than 15% relative error compared to the desired. In addition, an analysis of the collected ultrasound data showed the presence of phase aberrations during imaging. Through these results, we have demonstrated that our model is a viable method of ultrasound phase aberration production. Moreover, due to these phantoms being physical models, we believe that a wider range of imaging variables can be captured to provide a more realistic representation of phase aberration, which will lead to more accurate systems of correcting it.
INTRODUCTION.
Ultrasound is a non-invasive technique of imaging the human body. Because of this, it is vital to the medical industry. In ultrasound, a transducer array consisting of piezoelectric elements is utilized to transmit sound waves into an imaging medium. These sound waves are then reflected off objects in the medium, and the reflected echoes travel back to the elements, where they are converted into electrical signals. Once converted, the signals are mapped to the depth locations in the medium from which they originated. This process is referred to as beamforming, and it entails computing the path length differences between the returning acoustic wavefronts and each of the elements on the transducer array. These path length differences are then converted to time delays using an average speed of sound for the given medium, and they are applied to the signals that were originally recieved.
Although ultrasound provides valuable diagnostic information for a variety of clinical scenarios, such as examinations of internal organs, the images produced by it are often of suboptimal quality. One source of image degradation that causes this suboptimal quality is phase aberration. This distortion occurs when the signal waves propagate through different media in the human body that possess different speeds of sound. This effect is most notably seen when the signals travel through heterogeneous tissues. Parts of the signal waves propagating through different media return to the transducer at different times. This difference in signal travel times causes a distortion of the ultrasound. Thomenius discussed that the best beamformer uses image formation from a complete data set [1]. Because the signals are not returning to the transducer at the same time, the data set is unaligned. Moreover, this lack of alignment in the data set is the cause of phase aberration.
There have been many studies that address the issue of phase aberration. A study by Flax and O’Donnel used random collections of scatterers to measure phase aberrations which can then be corrected [2], and a study by Larrat et. al employed the use of a magnetic resonance system to correct phase aberration resulting from MRI [3]. There have also been studies that use programming methods to correct phase aberration, such as one by Rau et. al, which used 2D speed of sound map estimations [4]. However, most studies on phase aberration correction methods use software simulations to generate the phase aberrations that they apply their proposed correction methods to. We believe this method to not be realistic, as it does not account for real world issues that can be encountered when imaging, such as tissue imperfections or discrepancies with the imaging system.
Therefore, in this study, we propose a method for creating physical phase aberration phantoms that have the potential to provide a more realistic model of phase aberration when compared to conventional simulation approaches. These phantoms are constructed from PDMS due to its acoustic properties, specifically its attenuation, which is lower than most materials. Additionally, it has a density similar to water (~1.03x) [5]. These phantoms can act as aberration layers when performing ultrasound imaging. The ability to generate more realistic phase aberrations has important implications, such as allowing for the development of more robust phase aberration correction methods, such as the use of a machine learning algorithm that is trained to recognize and correct instances of phase aberration. This, in turn, will allow for improved ultrasound image quality and increased diagnostic value of the modality.
MATERIALS AND METHODS.
To develop physical phase aberration phantoms, PDMS was chosen as the material to use for fabrication. PDMS has a different speed of sound when compared to water and soft tissue, which means that when creating a phantom with PDMS, the thickness of the phantom can be varied at different points along it. Therefore, when a sound wave is transmitted through this phantom, different elements of the propagating wavefront will travel through the PDMS for varying amounts of time before reaching the intended imaging medium located below the phantom layer. The speed of sound mismatch between the PDMS and the intended imaging medium results in relative time shifts in the returning signals detected by the elements of the transducer. In other words, modulating the thickness of a given phantom allows for local sound speed inhomogeneities and thus phase aberrations to be introduced.
Molds. For a phantom to produce phase aberrations that follow a user-specified profile, the ability to precisely manipulate the PDMS thickness values along the phantom is required. First, the MATLAB programming language was utilized to develop a program that allows for two parameters to be inputted by a user, and the output is an aberration profile. The first input parameter is the root mean square (RMS) of the aberration profile, which characterizes the amplitude of the time shifts. The second input parameter is the full width half maximum (FWHM) of the autocorrelation of the aberration profile, which characterizes the correlation length of the time shifts. These two parameters were chosen since they are commonly reported in the ultrasound literature to describe phase aberration [8]. Thus, different values can be utilized to mimic phase aberration in different clinical imaging scenarios.
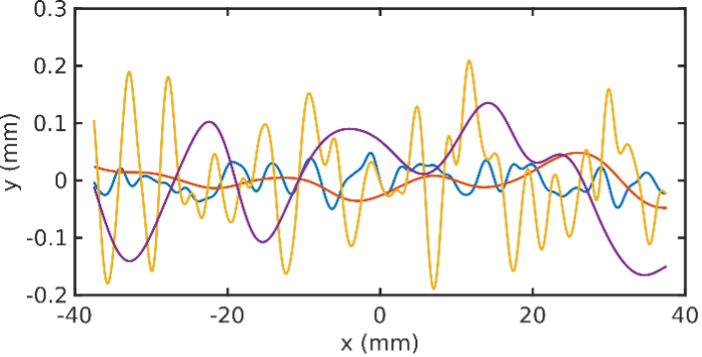
With the RMS and FWHM values that are specified by the user according to realistic values that would be expected to be found in human tissues, an aberration profile is created with those characteristics, and this is exhibited in Figure 1. Moreover, the profile is converted from time shifts to physical thickness values at different points along the phantom. This is done by multiplying the time shifts of the profile by the speed of sound in PDMS. Once the profile is created, it is converted into a three-dimensional surface using Blender3D, and the height of this surface along different points corresponds to the calculated profile. See S1 for an example of this process. This surface is then exported to Preform, a program for preparing 3D files for printing, and it is 3D-printed using a resin printer set to the highest resolution to obtain a physical mold into which PDMS can be poured and cured to create a PDMS phantom with varying thickness values along the phantom.
 |
|
| rms (ns) = 20 , fwhm (mm) = 2
rms = 80 , fwhm = 2 |
rms = 20, fwhm = 8
rms = 80 , fwhm = 8 |
| Figure 1. Example plots of phase aberration profiles generated in MATLAB using various root mean squared and full width half max values. Blue line is an example of low RMS and low FWHM, orange line is low RMS high FWHM, yellow line is high RMS low FWHM, and purple line is high RMS and high FWHM. X-axis corresponds to RMS and Y-axis corresponds to FWHM | |
These aberration profiles are then fitted into a well printed from Formlabs Grey Pro 3D resin designed in Solidworks. These wells are designed to friction fit with the aberration profile to prevent the PDMS from leaking. As an extra precaution, the wells have a small hole through the bottom that acts as a seal by creating a gap too small for the PDMS to leak through and streamlines the process of removing the aberration profile. Once both pieces are printed and put together, they are brushed with acrylic lacquer, which acts as a release agent. A release agent is vital to this procedure to prevent the PDMS from adhering to the mold. We compared several types of release agents in a brief observational study shown in S2, where our criteria for the optimal agent included ease of PDMS removal from the mold and minimization of air bubbles in the PDMS. Based on this study, acrylic lacquer was selected as the release agent.
Phantoms. The phantoms we used in this study were made with the following protocol: PDMS was poured in a 10:1 ratio of base to curing agent. PDMS was then mixed for 2 minutes. Then the PDMS was poured into a 2-piece mold and degassed for 30 minutes. Once degassed, the molds were covered with a lid and baked at 80 degrees Celsius for 4 hours. After being cured, the phantoms were removed from the molds by scoring the sides with a knife and pushing the aberration profile out of the well. This procedure is demonstrated in S3.
Imaging. For data collection, we utilized a linear ultrasound transducer array to image a cross section of a metallic wire that acted as a point target. The imaging was performed in a tub of deionized water. After gathering a control set of channel data where a PDMS phantom was not used, we then collected another set of channel data in which a phantom was placed as a layer between the transducer and the wire. In this scenario, the flat face of the phantom was pressed against the transducer while imagining as shown in S4.
Data Analysis. Data Analysis: For our results to be accurate, we needed to verify that the aberration profiles we printed and then coated were close to the original generations in MATLAB. For the verification process, we used an optical coherence tomography (OCT) scan to measure the distance between the peaks and valleys of the printed aberration profile mold after coating had been applied. We used an OCT because it allows us to obtain a high-resolution scan of the phantom mold surface. We then compared the distances between peaks and troughs using MATLAB. The program we used performed the following calculation to find the relative error of the molds with coating applied. For this case we compared the relative error of the RMS and FWHM values with Equation 1. We define the height difference between peaks and troughs of simulated and experimental profiles to be Hsim and Hexp respectively. The output for this equation is the difference in height between the peaks and troughs of the simulated profiles and the printed molds. This information is used to compare how close our printed profiles were to simulation. We do not have information on the lateral positions of peaks and troughs. In addition, for the ultrasound data that was collected when imaging the metallic wire, the channel data were plotted to observe potential phase aberrations caused by the presence of a phantom.
\[\frac{H_{sim}-H_{exp}}{H_{sim}}x100\tag{1}\]
RESULTS.
Mold Accuracy. We found a relative height error of 14% when comparing the coated molds to the profiles generated in simulation.
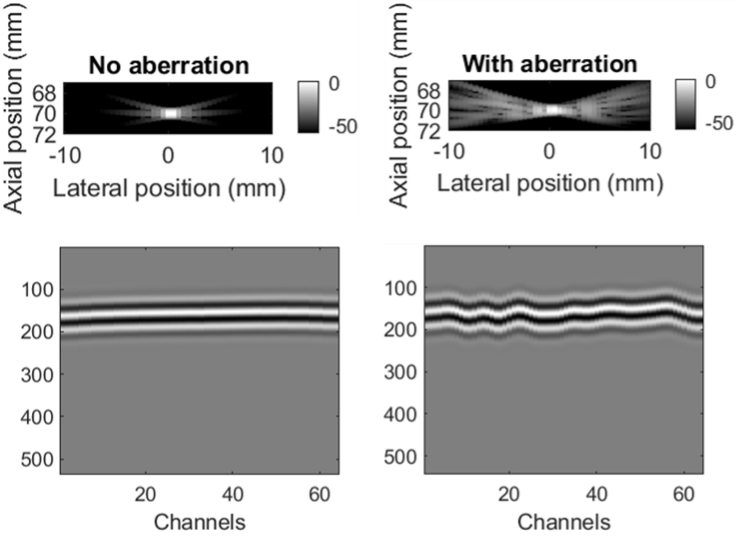
Imaging. Figure 2 shows a simulated instance of phase aberration during ultrasound imaging. The data in this image represents a simulated point target. For this example, we used Field II, an ultrasound simulation package [6, 7]. Columns (A) and (B) demonstrate the ultrasound image and channel data with and without phase aberration respectively. This image is meant to serve as an example of what typical phase aberration would look like, but it is important to note that normal phase aberration through the human body would be less severe.
 |
| (A) (B)
Figure 2. Ultrasound image and channel data before (A) and after (B) phase aberration was applied using simulation. The channel data corresponds to a vertical line through the center of the point target. For channel data, the X-axis corresponds to point placement along the channels and the Y-axis corresponds to depth. The pixel values represent the image quality of the target. The aberration in this figure was generated using simulation. |
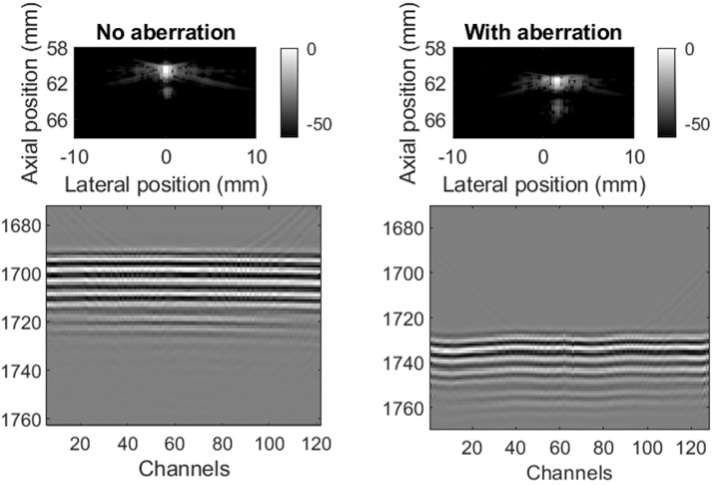
Figure 3 shows the ultrasound imaging results when we used our phantoms to cause phase aberration during the imaging of a cross section of a wire. Columns (A) and (B) demonstrate the ultrasound image and channel data with and without the PDMS phantom respectively. The images with the phantom show a wave pattern similar in shape to the phantom profile, which demonstrates a clear instance of phase aberration. The severity of aberration differs between Figure 2 and 3.
 |
| (A) (B)
Figure 3. Ultrasound image and channel data before (A) and after (B) PDMS phase aberration phantom was used (see figure 2 for axis information). These images provide examples of what phase aberration could look like in live ultrasound. |
This does not mean that the simulated phase aberration was more accurate, as both examples used different RMS and FWHM values (Simulation: RMS = 30ns, FWHM = 4mm; Phantom: RMS = 70ns, FWHM = 3.17mm).
DISCUSSION.
Our results demonstrate that we successfully generated phase aberration. As shown in Figure 3, we were able to observe image degradation when the phantoms were present in the ultrasound images. Additionally, the surfaces of our molds were very similar to those of our simulated profiles, at a relative error of only 14%. We also found that 4 mm of thickness was most optimal, as a vein-like pattern formed on the bottom of the phantoms when the thickness exceeded 4 mm and thinner phantoms were at risk of tearing when we removed them from the molds. In Figure 3, the point target appears to be shifted down in because of the phantom. This is not caused by the aberration profile itself, but instead by the thickness of the phantom. If it were infinitely thin, this shift would not have occurred. It would be possible to fix this in software. We believe that these phantoms are more realistic than simulations because we are capturing the actual transmit pulse characteristics of the imaging system. This might be difficult to reproduce in simulation. Furthermore, we are capturing aspects of wave propagation that some simulation tools do not model like nonlinear propagation. Additionally, we can use the phantoms as a layer on top of anything that doesn’t have too big of an acoustic impedance mismatch against PDMS, meaning that we can create phase aberrations for a large variety of scenarios. These results suggest that phantoms can be used as a viable method of physically creating phase aberration. Furthermore, we have demonstrated through our results that our method of using 3D printed molds is a viable form of creating aberration phantoms.
To our knowledge, there have not been many studies investigating phase aberration generated through physical means. As a result, few sources exist to compare our phantoms to as a form of physical generation of phase aberration. Because of this, we can only compare our results to simulations of phase aberration. We believe that our method is more realistic because simulated phase aberration does not account for various imperfections in imaging systems. One of the most notable imperfections unaccounted for by simulation is aberration integration error (AIE). When signal waves reflect off heterogeneous tissue, its aberrated wavefront is continuous in space. However, the transducer only has a finite number of elements with finite spacing between them. This implies that the phase delay arriving at each element is averaged across the width of each element, leading to a disconnect between the physical world and in-silico simulations. This disconnect cannot be realistically simulated by applying phase aberration in simulation. By making a physical phantom and recreating the continuous aberrated wavefront, we incorporate AIE into our dataset, increasing its fidelity.
Our method of aberration generation is also much faster than simulations. It can take simulations days to process the data points. Our method, however, only takes half a day to produce a mold and phantom, both of which can be used several times. These results have important implications for the correction of phase aberration, an issue within imaging that greatly lowers the diagnostic value of the produced images. This method of using phantoms to create phase aberration can be used for several applications, such as creating higher quality data to train deep neural networks for phase aberration suppression.
ACKNOWLEDGMENTS.
Thanks to Ying-Chun Pan for his support throughout this research. And thanks to Christopher Khan, Katy Craft, and Dr. Brett Byram for their contributions to this research. A special thanks to VISE for allowing us to utilize their resources.
SUPPORTING INFORMATION.
Supporting figures include an example of how the aberration profiles were designed in Blender 3D, an observational study on different release agents, and representations of the phantom making and data acquisition processes.
REFERENCES
- K. Thomenius, Evolution of Ultrasound Beamformers. IEEE Ultrasonics Symposium. 2, 1615-1622 (1996).
- S. Flax and M. O’Donnel, Phase-Aberration Correction Using Signals From Point Reflectors and Diffuse Scatterers: Basic Principles. IEEE Transactions on Ultrasonics, Ferroelectrics, and Frequency Control. 35(6), 758-767 (1988).
- B. Larrat, M. Pernod, G. Montaldo, M. Fink, M. Tanter, MR-Guided Adaptive Focusing of Ultrasound. IEEE Transactions on Ultrasonics, Ferroelectrics, and Frequency Control. 57(8), 1734-1747 (2010).
- R. Rau, D. Schweizer, V. Vishnevskiy, O. Goksel, Ultrasound Aberration Correction based on Local Speed-of-Sound Map Estimation. Computer-assisted Applications in Medicine. (2019).
- X. Guangyao, N. Zhengyang, C. Xizhou, T. Juan, G. Xiasheng, B. Henrik, Z. Dong, Acoustic Characterization of Polydimethylsiloxane for Microscale Acoustofluidics. Physical Review Applied. 13, 5, (2020)
- J. A. Jensen, FIELD: A program for simulating ultrasound systems, in Proc. 10th Nordic-Baltic Conf. Biomed. Imag. 4(1), 351–353 (1996).
- J. A. Jensen and N. B. Svendsen, Calculation of pressure fields from arbitrarily shaped, apodized, and excited ultrasound transducers, IEEE Trans. Ultrason., Ferroelectr., Freq. Control. 39(2), 262–267 (1992).
- J. Dahl, D. Geunther, G. Trahey, Adaptive Imaging and Spatial Compounding in the Presence of Aberration, IEEE Transactions on Ultrasonics, Ferroelectrics, and Frequency Control, 52(7), 1131-1144 (2005).

Posted by John Lee on Tuesday, May 30, 2023 in May 2023.
Tags: Aberration, Phantom, Phase, Ultrasound