Determining the provenance of glacial till from the Tucker Glacier, Antarctica
ABSTRACT
The relationship between glaciers and moraines is a crucial interaction as it relates to understanding climate change. This study analyzes zircon crystals from four till samples collected from Shark Fin moraine to determine if the ice from Tucker Glacier in Antarctica has been flowing in different directions or patterns over time. The four samples were collected at different elevations as to identify any differences in the ages or origins of zircon minerals. Zircon minerals were isolated from the till via magnetic, density, and acidic separations. The zircon was transferred onto epoxy mounts and the cores of the crystals were analyzed via Laser Ablation Inductively Coupled Plasma Mass Spectrometry (LA-ICP-MS). GLITTER, a data reduction software, was used to express the mass spectrometry data as U/Pb ratios and to estimate ages. A high elevation site exhibited both younger and older ages of minerals than a lower elevation site. The zircon collected from both sites 02 and 04 appear to be different populations, which indicates a possible change in the flow pattern of Tucker Glacier.
INTRODUCTION.
The relationship between glaciers and moraines is a crucial interaction in relation to understanding climate change [1]. A glacier is a slow-moving mass of ice that is formed by firmly packed snow found on mountains or near the north and south poles. A moraine is a ridge that forms at a glacier’s limits, consisting of sediment and rocks that are transported and deposited by a glacier. In Antarctica, glaciers and moraines are commonly studied for the purpose of understanding how Earth’s ice sheets and glaciers have changed over geologic time. Furthermore, investigating the correlation between glaciers and moraines helps geologists understand the advance and retreat of glaciers over the continent and how ice sheets both create landscapes and erode them away. For example, this idea can be implemented to study Marine Isotope Stage 2 (MIS2), also known as the Last Glacial Maximum. MIS2 is the most recent time span, during the last glacial period, when ice sheets extended to their furthest points [1]. By examining how glaciers and ice sheets have reacted in the past, we can better understand the way they will respond to future climate change.
One way to gather information regarding the past reactions of glaciers and ice sheets is “exposure dating” glacial deposits, mostly using cosmogenic nuclides that form in quartz minerals when exposed on Earth’s surface [2]. The concentration of rare isotopes of elements such as Beryllium, Aluminum, and Neon in quartz are measured to determine how long rock samples have been on Earth’s surface. These samples can range in size from large rocks to till. Larger rocks are slowly eroded as the ice sheet flows over them and are deposited as till at the end of the ice sheet. Analyzing the amount of time samples from a similar region have spent on Earth’s surface helps to determine how ice in the region has changed in shape and size and responded to past changes in Earth’s climate.
Zircon minerals from glacial deposits can provide a record of the types of rocks that the ice was flowing over before the sampled material was deposited. Zircon is used because it doesn’t break down easily, is found in most rock types, and is easily dated via uranium-lead techniques [3]. In this study, the analysis of zircon crystals from four till samples will help to determine if the ice from Tucker Glacier, Antarctica, has been flowing in different directions or patterns over time. Additionally, studying zircon minerals found in different till grain sizes will help determine how much zircon is transported by wind in Antarctica.
The direction that Tucker Glacier has been flowing can be determined based on the minerals’ ages and origins. It has been established that the rock type surrounding the four sample sites is made up of Admiralty Intrusives [4]. If zircon minerals with similar origins and ages are found in the four different till samples, then the ice has been flowing the same way over time. If zircon populations differ between samples, then Tucker Glacier has moved over different rocks and has changed flow direction or pattern over time.
In addition to glacial transport, wind-blown distribution of zircon crystals must be considered. Sorting of zircon crystals by age and grain size would suggest wind-blown distribution. For example, if the small sized zircon shows the same ages in all of the samples, and the larger minerals show different ages, then it can be assumed that there are high amounts of wind-blown zircon in all four of the samples. These differences would be best seen in larger sample sizes.
This study delves into fairly new research regarding the movement of Tucker Glacier. Only a small number of similar studies have been conducted at Tucker Glacier. However, a study of Ong Valley in Antarctica was completed using similar methods as the ones used in this study [5]. Additionally, the Informal Cosmogenic-nuclide Exposure-age Database (ICE-D) finds that the 10Be and 14C exposure ages of samples, collected from Shark Fin on Tucker Glacier, are older when collected from higher elevations [6]. The four samples used in this study were collected at different elevations, so a similar outcome may be seen. By comparing how zircon collected at various elevations differ, past movements of Tucker Glacier across Antarctica can be revealed.
MATERIALS AND METHODS.
Study Area and Sample Collection.
In April 2016, four different till samples were collected near Tucker Glacier in Antarctica (Figure 1). Tucker Glacier is located on the Daniell Peninsula in northern Victoria Land. It flows between the Victory and Admiralty Mountains and into the Ross Sea. The four till samples were hand collected from the Tucker Glacier by Dr. Claire Todd, Pacific Lutheran University, and were divided into three grain sizes (63-125 um, 125-250 um, 250-500 um), creating 12 samples total. Additionally, the four samples were collected at different elevations in order to identify any differences in the ages or origins of the zircon minerals (Figure S1).
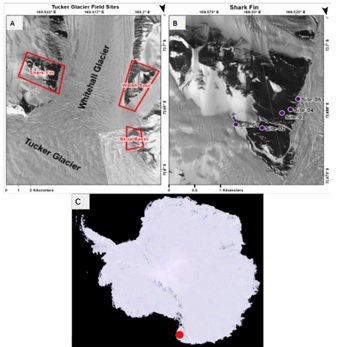
Figure 1. Tucker Glacier and the surrounding area. A shows the locations of Tucker Glacier and the three surrounding moraines. B shows the collection sites of the till used in this study. C shows a red dot on Antarctica’s Daniell Peninsula, the location of Tucker Glacier.
Sample Processing.
Zircon crystals from the three different till grain sizes, were isolated and analyzed. Each of the 12 till samples were washed with water until the water turned clear. The samples were placed in sonic baths overnight in order to remove any excess dirt adhered to zircon crystals. The till samples were then washed in 5% nitric acid (HNO3) and 5% hydrogen chloride (HCl) and rinsed again with water to remove acid. After the acid and water washes, only the till was kept, and samples were placed in an oven to dry.
A hand magnet was used to remove magnetic till, leaving behind zircon, as it is not magnetic. Density separations of the non-magnetic till product were completed in a 1000 mL separating funnel using Lithium heteropolytungstate (LST). During LST density separations, zircon and heavier grains sank to the bottom of the separating funnel and were extracted. The heavy grains and minerals were run through a Frantz Isodynamic Separator to magnetically separate the till on more precise levels. Five rounds of the machine magnetic separation were completed, each round getting slightly more magnetic than the previous (<0.6, 0.6-0.9, 0.9-1.2, 1.2-1.6, >1.6 amperes). Smaller till samples didn’t have to run through all magnetic levels.
A hydrogen fluoride (HF), HNO3, and HCl acid wash was completed on the larger non-magnetic till samples. The acid wash broke down excess material from larger samples, leaving behind mainly zircon. What remained of the samples was then examined under a microscope, and individual zircon crystals were hand-picked out of the till. The zircon crystals were transferred onto one of three glass plates covered with double-sided tape, depending on grain sizes (63-125 um, 125-250 um, 250-500 um). For each grain size, the zircon from each of the four sample sites were arranged into separate rows on the tape. A cylindrical mold was adhered to the tape, and epoxy was poured into the mold. The epoxy was slowly mixed and poured to avoid producing bubbles and was left to harden overnight in order to create a mount. Once the mounts solidified, they were polished slowly, in minute-long intervals, in order to expose the centers of the zircon, which represent the oldest portion of the grains.
Sample Imaging and Analysis.
Images of the polished mounts were produced using a Scanning Electron Microscope (SEM) (Figure 2). The SEM images were used as a map when the mounts were analyzed via Laser Ablation Inductively Coupled Plasma Mass Spectrometry (LA-ICP-MS). Using LA-ICP-MS, holes were burned into the centers of the zircon minerals. The dust produced from the laser procedure was analyzed in a mass spectrometer to detect the levels of Uranium and Lead present in the minerals. SEM images and LA-ICP-MS were only conducted on the smallest grain size (63-125 um). GLITTER, a data reduction software, was used to express the mass spectrometry data as U/Pb levels and estimated ages. If the estimated age was <1,000 million years, the Pb-206/U-238 age was used. If the estimated age was >1,000 million years, the Pb-207/Pb-206 age was used. Histograms and probability curve plots of the estimated ages were produced via MATLAB. Cumulative distribution functions were also created in order to determine the probability that the samples are from the same population. T-tests were completed to determine if the samples are statistically distinguishable.
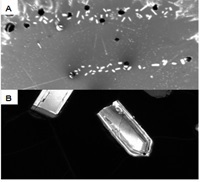
Figure 2. SEM images of zircon minerals from the smallest grain size (63-125 um). A shows the zircon from sites 02 and 04. B shows a zircon mineral from site 02.
RESULTS.
Histograms showing probability density and counts of the zircon express the estimated ages of the minerals for both sites 02 and 04 in million years (Ma) (Figure 3). The ages of zircon from site 02 range from less than 1 Ma to about 800 Ma. The minimum and maximum ages from site 02 are outliers, as the other ages are centered around 400 Ma. The zircon ages for site 04 are also centered near 400 Ma. However, the ages of zircon from site 04 range from about 300 Ma to about 500 Ma.
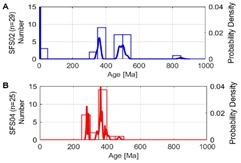
Figure 3. Histograms (50 Ma bin size) showing probability density and counts for the estimated ages of zircon from sites 02 and 04. A shows site 02, with a sample size of 29. B shows site 04, with a sample size of 25.
Of the 29 zircons analyzed from site 02, the oldest zircon was estimated to be about 800 million years old. On the other hand, of the 25 zircons isolated from site 04, the oldest zircon was estimated to be about 500 million years old.
Additionally, a cumulative distribution function shows the percentages of zircon in samples 02 and 04 that have ages younger than a specific age (Figure S2). In addition, the resulting p-value of a t-test completed to determine how statistically similar the zircon from the two sites are was 0.0008.
DISCUSSION.
The zircon collected from sites 02 and 04 appear to be different populations, which indicates that there might have been a change in the flow pattern of Tucker Glacier. The low p-value of 0.0008 suggests that the ages of the zircon collected at the two sites are statistically different. The zircon collected from site 02 were expected to be younger than those at site 04, as it at a higher elevation. However, site 02 exhibited a mix of both younger and older zircon minerals in comparison to zircon from site 04. One scenario that could explain this outcome is the possibility that zircon from smaller grain sizes are carried by the wind. This could be confirmed by analyzing the ages of the zircon from larger grain sizes.
Comparisons of the ages of zircon between the two sites are limited, which stems from the amounts of zircon collected. A substantial number of isolated zircon minerals is desired for dating in order to accurately determine similarities or differences. Previous studies have found that a substantial amount of zircon is qualified as at least 120 zircon grains per sample [5]. Unfortunately, sites 02 and 04 only have 54 polished zircon minerals combined. Originally, there were about 70 zircon minerals isolated in the smallest grain size; However, a little under half of the zircon minerals that had been placed on the 63-125 um grain size epoxy mount were no longer on the mount after the mounting and polishing stage. Only six zircon minerals from the other two sites remained. In addition, the samples in the larger grain sizes presented very few or no zircon minerals. To solidify the analysis of the ages of zircon from all four sites, more zircon would need to be isolated.
Correlations between varying till grain sizes and wind need to be analyzed further, as wind may affect zircon crystal distribution. Wind patterns could be to blame for the lack of zircon from grain sizes 125-250 µm and 250-500 µm.
The origins of the zircon minerals and till collected need to be analyzed to determine if glacial flow patterns across Victorialand have changed over time. For example, rocks surrounding Tucker Glacier are composed primarily of Admiralty Intrusives, Bowers Supergroup, and Robertson Bay Group (Figure S3, Table 1) [4]. If zircon or till with origins of other rock types are found, Tucker Glacier flowed in a different direction than it does currently and was possibly once part of another, larger glacier. Additionally, Tucker Glacier is located near rock formations comprised of the geologically young McMurdo Volcanics, hence the possibility of finding zircon and till with origins from the older rock groups, as well as the much younger McMurdo Volcanics. The younger zircon from site 02 can be explained by these volcanics of the late Cenozoic Period, which are just a few million years old. The Admiralty Intrusives and Bowers Supergroups of the Cambrian and Ordovician Periods are around 540 to 440 million-years-old. Some of the estimated ages of zircon from sites 02 and 04 fall within the age ranges for the Admiralty Intrusives and Bowers Supergroup. Further research should be conducted to determine how the ages of the rocks found in the area surrounding Tucker Glacier compare to those deposited by the glacier.
Table 1. Glacial till parent rock formations and ages (Ma).
| Formation | Time Period | Age (Ma) |
| Robertson Bay Group | Cambrian to early Ordovician | 541-478 |
| Bowers Supergroup | Middle Cambrian to Ordovician | 510-444 |
| Admiralty Intrusives | Devonian | 416-539 |
| McMurdo Volcanics | Late Neogene to Quaternary | 3-0 |
ACKNOWLEDGMENTS.
I would like to express my very great appreciation to Dr. Dan Morgan for guiding me through all aspects of this research project, all the while providing a supportive and educational atmosphere. Advice given by Dr. Jordan Grigor and Dr. Nathan Haag was greatly appreciated. Assistance provided by Dr. Richard Bradshaw and Blake Wallrich was very valuable. My special thanks are extended to the staff of the School for Science and Math at Vanderbilt for providing me with such an amazing opportunity.
SUPPORTING INFORMATION.
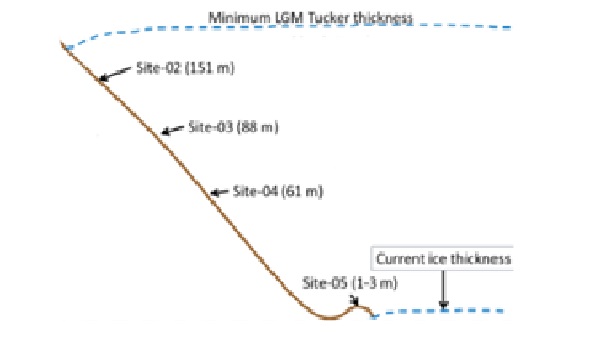
Figure S1. Locations of the 4 sample sites on Shark Fin in relation to the receding ice sheet

Figure S2. Cumulative distribution function for the zircon ages in sites 02 and 04 in the 63-125 um grain size. The percentage of zircon in the sample that has an age younger than a specific age can be determined.

Figure S3. The rocks surrounding Tucker Glacier have been established as admiralty intrusives in “The Ross Orogen of the Transantarctic Mountains.” They are marked by a section of Xs at the base of the Admiralty Mountains.
REFERENCES.
- R. Kaplan, K.J. Licht, G. Winckler, J.M. Schaefer, N. Bader, C. Mathieson, M. Roberts, C.M. Kassab, R. Schwartz, and J.A. Graly, Middle to Late Pleistocene stability of the central East Antarctic Ice Sheet at the head of Law Glacier, Geology, 45, 11, 963-966 (2017).
- Bibby, J. Putkonen, D. Morgan, G. Balco, D.L. Shuster, Million year old ice found under meter thick debris layer in Antarctica, Geophys, 43, 6995-7001 (2016).
- A. Bader, K.J Licht, M.R. Kaplan, C. Kassab, G. Winckler, East Antarctic ice sheet stability recorded in a high-elevation ice-cored moraine, Quaternary Science Reviews, 159, 88-102 (2017).
- Stump, The Ross Orogen of the Transantarctic Mountains (The Edinburgh Building, Cambridge: Cambridge University Press, 1995).
- J. Miranda, D. Morgan, J. Putkonen, G. Balco, and C. Warner, The provenance of glacial till deposited in Ong Valley, central Transantarctic Mountains determined by LA-ICP-MS of detrital zircons, Geological Society of America Abstracts with Programs, 48, 7, (2016).
- Balko, Informal Cosmogenic-nuclide Exposure-age Database (2017). [Online]. Available: http://hess.ess.washington.edu/iced/map/.
Posted by John Lee on Tuesday, December 22, 2020 in May 2019.
Tags: Antarctica, Glacial Till, U/Pb Dating, Zircon