Comparing a Survivin Inhibitor to Carboplatin for Treating Small Cell Lung Cancer in vitro
ABSTRACT
Small cell lung cancer (SCLC) is an aggressive, frequently metastatic form of lung cancer with a higher death rate than all other lung cancer subtypes. Treatment methods for SCLC have not significantly improved since the introduction of platinum-based chemotherapy in the 1980s. One potential therapeutic avenue is targeting survivin, an upregulated oncogene that suppresses apoptosis and regulates mitotic spindle assembly. Inhibitors of these processes are efficacious in treating other types of tumors, such as breast and oral cancers. In this study, the efficacies and potencies of a survivin inhibitor (YM155) and a traditional platinum-based chemotherapy drug (carboplatin) were compared for treating SCLC. Cell growth in each drug was quantified using a bioluminescence cell viability assay and a direct-cell imaging assay. We find that the efficacies (Emax) of both drugs are similar; however, YM155 is more potent (EC50 approximately 45-fold lower) than carboplatin. This increased potency suggests that YM155 can be used at a lower dose concentration than carboplatin to achieve a comparable effect. Further experiments are required to study the combined efficacy of a survivin inhibitor and carboplatin.
INTRODUCTION.
Small cell lung cancer (SCLC) is a subtype of lung cancer characterized by smaller cells in histology stains than those of non-small cell lung cancer (NSCLC). Accounting for approximately 15-20% of all lung cancer cases, SCLC is strongly linked with tobacco inhalation [1,2]. SCLC metastasizes early, and while initially responsive to chemotherapy, it inevitably relapses and becomes resistant to subsequent interventions [1]. Lung and bronchus cancers have the highest yearly estimated death rate of all cancers at 22.3% [3] and it is reasonable to suspect that these death rates will continue to rise with the popularity of nicotine use, particularly vaping, among younger generations [4].
SCLC tumor initiation begins when genes regulating checkpoints in the cell cycle become mutated. The cell cycle is the process through which cells grow and divide, with checkpoints that verify cellular integrity to ensure successful completion of the cell cycle. These checkpoints induce cell cycle arrest when there is DNA damage [5]. The tumor suppressor gene p53 is one of the proteins responsible for controlling the DNA damage checkpoints; however, it is ubiquitously mutated in SCLC, allowing the cancer to continue to grow and divide despite the accrual of DNA damage [6]. SCLC is typically treated with platinum-based agents, such as carboplatin, which induce DNA damage to activate cell death. Because SCLC lacks p53 [7], which monitors the integrity of DNA, carboplatin preferentially damages SCLC. However, these treatments have serious side effects [8,9]. Many cancer patients experience nausea, vomiting, and peripheral sensory neuropathy while undergoing treatments [8]. Additionally, most tumors become resistant to platinum-based drugs, though the resistance mechanism is poorly understood [8]. Despite the high death rate of SCLC and the potentially harmful side effects of traditional platinum-based cancer treatment, there have not been any significant advancements in treatment methods in over three decades [1]. Therefore, a critical need exists for advances in treatment options for SCLC with fewer side effects and more durable responses.
One gene frequently over expressed in SCLC is survivin [10]. Survivin expression is normally suppressed by p53 and it is a critical regulator of mitotic spindle assembly thorough its interactions with Aurora kinase B [11,12]. Additionally, survivin suppresses apoptosis which is canonically activated by p53 in normal cells in response to DNA damage. Survivin suppresses apoptosis by directly binding activated effector caspases 3 and 7, enzymes that are responsible for programmed cell death [13]. Because survivin’s role in regulating cell death (apoptosis) and cell division (mitotic spindle assembly) in the absence of p53 suppression, we predicted targeting survivin would result in a lower growth rate than standard DNA-damaging agents (carboplatin) in SCLC.
YM155 (sepantronium bromide) has previously been found to effectively target survivin and inhibit cell growth in neuroblastoma, pancreatic cancer, and NSCLC, which is why it was chosen for this experiment [14,15,16]. In this study, we compared the efficacies and potencies of carboplatin with YM155 in the treatment of SCLC using the H1048 SCLC cell line model. Potencies and efficacies were compared using two methods for cell growth quantification: bioluminescence and direct-cell imaging.
MATERIALS AND METHODS.
To quantify viable cells, the RealTime-Glo™ MT Cell Viability Assay (RT-Glo) was used (Figure S1). This assay is a bioluminescent method of measuring cell viability in real time that does not kill the cells during measurement (i.e. non-lytic), as opposed to traditional endpoint measurements [17]. In brief, when the NanoLuc® Luciferase (enzyme) and MT Viability Substrate (prosubstrate) are incubated with viable cells, the prosubstrate is reduced by viable cells into the NanoLuc® Substrate. This substrate will then diffuse out of the cells into the media (solution cells are grown in) and react with the NanoLuc® Luciferase to produce light (Figure S1). Live cells are characterized by their ability to reduce the prosubstrate, meaning that a higher number of viable cells will increase the luminescence intensity observed. The second method of cell viability quantification was done by imaging live cells on the Cellavista cell imaging system. Cell nuclei were labeled with an H2B-RFP fluorescent tag via lentiviral transfection and cell count was calculated using image segmentation software.
Two drug response plates (384-well) were set up for this experiment, one for cell quantification using RT-Glo and the other using the Cellavista imaging system. Both consisted of H1048 SCLC cell line cells obtained from the American Type Culture Collection that were treated in triplicate with YM155 (survivin inhibitor), carboplatin (traditional chemotherapy), or DMSO (dimethyl sulfoxide, drug vehicle control), according to a drug plate map (Figure S2). Cells were harvested from T-75 flasks grown to >80% confluency using 2 mL of Gibco™ TrypLE Express Enzyme Solution (1X) after the media was aspirated. The flask was incubated for 6 minutes at 37 °C and then vigorously tapped to loosen any cells that were still adhered to the flask. Next, the cell solution was centrifuged for 5 minutes at 300 g. After centrifuging, the supernatant was aspirated and the cell pellet was resuspended in 1 mL of Roswell Park Memorial Institute culture medium at 37 °C, supplemented with 1% penicillin streptomycin solution and 10% fetal bovine serum, and diluted to a concentration of 400 cells/ 80 µL. Next, for the RT-Glo plate, the MT Cell Viability Substrate and the NanoLuc® Enzyme were added to the cell solution to 1X concentration and mixed. This step was omitted for the Cellavista plate. Using the well plate map, 72 µL of the cell solution was added to each indicated well of the 384 well plate. Then, 80 µL of PBS (phosphate-buffered saline) was added to the border wells, and the plates were incubated at 37 °C overnight. The next day, 8 µL of each treatment (YM155, carboplatin, or DMSO) was serially diluted by a factor of 0.5 starting at a concentration of 10 µM, and no treatment was added to the last wells (see Figure S2 for plate map). The plates were then left to equilibrate in the incubator for one hour before the first measurements were taken.
Following plate set-up, measurements were taken every morning and evening for about 4 days. The luminescence of the plate with the MT Cell Viability Substrate and NanoLuc® Enzyme was measured via the Biotech H1 Synergy Multimode Plate Reader. The fluorescence of the second plate was measured using the Cellavista cell imaging system to quantify cell counts from the images taken.
RESULTS.
This experiment used two methods for cell growth quantification: bioluminescence and direct-cell imaging (see Methods), which will be referred to as RT-Glo and Cellavista, respectively.
Growth curves were first compared for each drug and each data collection method (Figure 1). The drug-induced proliferation rate (DIP rate) for each drug was calculated using the time course graphs. The DIP rate is the slope of the line resulting from graphing the number of cell population doublings over time, and it is an unbiased metric of drug effect as compared to traditional endpoint assays because it considers differential rates of drug action [18]. In general, untreated cells will continuously double while cell populations treated with a slow-acting drug will initially double and then decrease, and cell populations treated with a fast-acting drug will immediately decrease (Figure S3).
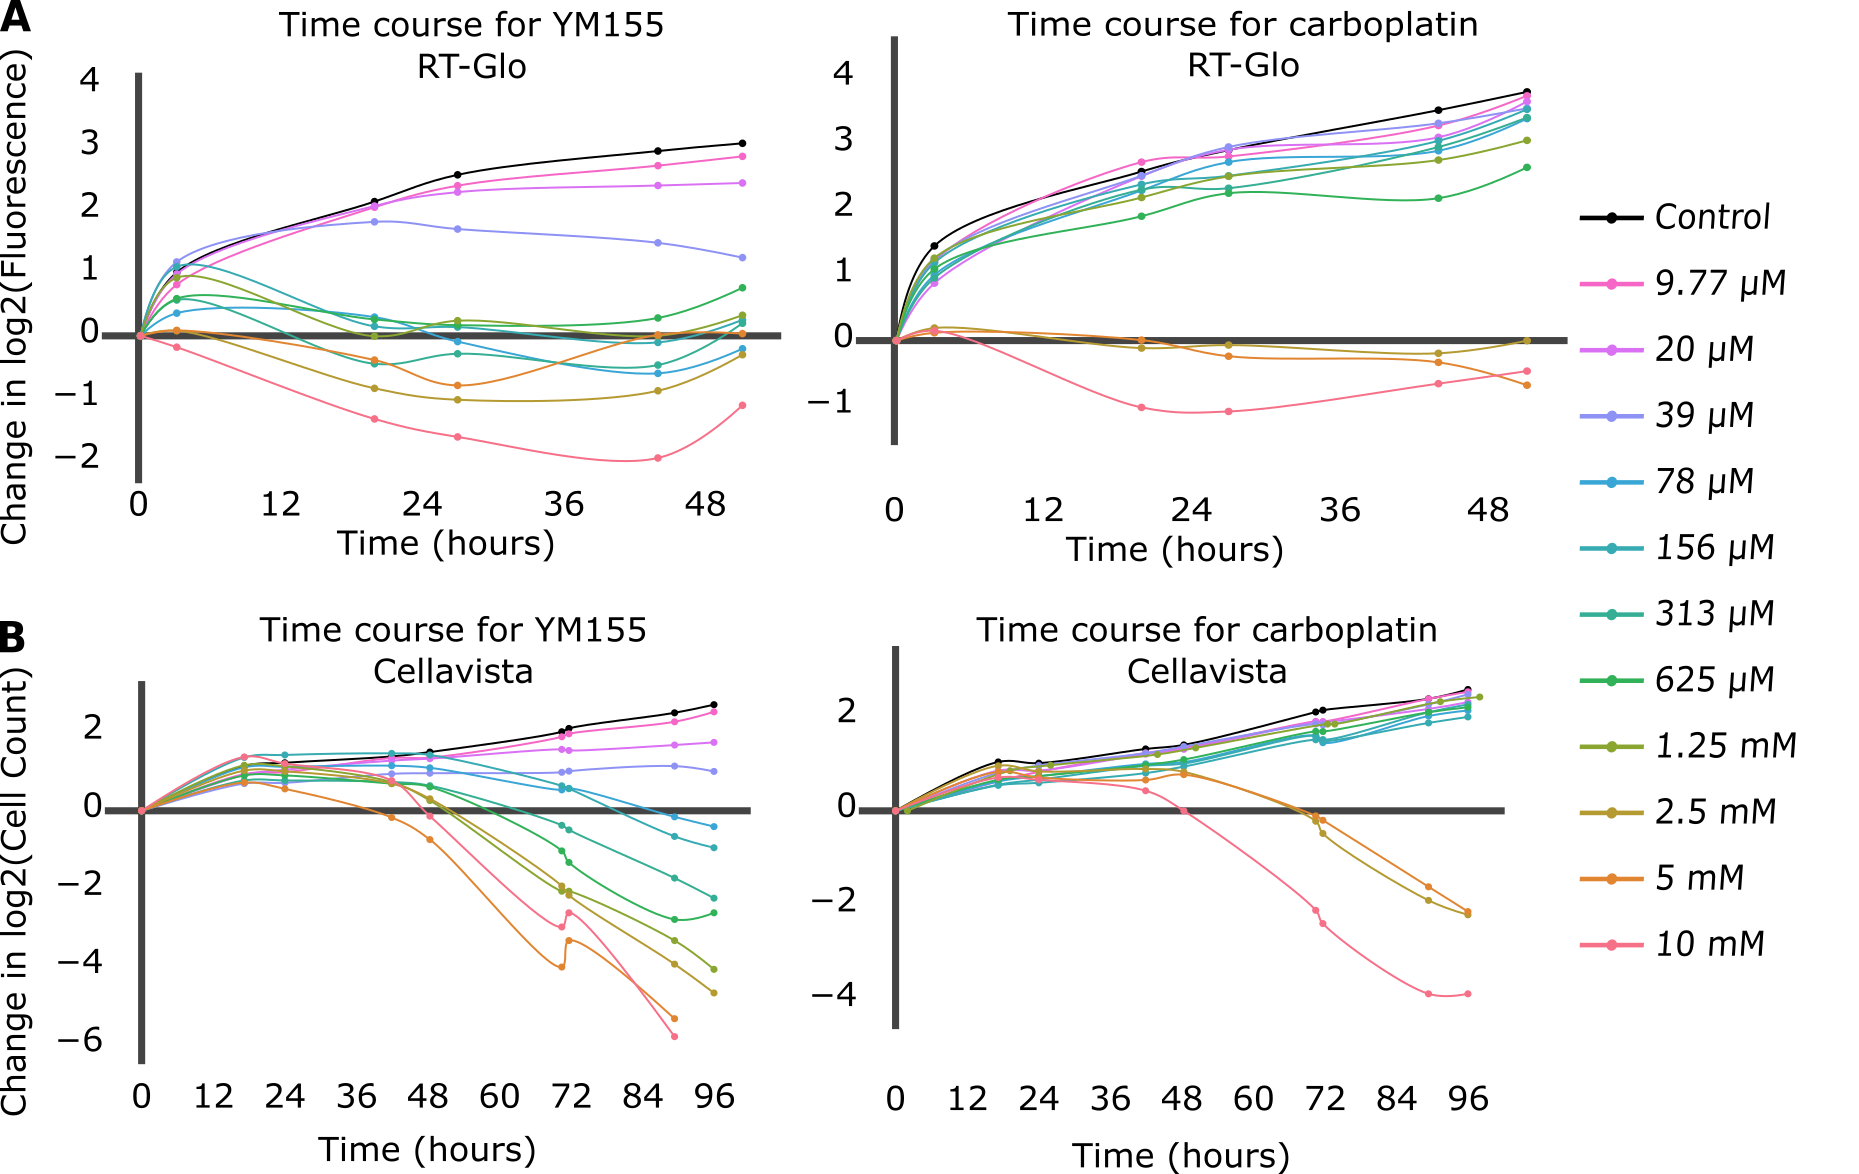
Figure 1. The top figures (A) are time course graphs for YM155 (left) and carboplatin (right) using RT-Glo, and the bottom figures (B) are time course graphs using the Cellavista. Both graphs show a dose-dependent response to the drugs, but the graphs for YM155 shows a negative growth rate for more drug concentrations than the graphs for carboplatin.
For the RT-Glo well plate, the time course graphs (Figure 1A) show that generally, for higher concentrations of drug, H1048 cell doubling had a low or negative DIP rate (slope of line) in response to both YM155 and carboplatin. However, a wider range of YM155 concentrations exhibited a negative DIP rate than carboplatin drug concentrations. Concentrations ranging from 10 µM to 78 nM (8 total) of YM155 resulted in a low or negative change in log2 cell count after ~60 hours, whereas only concentrations of 10 µM to 2.5 µM (3 total) of carboplatin had the same effect within the same time frame.
The Cellavista method (Figure 1B) demonstrated similar growth curves to the RT-Glo method (Figure 1A). A total of 8 drug concentrations of YM155, ranging from 10 μM to 78 nM, resulted in a negative change in log2 cell count at ~96 hours. In contrast, only 3 drug concentrations of carboplatin, ranging from 10 μM to 2.5 μM, achieved a similar effect in the same time frame. However, the magnitude of the DIP rate at the maximum tested concentrations is similar for carboplatin and YM155 in both assays. The efficacy (Emax) and potency (EC50) of YM155 and carboplatin were calculated by fitting the Hill equation
\[DIP\ Rate=E_{max}+\frac{\left(E_{min}-E_{max}\right)}{1+\left(\frac{d}{EC_{50}}\right)^h}\]
to the calculated DIP rates at different drug concentrations (d) (Figure 2). The Emax is the maximum effect achievable for a drug and the EC50 is the concentration of drug needed to achieve half of its maximum response (i.e. (Emin-Emax)/2). Visually, the point at which the lines on the graphs plateau at the bottom is the Emax, and the EC50 is represented by the center point of the dose-response curve (Figure S4). A drug with a negative Emax (negative growth rate) and low EC50 (low dose required) is optimal and is correspondingly considered a drug with high efficacy and high potency.
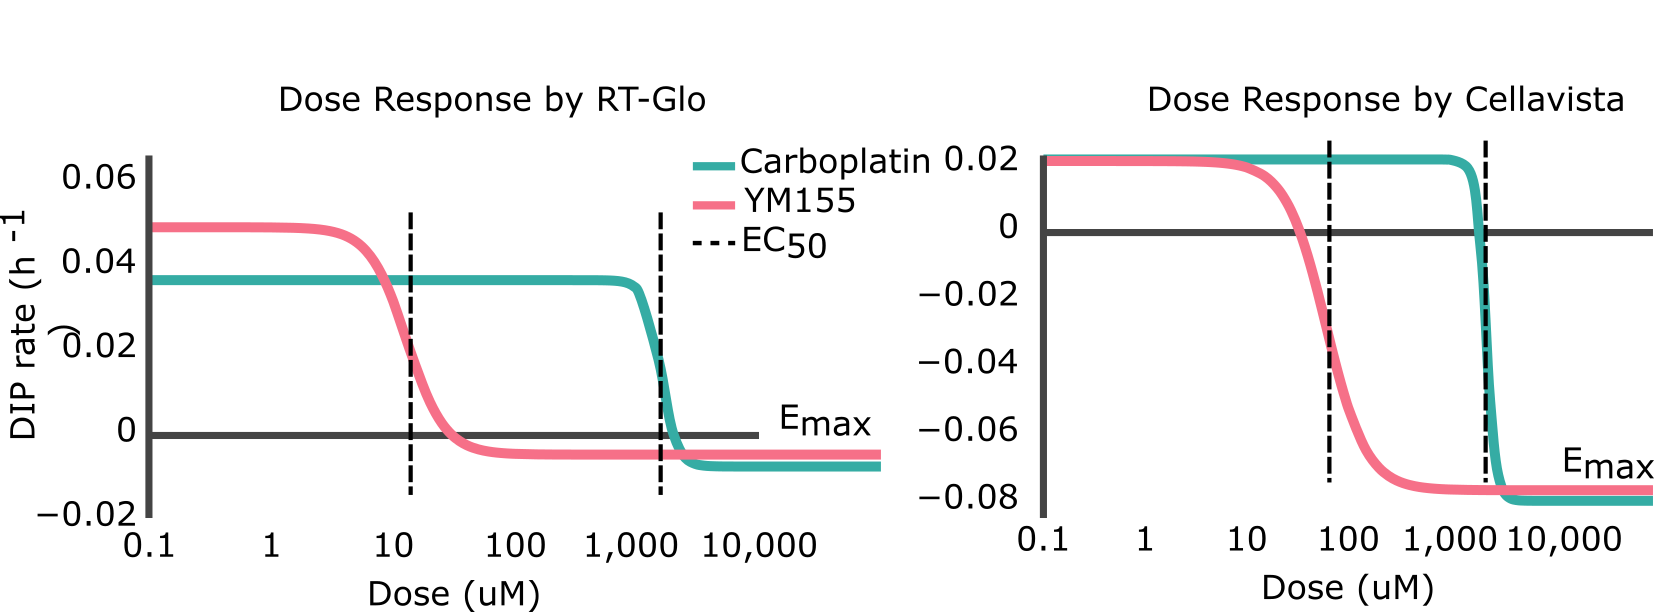
Figure 2. Side-by-side comparisons of the dose-response curves for YM155 and carboplatin using RT-Glo (left) and the Cellavista (right). See Figure S5 for fits overlaid on raw DIP rate measurements.
Table 1 shows that the Emax for YM155 using RT-Glo was -0.005 h-1 and -0.076 h-1 for carboplatin: a slight difference of 0.071 h-1. This can be observed visually, as the lines in Figure 2 level off at around the same value (See Figure S5 for visual inspection of the fit quality to raw DIP rates). The equal efficacies of the two drugs was confirmed in the Cellavista assay which found the Emax of YM155 was -0.007 h-1 and the Emax of carboplatin was -0.079 h-1: a difference of 0.072 h-1.
Table 1. Efficacy (Emax) and potency (EC50) measurements from the RT-Glo and Cellavista assays for YM155 and carboplatin.
| Emax [hr-1] | EC50 [uM] | |||
| Drug | RT-Glo | Cellavista | RT-Glo | Cellavista |
| YM155 | -0.005 | -0.007 | 12.97 | 60.51 |
| Carboplatin | -0.076 | -0.079 | 1156.8 | 2260.6 |
However, while the drugs had similar efficacy, they differed in potency. Using RT-Glo, the EC50 of YM155 was found to be 12.97 µM, while the EC50 of carboplatin was found to be 1156.8 µM: a difference of 1143.8 µM. In the Cellavista well plate, the EC50 of YM155 was found to be 60.51 µM, and the EC50 of carboplatin was 2260.6 µM: a difference of 2200.1 µM. This large difference in potency means that YM155 can be used at a lower dose to achieve the same maximal effect.
Therefore, YM155 was found to be more potent than carboplatin with similar maximal efficacy in both assays (Figure S6).
DISCUSSION.
Treatment methods for SCLC have not advanced since the 1980s, despite the high death rates and negative side effects associated with chemotherapy. In this study, the efficacies of a survivin inhibitor (YM155) and a traditional platinum-based chemotherapy drug (carboplatin) were tested using two assays for cell growth quantification. Time course data and different pharmacological parameters of the drug-induced proliferation rate (DIP rate) were measured and compared to determine the efficacy and potency of each drug. Both assays demonstrated that the Emax (efficacy) of both drugs were similar, while the lower EC50 (higher potency) of YM155 means a lower concentration of drug can produce the same effect as a higher dose of carboplatin.
The hypothesis that a survivin inhibitor is more efficacious for treating SCLC than a traditional chemotherapy drug is not supported by the results of this experiment. However, the results suggest that YM155 is more potent than carboplatin. The average EC50 between the assays was 36.74 µM and 1,708.7 µM for YM155 and carboplatin, respectively. This over a 45-fold reduction in the dosage requirements for the same effect. This means that YM155 could potentially reduce side effects commonly associated with chemotherapy via dose reduction.
Despite the substantial differences in the two assays, both gave similar quantifications of cell count in short timeframes. We found that reagent limitations reduced of the RT-Glo assay for longer assays. Indeed, the shortened timeline in Figure 1A as compared to Figure 1B is due to the reagents of the RT-Glo assay running out and no longer reacting with live cells. This produced a saturating luminescence signal after ~60 hours of measurements as shown in Figure 3; therefore, those portions of the graphs were removed to measure growth rate only for the points at which the fluorescence changes due to the presence of the drug. The Cellavista assay was used to account for the possible uncertainties of the RT-Glo assay; both methods concluded equal efficacy and increased potency of YM155 compared to carboplatin.

Figure 3. Full time-course graph for all untreated wells in the RT-Glo well plate. The change in log2 fluorescence is expected to increase as time goes by when the cells are not treated with a drug; however, at ~60 hours, the reagents in the RT-Glo assay runs out and no longer reacted with live cells to produce luminescence. As a result, the luminescence signal was saturated.
Future directions include optimizing the RT-Glo to measure drug effect for periods longer than ~60 hours. Additionally, similar experiments are required to test the combined effect of survivin inhibitors and traditional platinum-based chemotherapy drugs as well as further investigate these inhibitors in more cell line models. The latter is particularly critical given the recent evidence of different subtypes of SCLC which cooperate to form a tumor niche [19]. Finally, since YM155 is more potent than carboplatin in treating SCLC in vitro, there is merit to test if the reduced drug requirements translate to a reduction of side effects in vivo depending on the pharmacokinetics of drug uptake. Future studies will include more in vitro experiments to determine the proper dose concentration in mouse models of SCLC.
ACKNOWLEDGMENTS.
I would like to acknowledge the Aspirnaut™ program and the following people for their support while completing this project: Quaranta Lab, Drs. Billy and Julie Hudson, Aaron Fidler, Lin Chang, Rachel Baugh, and Tracy Schuffenhauer (Schuffenhauer Scholar).
SUPPORTING INFORMATION.
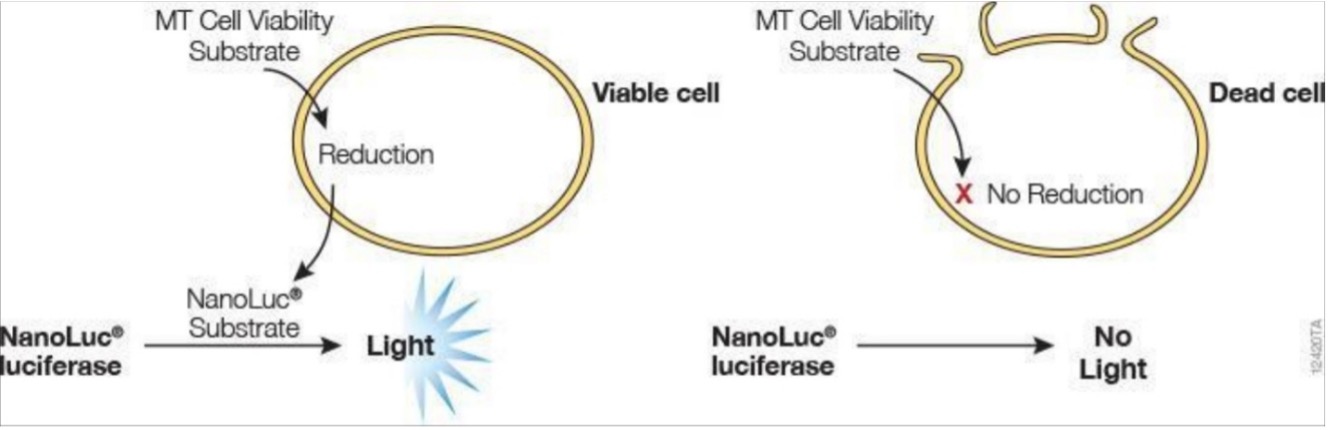
Figure S1. In viable cells, the MT Viability Substrate is reduced into the NanoLuc® Substrate, which reacts with the NanoLuc® Luciferase to produce light. This reaction does not occur in dead cells or non-metabolically active cells; therefore, the luminescence correlates with total metabolic activity in the well.
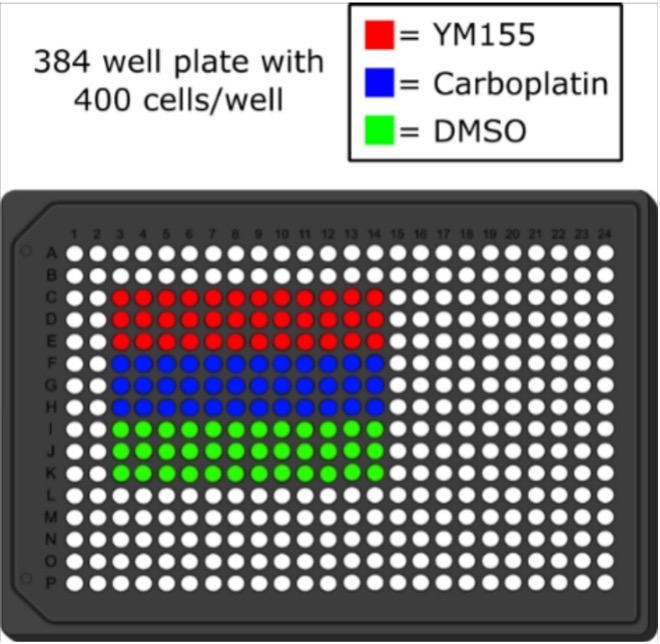
Figure S2. The 384 well plate map that was used in the experiment. The cells were treated with YM155, carboplatin, and DMSO (vehicle control) in triplicate, and the drugs were serially diluted by a factor of 0.5 starting at 10 µM. The last well in each row was left with no drug.
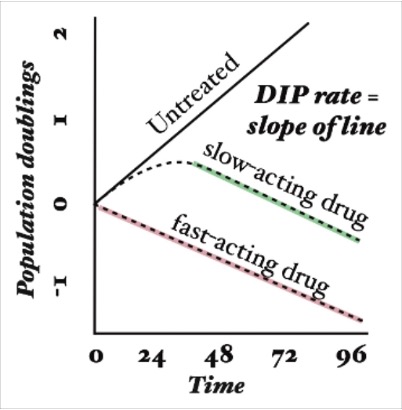
Figure S3. The drug-induced proliferation (DIP) rate is defined as the rate of population doublings over time after drug effect has equilibrated. A negative DIP rate corresponds to a regressing population while a positive rate indicates a growing population.
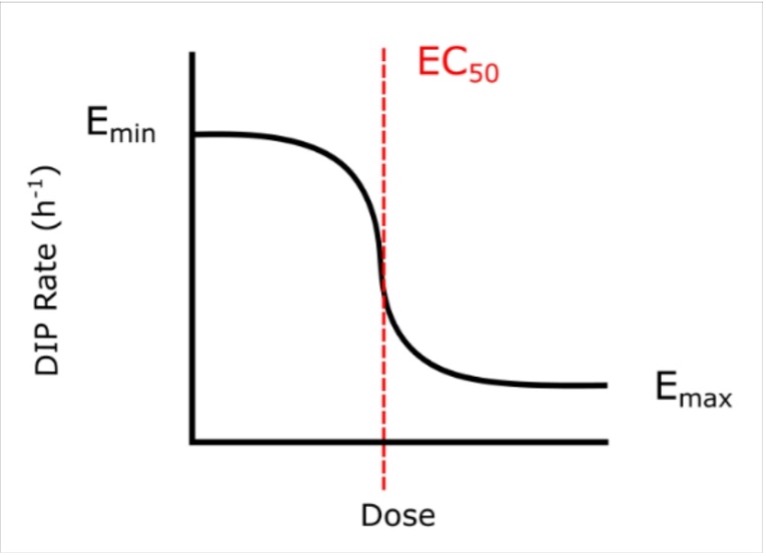
Figure S4. A dose-response curve. The Emax and EC50 of on the curve are annotated. Emax is a measure of drug efficacy and EC50 is a measure of a drug potency. These are the metrics by which YM155 and carboplatin will be compared.
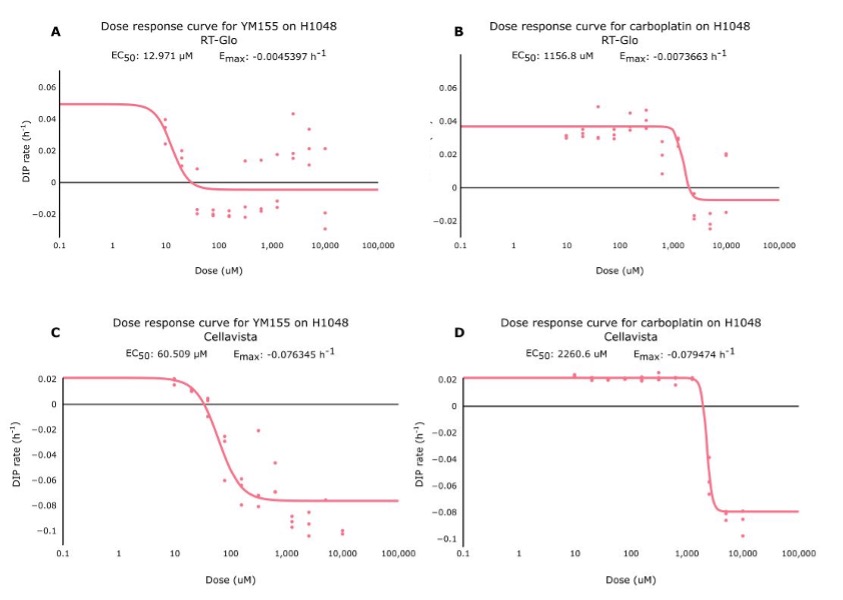
Figure S5. These are dose-response curves for YM155 (A,C) and carboplatin (B,D) using RT-Glo (A,B) and Cellavista (C,D). Each dot represents an individual well on the well plate, and the line represents the line of best fit for those dots. The graphs show that while the Emax of both drugs are similar, the EC50 of YM155 is lower than the value for carboplatin.
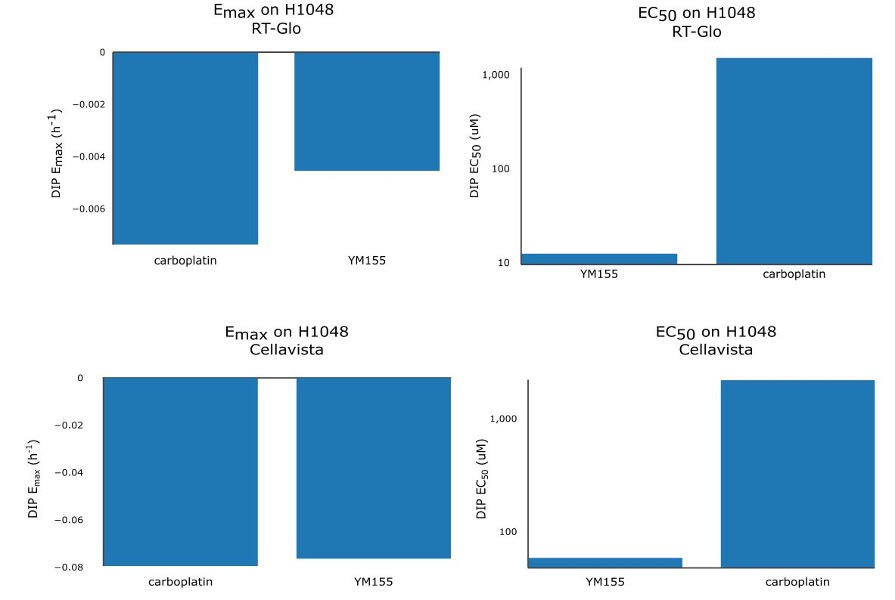
Figure S6. Bar chart of Emax (left) and EC50 (right) values of YM155 and carboplatin for RT-Glo (top) and Cellavista (bottom).
REFERENCES.
1) A. Gazdar, P. Bunn, J. Minna, Small-cell lung cancer: what we know, what we need to know and the path forward. Nat Rev Cancer. 17, 725–737 (2017).
2) D. M. Jackman, B. E. Johnson, Small-cell lung cancer. Lancet. 366, 1385-1396 (2005).
3) R. L. Siegel, K. D. Miller, A. Jemal, Cancer statistics, 2020. CA: A Cancer Journal for Clinicians, 70, 7-30 (2020).
4) T. W. Wang, L. J. Neff, E. Park-Lee, C. Ren, K. A. Cullen, et al., E-cigarette use among middle and high school students – United States, 2020. Morbidity and Mortality Weekly Report. 69, 1310-1312 (2020).
5) K. J. Barnum, M. J. O’Connell, “Cell cycle regulation by checkpoints” in Cell Cycle Control (vol. 23 of Springer Methods in Molecular Biology, 2014), pp. 29-40.
6) M. Marxer, H. T. Ma, W. Y. Man, R. Y. C. Poon, p53 deficiency enhances mitotic arrest and slippage induced by pharmacological inhibition of Aurora kinases. Oncogene. 33, 3550-3560. (2014).
7) J. George, J. S. Lim, S. J. Jang, Y. Cun, L. Ozretić, Comprehensive genomic profiles of small cell lung cancer. Nature. 524, 47-53. (2015).
8) S. Dilruba, G. V. Kalayda, Platinum-based drugs: past, present and future. Cancer Chemotherapy and Pharmacology. 77, 1103-1124. (2016).
9) Center for Disease Control and Prevention (CDC), “How is lung cancer diagnosed and treated?” (2020). https://www.cdc.gov/cancer/lung/basic_info/diagnosis_treatment.htm
10) X. Chen, D. Iliopoulous, Q. Zhang, Q. Tang, M. B. Greenblatt, et al., XBP1 promotes triple-negative breast cancer by controlling the HIF1α pathway. Medical Oncology. 508, 103-107. (2014).
11) A. Mirza, M. McGuirk, T. N. Hockenberry, Q. Wu, H. Ashar, et al., Human survivin is negatively regulated by wild-type p53 and participates in p53-dependent apoptotic pathway. Oncogene 21, 2613-2622. (2002).
12) J. Chen, S. Jin, S. K. Tahir, H. Zhang, X. Liu, et al., Survivin enhances Aurora-B kinase activity and localizes Aurora-B in human cells. Journal of Biological Chemistry. 278, 468-490. (2003).
13) I. Tamm, Y. Wang, E. Sausville, D. A. Scudiero, N. Vigna, et al., IAP-family protein survivin inhibits caspase activity and apoptosis induced by Fas (CD95), Bax, caspases, and anticancer drugs. Cancer Research. 58, 5315-5320. (1998).
14) Y. Voges, M. Michaelis, F. Rothweiler, T. Schaller, C. Schneider, et al., Effects of YM155 on survivin levels and viability in neuroblastoma cells with acquired drug resistance. Cell Death and Disease 7, e2410 (2016).
15) Y. S. Na, S. J. Yang, S. M. Kim, K. A. Jung, J. H. Moon, et al., YM155 induces EGFR suppression in pancreatic cancer cells. PLoS ONE 7, e38625. (2012).
16) T. Nakahara, A. Kita, K. Yamanaka, M. Mori, N. Amino, et al., Broad spectrum and potent antitumor activities of YM155, a novel small-molecule survivin suppressant, in a wide variety of human cancer cell lines and xenograft models. Cancer Science. 102, 614-621. (2011).
17) “RealTime-Glo™ MT Cell Viability Assay. Technical Manual,” tech. rep. (Promega Cooperation, updated 2016).
18) L. A. Harris, P. L. Frick, S. P. Garbett, K. N. Hardeman, B. B. Paudel, et al., An unbiased metric of antiproliferative drug effect in vitro. Nature Methods. 13, 497–500. (2016).
19) C. M. Rudin, J. T. Poirier, L. A. Byers, C. Dive, A. Dowlati, et al., Molecular subtypes of small cell lung cancer: a synthesis of human and mouse model data. Nature Reviews Cancer. 19, 289-297. (2019).

Posted by John Lee on Thursday, May 20, 2021 in May 2021.
Tags: chemotherapy, Small Cell Lung Cancer, Survivin, YM155