Biological Sex and Socioeconomic Status Influences on Behavioral and Neural Markers of Speech Processing in Preschool Children in Brazil
ABSTRACT
Early language development in childhood may be affected by biological and environmental factors. This study aimed to characterize the contributions of biological sex and family socioeconomic status (SES) to the neural processing of speech as well as to communicative and cognitive abilities of normal-hearing children aged 4-7 years (N=39). Cortical auditory event-related potentials (CAEPs) were recorded during passive listening to naturally spoken consonant-vowel syllables. Standardized behavioral assessments evaluated verbal and nonverbal skills. Data analysis revealed no consistent effects of biological sex on behavioral or neural measures. Lower SES was associated with reduced receptive language skills as well as shorter P1 (100-250ms) latencies (p =.027) and larger N2 (250-400ms) amplitudes (p=.033) in response to speech stimuli. A review of brain-behavior correlations indicated that longer P1 latencies were observed in children with better performance on behavioral measures of language and communication abilities. Larger N2 amplitude differences for the /ga/ vs. /ba/ contrast were also related to higher behavioral scores. These findings suggest that environmental factors have a greater influence on behavioral and neural measures of language development during early childhood than biological sex. Future studies with larger samples will need to replicate these findings and examine possible long-term effects of biological sex and SES on neural responses to speech syllables.
INTRODUCTION.
Language is an ever-evolving essential element of communication in society. The auditory system is the first sensory system to develop in the fetus and continuously develops throughout adolescence [1]. Neural responses such as auditory brainstem responses and cortical auditory event-related potentials (CAEP) can be used to document auditory development and evaluate auditory functioning during language development in early childhood [2]. Both of these measures are accessible to research for understanding early signs of auditory processing and language deficits.
Cortical responses to speech are typically observed 100-400 ms after stimulus onset as an obligatory P1-N1-P2 complex. The P1-N1-P2 waveforms vary based on stimulus frequency, pitch, and intensity as they reflect sound detection and early stages of sound discrimination [2]. However, in young children, only a P1-N2 response is exhibited due to immaturity of the auditory system. Even without the N1-P2 response, the associated neural functions are represented by the N2 response [1]. Children experience different rates of maturation and exhibit varied CAEP properties because environmental factors, such as socioeconomic status, could influence brain development and auditory processing.
A variety of studies have noted a substantial discrepancy in language learning and performance between low and high socioeconomic status groups (SES). Many concluded that higher SES was associated with higher language ability, better selective attention, and phonological skills [3], [4]. When assessing the neural processing of speech sounds, one longitudinal study found that children with higher SES generate a larger P1 amplitude and a smaller P2-N2 response to speech than the low SES group suggesting a more effective speech processing in the brain [5].
Environmental factors could hinder early prenatal development. As low-income families experience more food scarcity, nutrient deficiency may occur during gestation leading to altered gene expression in the cortex due to the deficiency of folate and vitamin B12 [6], [7]. Additionally, a study examining the brain anatomy discovered that low SES children exhibited a larger amount of gray matter [8]. A recent study also proposed that higher SES children hear 30 million more words than lower SES children as they engage in more adult-child verbal interactions [9]. Such reasoning for the lack of exposure of at-home language experience may be due to extended television and media exposure limited at-home verbal interactions [10]. The lack of resources and social interactions could have detrimental effects on auditory development and language abilities.
Another source of potential variance in language abilities and neural processing of speech sounds is biological sex. There is an indication of female advantage in language-related courses over males [11], but studies have found inconsistent sex differences in behavioral testing [12]. One study found that males showed more left unilateral activation in Broca’s, which is responsible for speech production, and Wernicke’s, responsible for speech comprehension, areas while females showed bilateral activation while completing several behavioral tasks while being scanned by fMRI scans; different activation of language regions could contribute to varied behavioral performance [13]. However, a literature review that examined 165 articles, in all age groups, on sex differences in verbal abilities concluded that 66% of the articles yielded no difference between male and female cognitive abilities and noted a trend of female authors reporting a female advantage [12].
Previous studies on the biological sex difference in sound discrimination have also yielded inconclusive results. One study found that males generated a larger N1 and P2 amplitude than females to self-produce /u/ vowel sounds, also noting a sex-by-age effect where older males exhibited longer P2 latencies than older females [14]. Other studies also noted a gender-by-age interaction in sound discrimination learning as females showed an accelerated improvement in sound discrimination and language task accuracy between the ages of 7-10 but yielded no overall sex differences [15], [16].
This study aimed to examine the effects of SES and biological sex on CAEP responses to speech syllables and on behavioral testing performance in preschool children. We also tested the possibility of sex by SES interaction in language abilities and sound discrimination. We hypothesized that higher SES would be associated with greater neural speech sound differentiation and better performance on behavioral measures. We also predicted no differences related to biological sex on either measure.
METHOD.
Participants. Thirty-nine children (19 females, 20 males) between the ages of 4-7 years (M=5.66 SD=.91) from Maceio and Ribeirão Preto areas in Brazil were included in this study. Faculty from the University of Health Science of Alagoas administers this study’s procedures. They were part of a larger study examining the effects of prenatal exposure to the Zika virus on auditory measures (NIH R56DC019113). Table 1 shows the demographics of the participants. All children were confirmed to have normal hearing via multiple hearing measures and all behavioral testing was presented in Brazilian Portuguese. SES was determined by the Brazilian Economic Classification Criteria (BECC) form, which is calculated according to possessions, accessibility to water and roadways, and the householder’s level of education.
| Table 1. Means (M) and standard deviations (SD) of participants’ demographic characteristics and behavioral test scores. | ||||
| Males (n=20) | Females (n=19) | |||
| Mean | SD | Mean | SD | |
| Age, years | 5.40 | 0.71 | 5.90 | 1.04 |
| Socioeconomic score (BECC) | 27.71 | 6.41 | 29.20 | 9.19 |
| Vineland Adaptive
Behavioral Scale |
||||
| Adaptive Behavior
Composite |
103.69 | 55.25 | 95.79 | 15.30 |
| Communication
standard score |
85.31 | 15.19 | 90.43 | 20.33 |
| Receptive v-score | 13.75 | 6.02 | 13.71 | 4.20 |
| Expressive v-score | 15.63 | 5.73 | 14.43 | 3.65 |
| Socialization standard score | 99.69 | 15.10 | 103.71 | 10.36 |
| Interpersonal
Relationships v-score |
16.44 | 5.90 | 17.00 | 2.91 |
| Columbia Mental Maturity Scale | 98.33 | 19.12 | 101.09 | 17.67 |
| Wechsler Nonverbal Scale of Ability | 95.23 | 9.94 | 100.73 | 15.48 |
| Expressive Vocabulary (LAVE) | 285.10 | 28.53 | 291.87 | 20.30 |
| Picture naming task (PNT) | 118.85 | 24.84 | 110.43 | 16.35 |
| Peabody Picture Vocabulary Test (PPVT) | 41.45 | 12.57 | 44.67 | 16.53 |
| Phonological Productivity (ABFW) | 87.09 | 16.02 | 94.19 | 7.40 |
Procedure. Written informed consent was collected from the parents before any testing and auditory examinations were performed. Any previous history of head trauma as well as any neurological diagnoses in children or their immediate family were exclusionary criteria.
Cortical auditory evoked potentials were obtained by a standard 4-electrode BioLogic Auditory Evoked Potentials system, version 7.2.1, at a sampling rate of 512Hz. Electrodes were placed at Cz, A1 (left mastoid), A2 (right mastoid), and forehead. Impedances <5 kOhm with a difference of <2 kOhm were ensured before and after CAEP recording [17]. Data were filtered by a 0.1-30Hz bypass filter to ensure the quality of data [18].
Three consonant-vowel syllables were presented in pairs /ba/ – /ga/ and /da/ – /ga/ at 70 dB SPL with ER-3 insert earphones. These syllables are common in multiple languages, including Brazilian Portuguese, and require little to no comprehension. The syllables were naturally spoken by a female native speaker in Brazilian Portuguese. The stimulus duration was 290 – 305 ms. Stimulus order was randomized with 75 trials for every syllable at the rate of 0.7 per second. Participants were retested if they had fewer than 65 artifact-free trials. Participants were instructed to stay awake and sit quietly while watching a silent movie.
Behavioral Testing. Language and cognitive assessments were conducted to directly measure language and communication development. Table 1 shows a summary of behavioral test scores.
The Peabody Picture Vocabulary Test (PPVT) [19] was a receptive language measure in which participants were presented 125 items, 4 pictures at a time, and was asked to point to the picture that corresponded to the word spoken by the experimenter. The raw score was used to evaluate performance.
The Picture Naming Test (PNT) [20] evaluated the expressive vocabulary and memory ability of the participant. The child was asked to verbally identify 60 items that were presented. The resulting scores of the picture naming task were scored based on the child’s age (M=100, SD=15).
List of Evaluation of the Expressive Vocabulary (LAVE) [21] was a parent-filled questionnaire in which parents were asked to identify out of 307 words what words their children could produce. Raw scores were converted into standard scores according to the participant’s age (M=100, SD=15).
The Child Language Test (ABFW) [22] accessed phonetic inventory and phonological aspects for expressive language. The test consisted of two parts. In the first task, participants were shown 34 pictures (in- cluding 90 consonants), and in the second task, the participant was shown 39 words (107 consonants) of objects and asked the name them. The child was allowed one redemption attempt and the percentage of correct consonants produced was scored and compared to age norms.
Cognitive assessments were conducted to measure nonverbal abilities using the Columbia Mental Maturity Scale [23] and the Wechsler Nonverbal Scale of Ability task (WNS) [24]. The Columbia assessment presented 92 items, 3-5 at a time, in 8 overlapping sets to indicate if the objects were related. Scores were converted to maturity index scores. The WNS tested the nonverbal reasoning ability by matching matrices, code symbols, assessing spatial span, assembling objects, and properly arranging pictures in order tasks. Nonverbal instructions were given throughout testing and scores were converted to their corresponding age (M=100, SD=15).
In addition, a parent interview using Vineland Adaptive Behavior Scales-3 [25] assessed expressive and receptive language, communication, socialization, and interpersonal relationship skills exhibited in daily life. The assessment provided standard scores for each evaluated domain (M=100, SD=15) and v-scores for the subdomains (e.g., receptive communication) with M=15, SD=3.
RESULTS.
In studying the influences of biologicalic and SES factors on neural markers in cortical auditory event-related potential, we hypothesis that the higher SES group has an advantage over the lower SES group.
There were no significant biological sex differences in behavioral test scores and SES differences were limited to PPTV test scores, where children with higher SES scored better than the low SES children (p=.019). Maximum peak amplitude and latency between 100-250ms for P1 and between 250-400ms for N2 were determined using an automated scoring procedure in Excel. A repeated-measure ANOVA was used to detect any Stimulus x Sex x SES relationships for sound discrimination. Additionally, correlations examined potential associations between CAEPs and behavioral test scores.
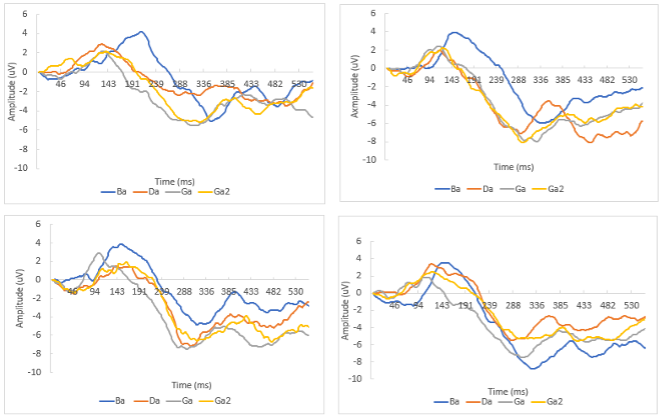
Figure 1. Grand-average cortical auditory event-related potentials (CAEP) waveforms in response to ba, ga, da syllable pairs between Biological sex x SES subgroups. (A) CAEP of Boys with high SES (B) CAEP of Boys with low SES (C) CAEP of Girls with high SES (D) CAEP of Girls with low SES
CAEP Responses. There were no effects of sex on P1 amplitude, latency, and N2 amplitude. However, a Stimulus x Sex interaction was significant for the N2 latency (F (3,81) =2.906, p=.04). Females produced faster responses to syllable /ba/ than males (330 ms vs. 351 ms; p=.036). Conversely, male participants produced faster N2 responses to /ga/ than females (312 ms v s. 345 ms, p=.021).
The analysis showed the main effects of SES on P1 latency and N2 amplitude. The low SES group exhibited faster P1 latencies (F (1,27) =5.488, p=.027) and a larger N2 response (F(1,27)=5.049, p=.033) than the higher SES group. No significant sex x SES interactions were found.
Sound Discrimination. Evidence of speech sound discrimination was observed as all participants exhibited a longer P1 latency for /ba/ vs. /ga/ and /da/. Within the male subgroup, the N2 responses were slower to /ba/ than /ga/ and /da/ (p=.008 and p=.032). No significant N2 latency differences were observed among the stimuli for females. In addition, males with low SES demonstrated more positive P1 and N2 peak amplitudes for /ba/ vs. /ga/ (p= .017 and p=.046). Females with low SES showed longer N2 latencies for /ba/ vs. /ga/ (p=.008).
Correlations with behavioral measures. The correlational analysis found that longer P1 latencies and larger N2 amplitudes were associated with higher performance on behavioral measures (PPVT r=.37-.53, p<.05; Vineland Communication: r=.54-.66, p<.05). No signifi- cant associations were found between P1 amplitudes or N2 latencies to behavioral test performance.
DISCUSSION.
This study examined the influences of biological sex and SES on neural markers of consonant-vowel syllable processing and on the communicative and cognitive abilities of preschool children in Brazil. The results suggest that SES was more impactful than biological sex for speech sound processing. At the behavioral level, SES-related differences were limited to the PPTV, a receptive language measure. However, at the neural level, low SES children showed faster P1 and larger N2 responses. Previous research has concluded that increased N2 amplitudes reflected less effective neural processing and were associated with lower performance on receptive and expressive language measures [26]. In this study, longer P1 latencies and larger /ba/ vs. /ga/ N2 amplitudes were associated with better PPVT and Vineland scores. Prior studies have found that being near the poverty line as opposed to significantly below the poverty line was related to higher volumes of gray matter in children [10]. This could suggest lower myelination that hinders the neural response speed, which potentially leads to lower behavioral scores. The current study did not examine differences in the levels of poverty.
As for the results for biological sex, no relation with behavioral performance was observed. These findings counter the claims of previous studies that have found sex variance in brain activation and behavioral performance [13]. Biological sex influence on neural responses did not demonstrate consistent advantages for one sex over the other. Additionally, there were no sex-by-SES group interactions in neural markers.
This study supports some of the prior findings and contradicts others on the influences of biological sex and SES. However, this sample included 7-10 subjects for each sex by SES subgroup, which could limit our ability to detect statistically significant group differences. Future studies should incorporate a larger population to replicate and validate these findings. Additionally, several participants were missing behavioral data at the time of analysis as the original study is still ongoing. Future work could also incorporate older age groups as evidence from previous studies suggests that sex and SES differences may become more apparent later in development [27].
Another consideration for future studies could extend the sample to other populations that are at known risk for neurodevelopmental disabilities such as children with prenatal exposures to viruses, for instance, COVID, Zika virus, etc. Other possible groups could also include children with autism or learning disabilities that may extend to adulthood [28-30].
CONCLUSION.
In closing, the study’s results suggest that in preschool children, SES has a greater effect on the neural processing of speech sounds than biological sex factors. The results indicate higher SES group’s neural processing is more efficient than in low SES. These results add to the existing literature by demonstrating a high SES advantage in the neural processing of consonant-vowel syllables, even though a high SES advantage in behavioral measures was limited toreceptive language abilities. Our findings on biological sex differences have shown no influence on neural processing or language and cognitive abilities. These observations extend our understanding of early language development and the major influencing factors that should be considered when identifying early language deficits.
ACKNOWLEDGMENTS.
This research was supported in part by the NIDCD grant R56DC019113 (Hood & Key) and the EKS NICHD grant P50 DH103537 (Vanderbilt Kennedy Center) but does not represent the official views of funding agencies. Thank you to the School for Science and Math, Dr. Deweese, the Human Psychophysiology Lab (Dr. Key), and the Auditory Physiology Lab (Dr. Hood, Dr. Powell).
REFERENCES.
- C. W. Ponton, M. Don, J. J. Eggermont, M. D. Waring, A. Masuda, Maturation of Human Cortical Auditory Function: Differences Between Normal-Hearing Children and Children with Cochlear Implants. Ear & Hearing. 17, 430-437 (1996).
- K. Tremblay C. Clinard, “Cortical Auditory-Evoked Potentials.” in Handbook of Clinical Audiology, ed. 7, pp. 337-355. (2015)
- A. D’Angiulli, A. Herdman, D. Stapells, C. Hertzman, Children’s Event-Related Potentials of Auditory Selective Attention Vary With Their Socioeconomic Status.Neuropsychology. 22, 3, 293–300 (2008).
- K. G. Noble, M. E. Wolmetz, L. G. Ochs, M. J. Farah, B. D. Mccandliss, Brain-behavior relationships in reading acquisition are modulated by socioeconomic factors. 9, 642-654. (2006).
- D. L. Molfese, V. J. Molfese, A. F. Key, S. D. Kelly, Influence of Environment on Speech-Sound Discrimination: Findings From a Longitudinal Study. 24, 541-558. (2003).
- F. C. Pampel, P. M. Krueger, J. T. Denney, Socioeconomic disparities in health behaviors,” Annu Rev Sociol. 36, 349–370 (2010).
- M. M. Black, Effects of vitamin B 12 and folate deficiency on brain development in children. Food and Nutri. Bulletin. 29, 2, 126-131 (2008).
- N. L. Hair, J. L. Hanson, B. L. Wolfe, S. D. Pollak, Association of child poverty, brain development, and academic achievement. JAMA Pediatr. 169, 9, 822–829 (2015).
- R. R. Romeo et al., Beyond the 30-Million-Word Gap: Children’s Conversational Exposure Is Associated With Language-Related Brain Function. Psychol Sci. 29, 5, 700–710 (2018).
- M. Alan et al., Infant Television and Video Exposure Associated With Limited Parent-Child Verbal Interactions in Low Socioeconomic Status Households. Arch Pediatr Adolesc Med. 162, 5, 411-417 (2008).
- 11. D. Voyer D. Voyer Susan D., Gender differences in scholastic achievement: A meta-analysis. Psychol Bull. 140, 4, 1174–1204 (2014).
- J. S. Hyde M. C. Linn, Gender Differences in Verbal Ability: A Meta-Analysis. Psychol. Bulletin. 104, 53-69 (1988).
- D. D. Burman, T. Bitan, J. R. Booth, Sex differences in neural processing of language among children. Neuropsychologia. 46, 5, 149–1362 (2008).
- P. Liu et al., Developmental sex-specific change in auditory-vocal integration: ERP evidence in children. Clinical Neuro. 124, 3, 503–513 (2013).
- H. WINITZ B. BELLEROSE, Effects of pretraining on sound discrimination learning. J Speech Hear Res. 6, 171–180 (1963).
- P. Nanova, L. Lyamova, M. Hadjigeorgieva, V. Kolev, J. Yordanova, Gender-specific development of auditory information processing in children: An ERP study. Clinical Neuropsychol. 119, 9, 1992–2003, (2008).
- E. S. Kappenman S. J. Luck, The effects of electrode impedance on data quality and statistical significance in ERP recordings. Psycho. 47, 5, 888-904 (2010).
- D. Tanner, K. Morgan-Short, S. J. Luck, How inappropriate high-pass filters can produce artifactual effects and incorrect conclusions in ERP studies of language and cognition. Psycho. 52, 8, 997–1009 (2015).
- L. M. Dunn L. M. Dunn, Peabody Picture Vocabulary Test. (1965).
- W. R. Glaser, Picture naming. Cognition, 42, 1–3, 61–105 (1992).
- K. T. Williams, Expressive vocabulary test second edition (EVTTM 2),” Am. Acad. Child Adolesc. Psychiatry. 42, 864–872 (1997).
- H. F. Wertzner, D. T. Francisco, T. F. Barrozo, L. O. Pagan-Neves, “Evidence for Speech Sound Disorder (SSD) Assessment,” in Advances in Speech-language Pathology (InTech,London). 276-298. (2017).
- E. E. Davis, Columbia Mental Maturity Scale. TPGA Journal, 2, 2, 147–149 (1973).
- D. Wechler J. A. Naglieri, Wechsler Nonverbal Scale Ability. (2006).
- S. S. Sparrow S. J. Luck, The Vineland Adaptive Behavior Scales 3rd edition. (2016).
- V. Harwood, J. Preston, A. Baron, D. Kleinman, N. Landi, Event-Related Potentials to Speech Relate to Speech Sound Production and Language in Young Children. Dev Neuropsychol. 47, 2, 105–123 (2022).
- T. D. Parsons, A. R. Rizzo, C. van der Zaag, J. S. McGee, J. G. Buckwalter, Gender differences and cognition among older adults. Aging, Neuropsychology, and Cognition. 12, 1, 78–88 (2005).
- S. A. Vogel, Gender Differences in Intelligence, Language, Visual-Motor Abilities, and Academic Achievement in Students with Learning Disabilities: A Review of the Literature. Journ. of Learning Disabilities. 21, 1, 44-52 (1990).
- J. M. Goldstein et al., Are There Sex Differences in Neuropsychological Functions Among Patients With Schizophrenia?. Am J Phychiatry. 155, 10, 1358-1364 (1998).
- W. Mandy, R. Chilvers, U. Chowdhury, G. Salter, A. Seigal, D. Skuse, Sex differences in autism spectrum disorder: Evidence from a large sample of children and adolescents, J Autism Dev Disord, 42, 7, 1304–1313 (2012).

Posted by John Lee on Tuesday, May 30, 2023 in May 2023.
Tags: Biological Sex, Cortical Auditory Event-Related Potential (CAEP), P1-N1-P2 complex, Socioeconomic Status (SES)