A Greasy Player in Alzheimer’s Disease
ABSTRACT
Alzheimer’s disease (AD) is the most common and deadliest type of dementia among the elderly. As its cause remains elusive, prevention or even an effective treatment is beyond reach. The most popular hypothesis of AD pathogenesis is Amyloid deposition, in which aggregation of β-amyloid peptides (Aβ) causes neurodegeneration. However, therapeutic treatments based on this hypothesis have failed to pass clinical trials. Moreover, many recent studies began to question the amyloid hypothesis. In the effort of understanding Aβ’s role in AD, we used a strain of transgenic mice that lacks Amyloid Precursor Protein (APP) and thus no Aβ. By analyzing RNA-sequencing data, we found a significant decrease of SREBP2, the master cholesterol (Chol) regulator in brain, only in aging APP-null mice. Using Filipin staining, we found a significant increase of total membrane Chol in APP-null neurons, inversely related to the SREBP2 decrease. Using immunostaining, we found an association between SREBP2 decreases and AD-like pathologies including Tau hyperphosphorylation and gliosis in the brains of aging APP-null mice. Given that APP interacts and modulates Chol, we conclude that Chol may be a more immediate contributor to AD pathogenesis than Aβ. We propose that Chol homeostasis could be a potential therapeutic target to prevent or treat AD and other neurodegenerative disorders.
INTRODUCTION.
Alzheimer’s disease (AD) is the most common form of dementia in the elderly (1). Since the first report published by Dr. Alios Alzheimer’s in 1906 (2) , neurofibrillary tangles and amyloid plaques, two AD pathological hallmarks, have been the focus of investigation. Their proteinaceous contents, phosphorylated Tau (pTau) and β-amyloid peptides (Aβs) respectively, were identified and so were their metabolic pathways (3). pTau is believed to exacerbate but not trigger AD whereas Aβ is postulated to be the cause, i.e., the amyloid hypothesis. In support of this hypothesis, many point mutations of amyloid precursor protein (APP) or γ-secretase (γS, the protease carving Aβ out of APP) found in familial AD (fAD) (4). Recent reports about the adversary impacts of soluble Aβ polymers or aggregates on synapses and neurons also reinforce the amyloid hypothesis (3, 4). However, almost all treatments that prevent or reduce Aβs have failed clinic trials (3).
More than 95% AD is sporadic (sAD) and occurs after the age of 65. Over the years, a list of gene variances has been found as risk factors repeatedly by genome-wide association studies (GWAS) in tens of thousands of AD patients (5). But none of the APP, γS, or genes directly associated with Aβ production or clearance are in that list. Instead, those genetic risk factors fall into three categories: cholesterol (Chol) metabolism, membrane trafficking, and immune response (5). While the last likely aggravates rather than initiates AD, the first two have been studied with the assumption that they indirectly contribute to Aβproduction or clearance (5). For example, ApoE4, the greatest genetic risk factor identified in all GWAS, has been studied mostly for its influence on Aβdeposition or clearance (6). However, the failure of Aβ-reduction treatments indicates that those risk factors may be involved in AD pathogenesis independent from Aβ.
While studying synaptic vesicle (SV) recycling at axon terminals, DelBove et al made an unexpected discovery: APP and γS modulates membrane Chol (mChol) in the presynaptic plasma membrane (7). Moreover, APP affects mChol via a direct interaction with its Chol-interacting motif (CIM) (8). They introduced fAD point mutations either affecting Chol-binding APP’s distribution. Instead of significant change in Aβ production, they found a significant anti-correlation between mChol and APP in the plasma membrane. Moreover, they found that those mutations made axons more vulnerable to prolonged stimulation or moderate mChol decrease (7). Their study implies that Chol dysregulation mediates the pathological impact of fAD mutations.
The human brain possesses ~25% of total body Chol, which is separated from the rest of the body by the blood-brain barrier (BBB) and thus regulated autonomously (9). Chol is vital for neurite growth, synaptogenesis, and many membrane proteins like ion channels and receptors (10). Intriguingly, Chol makes up 40% of SV lipids, and is required for SV origination, recycling, and functions of many SV proteins like Synaptotagmin I and VAMP2 (11). Notably, aging, the primary risk factor for all AD, causes a progressive decrease in brain Chol levels (10). Notably, FDA recently listed dementia as a side effect of BBB-permeable statins, which reduce brain Chol (12). Since axon terminals are far away from soma, APP can serve as local regulator for presynaptic Chol and its importance increases as the brain ages. So, is it possible that mChol is the converging point of different AD risk factors like aging and ApoE4, i.e., a Chol hypothesis?
The difference between the Chol hypothesis and the Aβ hypothesis can be tested using APP-null mice created more than 30 years ago. No AD pathology would be detected if Aβ hypothesis is true, while the Chol hypothesis argues the opposite. Using RNA-seq, Chol staining (Filipin), and immunostaining, we observed decrease in brain Chol regulator (SREBP2) in aging APP-null mice, increase in mChol in APP-null neurons, and appearance of AD-related molecular and cellular pathologies, which support the Chol hypothesis.
MATERIALS AND METHODS.
All chemicals used in this study were purchased from Sigma-Aldrich unless specified. All empirical tests using mice were done at Florida Atlantic University (FAU) and approved by FAU IACUC committee.
Mouse brain collecting and RNA-sequencing. Wildtype and age-matched transgenic mice were anesthetized, euthanized and decapitated. Four brain regions (i.e., prefrontal cortex, hippocampus, midbrain, and cerebellum) were isolated, immediately frozen in dry ice-methanal bath, and stored in -80°C freezer. Total RNA was isolated, validated, reverse-transcripted, and sequenced by GENEWIZ. All RNA-seq reads were validated and BLAST-searched. Gene ID assignment, read counts, sequence alignments, and primary comparison were performed. All in-house bioinformatic analyses were done in R-studio with DESeq2 package.
Cell culture. Mouse hippocampal cultures were all done at FAU following FAU-IACUC-approved protocol. Briefly, hippocampi were dissected from postnatal day 0-2 mouse pups as mentioned above, followed by slicing and washing. Tissues were digested by 0.1% Typsin/EDTA and dissociated by fire-polished Pasteur pipettes. Dissociated cells were collected by centrifuging (400×g, 5 minutes at 4°C) and seeded on MartiGel-coated glass coverslips. Cultured cells were fed once a week and used between 11-21 days in vitro (DIV).
Filipin staining. Cells were first incubated with a fixable styryl dye, AM1-43, that inserts into lipid bilayer and thus labels cell surface or all cell membranes for 2 minutes or 30 minutes, respectively. Samples were then washed with PBS and fixed by 4% paraformaldehyde (PFA) for 30 minutes at room temperature. PFA were neutralized by 1.5 mg/mL glycine and cells were washed again. For plasma membrane Chol, cells were incubated with Filipin solution at 4°C for 30 minutes. For labeling total Chol in all cell membranes, fixed cells were incubated with Filipin solution at room temperature for 2 hours. Stained cells were washed before mounted on glass slides. Fluorescence imaging were taken on Nikon Ti-E using Micro-Manager program. Both Filipin fluorescence (blue, excitation 405nm and emission 460nm) and AM1-43 fluorescence (green, excitation 480nm and emission 520nm) images for the same fields of view were acquired.
Perfusion and immunofluorescence labeling. Wildtype and age-matched transgenic mice anesthetized by isoflurane were fixed on a surgical plane and surgically exposed visceral organs. Heparinized perfusant (4% PFA) was administrated via 25g needle inserted into the left ventricular chamber. At the completion of the PFA perfusion, the brain was immediately dissected out and placed in 4% PFA and incubated at 4°C for 10-16 hours. The fixed brains were coronally sliced using a Leica SM2020R microtome at 40 mm thickness. Immunofluorescence staining was carried out with blocking solution, primary-antibody mix, and secondary-antibody mix sequentially (Table S1). Stained slices were mounted on glass slides and imaged using the same Nikon Ti-E microscope described before.
Image analyses and statistics. All images were processed in ImageJ. Regions of interests (ROIs) were automatically identified based on fluorescence thresholds (10% above background noise or three times above standard deviation of noise. Average pixel intensity for every ROIs were extracted and analyzed using Excel, Prism, or SigmaPlot. For each group/treatment, at least three samples per batch and three different batches of cell cultures or mice were included. In every image stack, 50 randomly selected ROIs were used for statistical analyses. For comparison, we used Student t-test or Kolmogorov-Smirnov test, depending on sample distribution and size.
RESULTS.
We collected three males and three females from four age groups (i.e., 6, 12, 18 and 24 months old) of APP-null (KO) mice and wild-type (WT) controls. This generates a total of 48 brains. For every brain, we dissected out hippocampi, prefrontal cortices, midbrains and cerebella, resulting in 192 samples. Although all samples yield sufficient RNA for RNA-seq, one (hippocampus of a 24-month-old KO male) had significantly lower RNA abundance (Table S2), which was removed from all subsequent analyses.
We firstly performed a series of quality control analysis to confirm the sampling consistency and the quality of sequencing across different specimens. Particularly, all samples yielded more than 10 million RNA-seq reads, sufficient for bioinformatical analyses. Phred quality scores for all samples are higher than 35 (Figure S1A), suggesting high sequencing accuracies at the reading length (between 99.9% and 99.99%, Table S3). GC distribution over all sequences shown as “Per sequence GC content” plot (Figure S1B) matches that of mouse transcriptome. Count dispersion was highly correlated with mean of normalized counts (Figure S1C), arguing against sequencing bias. Last but not the least, the knockout of APP was confirmed by the volcano plot which showed that APP (blue dot) is the most significantly reduced gene in KO groups compared to WT (Figure S1D).
Most AD cases occur after 65 years of age, approximately 24 months of age for mice. Hippocampus and prefrontal cortex are more susceptible to AD than midbrain and cerebellum (1). So, we compared RNA-seq results of hippocampi from 6 WT and 5 KO 24-month-old mice. With adjusted p < 0.05, we identified 31 significantly altered gene transcripts (Table S4) between KO and WT using DESeq2 pipeline (Figure 1A).
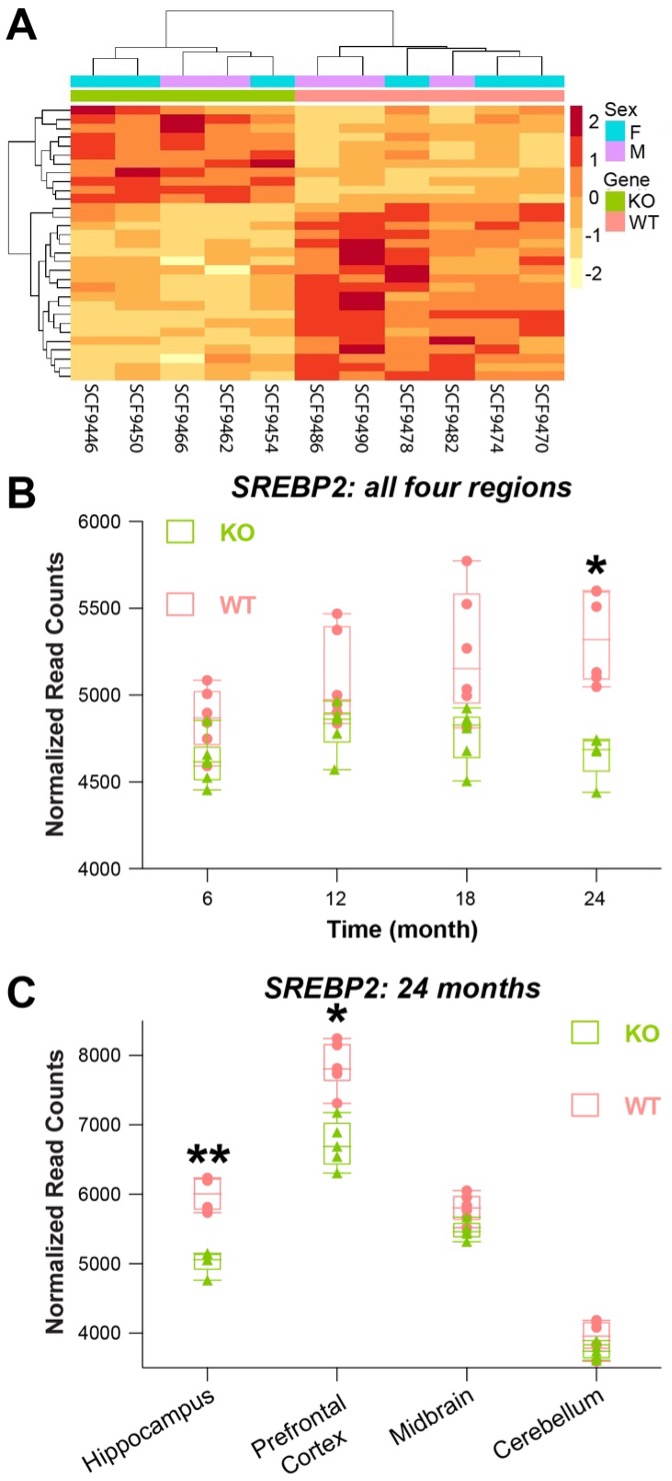
Figure 1. RNA-seq shows a significant change in SREBP2 expression in the aging brains of APP-null mice. A, heat-map of 31 genes with significant expression difference in the brains of KO and WT mice at 24-month-old. B, pooled data (normalized read counts) from all four brain regions show that the difference occurs in an aging-dependent manner and only becomes significant at 24 months. C, at 24 months, the difference of SREBP2 expression (measured as normalized read counts) is significantly different in hippocampus and prefrontal cortex but not midbrain and cerebellum. Student t-test. *: p < 0.05; **: p < 0.01.
Within the 31 altered genes, SREBP2 (Sterol regulatory element-binding protein 2) draws particular attention because it is the master regulator of cellular Chol in the brain. Sterol regulatory element-binding proteins (SREBPs) include SREBP1, mostly expressed in the liver, and SREBP2, mostly expressed in the brain. The N-terminal of SREBPs contains a basic-helix-loop-helix leucine zipper domain which can function as transcription factor to regulate the synthesis and uptake of Chol (14). SREBP2 typically resides in the endoplasmic reticulum (ER) membrane and senses the changing level of ER Chol, which is reflective of cellular Chol level. Decreasing ER Chol induces the cleavage of SREBP2 soluble N-terminal domain, which is translocated to the nucleus to turn on Chol synthesis and/or uptake (14). Interestingly, in the pooled data (all brain regions in both gender) of different age groups, we found that the difference of SREBP2 between KO and WT grows as mice age and it only becomes statistically significant at 24 months (Figure 1B). When grouped by different brain regions, we found that SREBP2 levels were significantly lower in KO mice’s hippocampi and prefrontal cortexes (Figure 1C), where AD affects the most.
Given the impact of SREBP2 on brain Chol levels, we examined membrane Chol changed in KO and WT cells. To do so, we used mouse hippocampal culture and Filipin staining that is selective for membrane Chol. To achieve accurate quantification of neuronal membrane Chol, we modified Filipin staining in two ways. First, we labeled cells with AM1-43 (i.e., a fixable styryl dye selective for lipid bilayer) before fixation. 2-min incubation with AM1-43 lights up the cell surface membrane whereas 30-min incubation marks both the surface and the intracellular membranes. As such, the fluorescence intensity of AM1-43 can be used to normalize subsequent Filipin staining for the variation in membrane surface areas. Second, we adjusted Filipin application conditions for either surface membrane Chol (30 minutes at 4°C) or total membrane Chol (2 hours at room temperature).
After acquiring the fluorescent images, we normalized registered membrane Chol (i.e., FFilipin) to membrane surface area (i.e., FAM1-43) in the same cells (Figure 2A&C). The comparison of normalized total membrane Chol (i.e., FFilipin/FAM1-43) suggests an increase of Chol in KO hippocampal cells (Figure 2B). However, the comparison of normalized surface membrane Chol suggests a decrease in KO cells (Figure 2D). Taken together, our data suggest that APP deletion reduces surface membrane Chol but increases intracellular membrane Chol. Chol is a major component of the eukaryotic cell membrane with functional impact on many membrane proteins like receptors and ion channels (15). On the other hand, increase of intracellular membrane Chol often causes lysosome pathology (15). Hence, we asked if the observed alterations in the membrane Chol in KO brain cells might have caused any cellular pathologies, especially those related to AD. To do so, we applied immunostaining for Tau, phosphorylated Tau (pTau) and GFAP in cortical slices from 24-month-old WT and KO mice. The first two were used to detect AD-related Tau hyperphosphorylation (i.e., pTau vs. Tau) and GFAP level was used to evaluate neurodegeneration-associated gliosis. In comparison to WT, we observed more pTau labeling along with more GFAP immunostaining in the same areas of KO slices (Figure 3A). In fact, pTau vs. Tau ratio was significantly higher in KO than that in WT (Figure 3B). Moreover, GFAP signal intensity and area were significantly higher in KO than in WT (Figure 3C). These observations suggest that there were AD-like neuronal pathologies in the aging KO brains despite the lack of Abs.
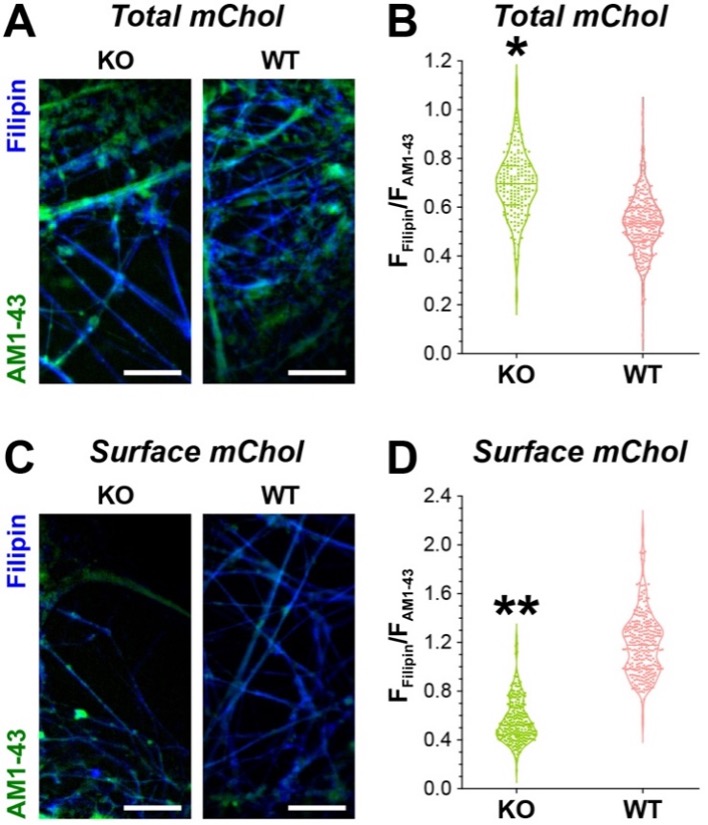
Figure 2. Filipin staining of membrane Chol in KO and WT hippocampal cells. A, Filipin (blue) and AM1-43 (green) co-staining of total membrane Chol and total membrane respectively. Scale bar = 50 mm. B, violin plot of normalized total membrane Chol (FFilipin/FAM1-43) of KO and WT hippocampal cells. Kolmogorov-Smirnov test. *: p < 0.05. C, Filipin (blue) and AM1-43 (green) co-staining of surface membrane Chol and surface membrane respectively. Scale bar = 50 mm. D, violin plot of normalized neuronal surface membrane Chol (FFilipin/FAM1-43) of KO and WT hippocampal cells. Kolmogorov-Smirnov test. *: p < 0.05.
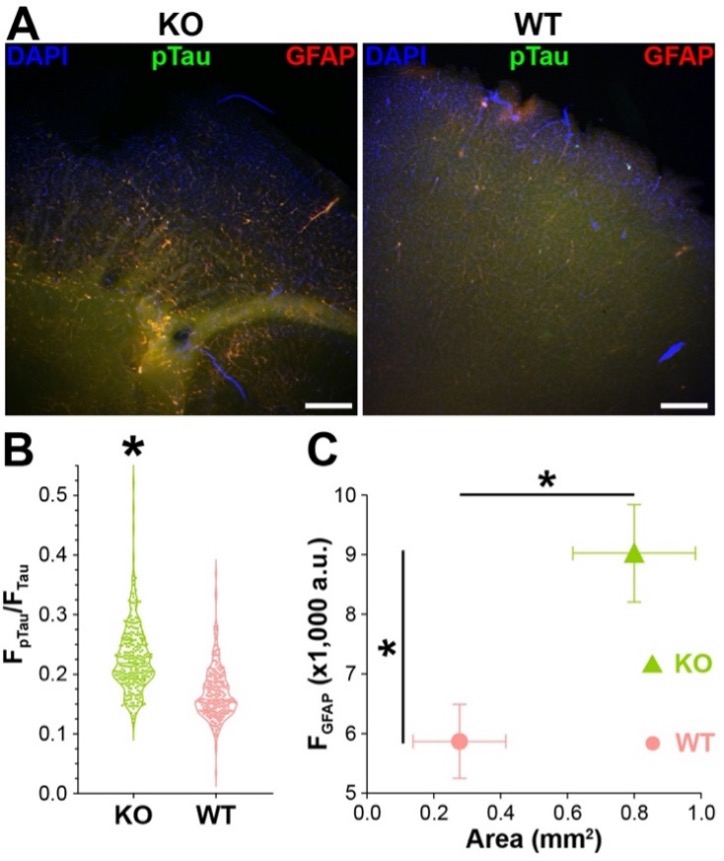
Figure 3. Immunostaining of AD-related pathologies. A, Sample images of KO and WT slices. Scale bar = 500 mm. B, violin plot of pTau vs. Tau immunostaining ratio. Kolmogorov-Smirnov test. *: p < 0.05. C, Mean and StdDev plot of GFAP immunofluorescence intensities vs. area. Kolmogorov-Smirnov test. *: p < 0.05.
DISCUSSION.
Despite its early recognition by Dr. Alios Alzheimer (2), the role of lipid in AD pathogenesis has long been ignored. In fact, ApoE4 (an isoform of ApoE), a major lipoprotein in the brain that regulates Chol levels, has been repeatedly identified as the greatest genetic risk factor for sAD. However, investigations have been mostly focusing on how ApoE4 promotes Aβ generation or hinders its clearance (16). The possibility of a direct pathogenic contribution by lipids, especially Chol, has been barely entertained in the AD research field (17–19). On the other hand, despite mounting evidence argued against it, amyloid hypothesis continuously dominates basic and clinical research (20–22).
In this study, we used APP-KO mice to explore pathogenic mechanisms independent of Aβ. We began with RNA-seq of the aging brains from the KO mice to identify gene expression changes due to the lack of APP. Among 31 identified genes, SREBP2 shows an intriguing spatiotemporal pattern. Namely, it exhibits more prominent difference in the aging brain (i.e., 24 months old) and in the brain regions that are more susceptible to AD (i.e., hippocampus and prefrontal cortex. Subsequent examination of cell membrane Chol by Filipin staining revealed significant increase of intracellular membrane Chol and decrease of surface membrane Chol in the absence of APP. This matches the SREBP2 change as the increase of intracellular membrane Chol prevents SREBP2 cleavage and consequently its expression. Last but not least, immunocytochemistry revealed Tau hyperphosphorylation and increased gliosis in the aging brain of KO mice. Notably, there was no Aβs in KO mice. So, those AD-like pathologies have to be caused by Aβ-independent mechanisms, which we proposed as the alternative Chol hypothesis.
This study supports the Chol hypothesis, that the dysregulation of neuronal membrane Chol is the culprit of AD. Given the ubiquitous expression of APP and its developmental role, neuron-specific deletion or conditional knockout like inducible deletion during aging will allow a better understanding of the relationship between APP and Chol homeostasis. In addition to SREBP2, RNA-seq also identified other genes that exhibit age-dependent or region-specific changes, which can be either upstream or downstream of SREBP2 or even no direction association. Pathway analyses of RNA-seq data will surely offer more mechanistic clues. Moreover, proteomic and lipidomic studies using mass spectrometry or other systematic measurements will certainly yield a more comprehensive understanding of lipids and their metabolism in relationship to AD pathogenesis. Such multiomic strategy will also provide more comprehensive view of AD origination and how Chol or other lipids contribute to it. Moreover, single-cell approaches in combination with the multiomic strategy will further narrow down the molecular and cellular basis of AD. For further testing of the Chol hypothesis, more investigations are needed to understand on how diverse AD risk factors, genetic or environmental, can converge on Chol and how Chol dysregulation can trigger diverse pathological changes in neurons and other brain cells.
ACKNOWLEDGMENTS.
The work was supported by Vanderbilt Research Experience for High School Students (E.Y.Z.). The authors want to thank Drs. Run Fan and Fei Ye’s in the Department of Biostatistics at Vanderbilt University for their guidance on statistical methodologies for differential gene expression analysis.
SUPPORTING INFORMATION.
Supporting Information includes tables S1-4 for antibodies, RNA quantification, Phred Quality, and significant genes, as well as supplementary Figure S1.
REFERENCES.
- Alzheimer’s Association, 2022 Alzheimer’s disease facts and figures. Alzheimer’s & Dementia. 18, 700–789 (2022).
- A. Alzheimer, Uber einen eigenartigen schweren Erkrankungsprozebeta der Hirnrinde. Neurologisches Centralblatt. 23, 1129–1136 (1906).
- C. Bellenguez, B. Grenier-Boley, J. C. Lambert, Genetics of Alzheimer’s disease: where we are, and where we are going. Curr Opin Neurobiol. 61, 40–48 (2020).
- D. J. Selkoe, The genetics and molecular pathology of Alzheimer’s disease: roles of amyloid and the presenilins. Neurol Clin. 18, 903–922 (2000).
- C. M. Karch, A. M. Goate, Alzheimer’s disease risk genes and mechanisms of disease pathogenesis. Biol Psychiatry. 77, 43–51 (2015).
- Y.-W. A. Huang, B. Zhou, M. Wernig, T. C. Südhof, ApoE2, ApoE3, and ApoE4 Differentially Stimulate APP Transcription and Aβ Secretion. Cell. 168, 427-441 (2017).
- C. E. DelBove, C. E. Strothman, R. M. Lazarenko, H. Huang, C. R. Sanders, Q. Zhang, Reciprocal modulation between amyloid precursor protein and synaptic membrane cholesterol revealed by live cell imaging. Neurobiol Dis. 127, 449–461 (2019).
- P. J. Barrett, Y. Song, W. D. van Horn, E. J. Hustedt, J. M. Schafer, A. Hadziselimovic, A. J. Beel, C. R. Sanders, The amyloid precursor protein has a flexible transmembrane domain and binds cholesterol. Science (1979). 336, 1168–1171 (2012).
- J. M. Dietschy, S. D. Turley, Cholesterol metabolism in the brain. Curr Opin Lipidol. 12, 105–112 (2001).
- E. E. Benarroch, Brain cholesterol metabolism and neurologic disease. Neurology. 71, 1368 (2008).
- S. Takamori, M. Holt, K. Stenius, E. A. Lemke, M. Grønborg, D. Riedel, H. Urlaub, S. Schenck, B. Brügger, P. Ringler, S. A. Müller, B. Rammner, F. Gräter, J. S. Hub, B. L. de Groot, G. Mieskes, Y. Moriyama, J. Klingauf, H. Grubmüller, J. Heuser, F. Wieland, R. Jahn, Molecular Anatomy of a Trafficking Organelle. Cell. 127, 831–846 (2006).
- F. M Sahebzamani, Examination of the FDA Warning for Statins and Cognitive Dysfunction. J Pharmacovigil. 02, 21-41 (2014).
- R. W. Mahley, Central Nervous System Lipoproteins: ApoE and Regulation of Cholesterol Metabolism. Arterioscler Thromb Vasc Biol. 36, 1305–1315 (2016).
- M. S. Brown, J. L. Goldstein, The SREBP pathway: regulation of cholesterol metabolism by proteolysis of a membrane-bound transcription factor. Cell. 89, 13-25 (1997).
- P. L. Yeagle, Cholesterol and the cell membrane. Biochimica et Biophysica Acta (BBA) – Reviews on Biomembranes. 822, 267–287 (1985).
- G. di Paolo, T.-W. Kim, Linking lipids to Alzheimer’s disease: cholesterol and beyond. Nat Rev Neurosci. 12, 284–296 (2011).
- A. C. Fonseca, R. Resende, C. R. Oliveira, C. M. Pereira, Cholesterol and statins in Alzheimer’s disease: current controversies. Exp Neurol. 223, 282–293 (2010).
- T. Y. Chang, Y. Yamauchi, M. T. Hasan, C. Chang, Cellular cholesterol homeostasis and Alzheimer’s disease. J Lipid Res. 58, 2239–2254 (2017).
- W. G. Wood, L. Li, W. E. Muller, G. P. Eckert, Cholesterol as a causative factor in Alzheimer’s disease: a debatable hypothesis. J Neurochem. 129, 559–572 (2014).
- E. S. Musiek, D. M. Holtzman, Three dimensions of the amyloid hypothesis: time, space and “wingmen.” Nat Neurosci. 18, 800–806 (2015).
- K. Herrup, The case for rejecting the amyloid cascade hypothesis. Nat Neurosci. 18, 794–799 (2015).
- D. J. Selkoe, J. Hardy, The amyloid hypothesis of Alzheimer’s disease at 25 years. EMBO Mol Med. 8, 595–608 (2016).

Posted by John Lee on Tuesday, May 30, 2023 in May 2023.
Tags: Alzheimer’s Disease, Amyloid Precursor Protein, Cholesterol