A Comparative Analysis of Cell Specificity and Regional Brain Volumes
ABSTRACT
Despite recent advancements in neuroimaging and genomics research, understanding how genetic factors influence brain regional characteristics remains challenging. Nonetheless, a deeper understanding can be achieved by uncovering how genes are expressed within specific cell types. To better understand this relationship, an analytical pipeline was developed that integrates cell-type-specific gene expression data from the Brain Initiative Cell Census Network (BICCN) with regional gene significance data from a transcriptome-wide association study (TWAS), between genetically regulated gene expression and brain volumes. The shared genes between the BICCN expression data and the TWAS regional genes were aligned, and cell-type-specific gene expression from BICCN was correlated with regional brain volume significance from TWAS. A unified dataset was produced revealing associations between cell-type-specific gene expression and regional brain volume, offering an analytical framework for integrating cell-specific data into brain genomics research.
INTRODUCTION.
Genes are the basic unit of heredity. They are passed from parents to offspring and thus determine heritable biological characteristics. The entirety of all the genes of an organism is called the genome [1]. The genome significantly contributes to observed variations in complex brain traits. Moreover, brain specific genetic studies have linked certain genes to diseases like Alzheimer’s Disease [2] and Parkinson’s Disease [3]. Identifying genes that are linked to disease risk will help better understand how they are inherited and how they are affected in brain disorders.
Neuroimaging traits are characteristics that can be observed with neuroimaging technologies of whole-brain structural and functional patterns, such as MRI and fMRI. They include brain volume, surface area, brain activity, as well as functional and structural connectivity. These traits have been linked to neurological disorders such as Parkinson’s Disease [3].
The Brain Initiative Cell Census Network (BICCN) is a recently developed human brain resource, and consists of studies from numerous hospitals, research institutes and universities [4]. Studies using this resource have already made advancements such as identifying an easier way to image and map brain cells to find more about cell characteristics [5] Recent work by Siletti, et al [6]. produced a brain-wide cell atlas using over three million cells, including two million neuronal cells, from 3 postmortem brains. Hierarchical clustering revealed thirty-one super clusters, 461 clusters, and 3313 subclusters of cell types based solely on the single-cell RNA-seq data. This study is a great resource due to its large amount of categorized data which reveals how genes are distributed throughout the cell types.
Here, the BICCN data was used in tandem with results from a recent study done in the Rubinov lab by Hoang et al. [7]. This latter study set out to improve understanding of the human brain by integrating many data modalities to reveal new associations between them. A transcriptome-wide association study (TWAS) was conducted as a part of this research with the purpose of finding associations between genetic variation through single nucleotide polymorphisms (SNPs) and gene expression. The TWAS found 1,065 genes that were associated with regional gray-matter volumes.
In this work, a methodology was developed that identifies cell specificity of genes whose gr-expression were linked, via TWAS, to brain traits. The utility of this method was demonstrated on volume-associated genes from the Hoang, et al. study. Our approach helps find associations between cell types and gene expressions and, thus links genes within certain cell types to regional brain volumes. I hope that these links can reveal new trends that were previously unknown and ultimately advance brain genomics research.
MATERIALS AND METHODS.
UK Biobank.
All genes were considered with available genetically regulated gene expression, or gr-expression, in brain regions, as estimated by Hoang, et al [7]. This resulted in 1,065 genes for our analysis. The TWAS results from this study were also used to determine the relevance of a gene based on the p-value found between the expression of that gene and the gray-matter volumes within that region.
Brain Initiative Cell Census Network.
A BICCN cell atlas generated by Siletti, et al. [6], which includes gene symbols and ensemble IDs, gene expression, brain region, and cell types. Around 3 million cells were sampled from 3 human brains and 10 regions with the goal of categorizing their cellular diversity and defining physiological traits. This data set was used as it contained millions of cells with gene expression data and clustering on a cell type level which is especially relevant in our project. The atlas provided hierarchical cell clustering results for neuronal and nonneuronal cells separately. There were 21 neuronal cell types and 10 non-neuronal cell types, including astrocytes, microglia, choroid plexus, oligodendrocytes, Ependymal cells, Fibroblasts, Bergmann Glia cells and Vascular cells. Fortunately, a GitHub folder was provided with documentation on how to download and manipulate the data [8].
Data Preprocessing.
The data was preprocessed in the following steps. First, the clustering annotation data from the taxonomy data frame was merged with the cell data. This included the clustering data which was the cell types for every cell. I needed to filter the data and create subsets that only included the gene expression, the cell type and the region of the brain that the cell was sampled from.
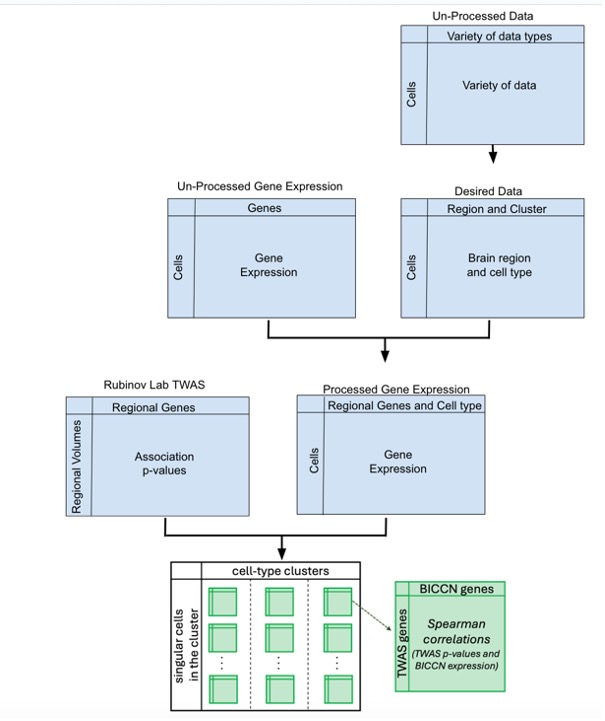
Second, the analyses focused on the anatomical division label (region of the brain), the supercluster (cell types) and the gene symbol. A data frame was created that contains the gene expression of all the cells by using the ‘get_gene_data’ function that the documentation provides. I then combined the gene expression data frame with the data frame that included the regions, cell types and gene symbols. Next, I limited the cells to be only from specific regions that had TWAS associations [7], namely: dorsolateral prefrontal cortex (DLPFC), caudate, nucleus accumbens, putamen, amygdala, hippocampus, and cerebellar hemisphere. Similarly, the genes were limited to those with previous associations. Together, this allowed the analyses of the BICCN cell expression data to be aligned with the TWAS significance data. Cells with a variance in gene expression that deviates more than 2 standard deviations from the mean variance are considered outliers and excluded from the analysis. All outliner and non-significant gene expressions were then removed. The full analysis pipeline is illustrated in Figure 1.

RESULTS.
The Spearman’s correlation coefficient was computed between the p-values of gene-trait associations in each regional volume TWAS to the gene expression of cells from each cell cluster. The following section discusses the results of these correlations.
Non-neuronal analysis.
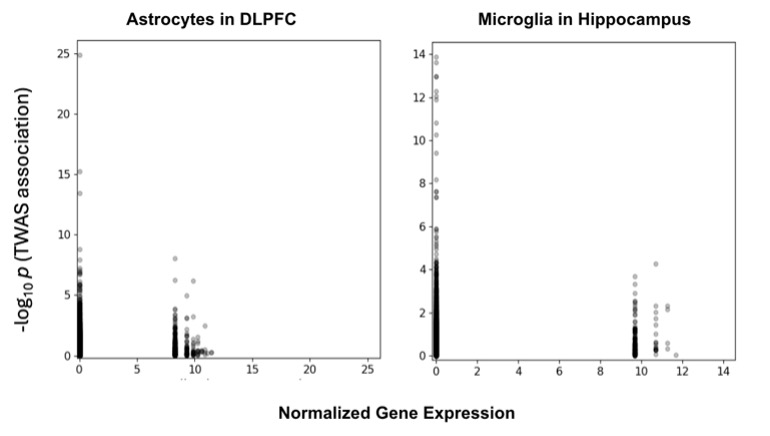
One of the more intriguing patterns that I observed was found in the cell type scatter plots of every region (Figure 2). There is a low gene expression cluster with high significance and then an area with intermediate expression with intermediate significance. Apart from these clusters there were no genes with significant associations, leaving a valley between the cluster peaks. This clustering could be caused by several factors. It might be the result from certain genes being expressed more under specific conditions such as temperature or it could be the result of transcription factors, which are proteins that regulate the gene expression in cells.

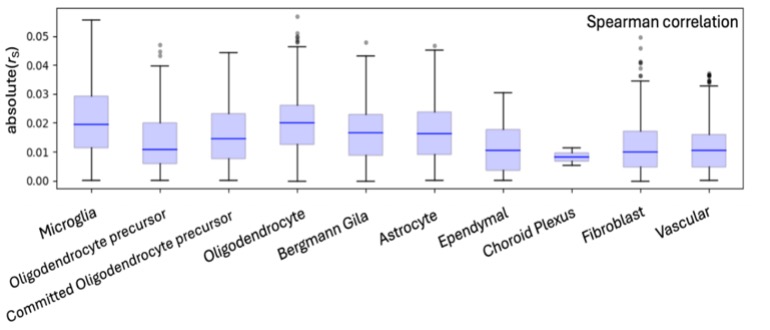
Separately, the distribution of correlations within specific cell types was considered. (Figure 3). It was found that the correlations were, in general, normally distributed and had similar standard deviation, with some reduced variation for the choroid plexus.

Neuronal Analysis
The neuronal cell-type scatter plots exhibited the same clustering trend that was seen in the non-neuronal cell-type plots (Figures 4 and 5).


DISCUSSION.
Non-Neuronal Results.
By using the graphs some conclusions and speculations can be made. From the scatter plots, two clusters form, creating a valley between the significant peaks. It is not known why this happens as it is outside the scope of our research; however future research that looks at the individual genes and their biological functions by utilizing a gene ontology analysis could provide insight. Additionally, a general downward trend between the peaks of the two clusters can be seen. While this is not represented mathematically as none of the correlation coefficients suggest an inverse relationship, by looking at the peaks there seems to be a downwards slope. This might hint to a negative correlation between gene expression and the significance of that gene; however, this is purely speculation, and further research would be needed to find out why this was observed. In the correlation box plots the choroid plexus is repeatedly seen with much lower distributions as compared to the other cell types. Yet again, while I do not know why this occurs, I can speculate. This trend might occur within the choroid plexus because as it is the cell that creates cerebrospinal fluid, its purpose is largely the same throughout different brain regions meaning there is no need for specification. This might explain why it’s the least varied cell type.
Neuronal Results.
From the neuronal scatter plots, the same clustering pattern is observed, proving that it is not unique to just the non-neuronal cells. The association between gene expression and TWAS data does differ from the downward trend seen in non-neuronal cell types, suggesting this effect was most likely variance. Yet again, the correlation box plots differ from their non-neuronal counterparts as none of the neuronal cell types exhibit the same trend as the choroid plexus did. This makes the choroid plexus even more unique, further prompting the need for future research to find out why that trend occurs.
While the reasons behind these trends are unknown now, the point is that these trends can be observed due to the creation of the dataset that combines cell type specificity and the significance of the gene expression. Many more graphs, figures and statistical tests can be run on this dataset to find even more relationships. This is simply just a showcase of the potential insights that the use of cell-type specificity can provide.
Limitations and future research.
Despite the progress this project has made, drawbacks are still apparent. One that occurs between both neuronal and non-neuronal analyses is that the data frame used is not representative of the general human population. More specifically, the cells that were collected from the BICCN were all sampled from four human brains, all of them being middle aged men. This discrepancy does limit the results of this project. Our future research plans to rectify this by incorporating more data frames with cells from women and a variety of ages and conditions. Another issue that was discovered was the number of genes that were analyzed. While they all relatively affect regional brain volume, it may include some common genes that have very little involvement. Integrating a filtration process to only include important genes would be beneficial. Doing this would most likely change the results of the scatter plots created, hopefully making it easier to conclude on what the data means as well as revealing new trends.
CONCLUSION.
This study shows that it is possible for cell-type specificity data from the BICCN to be integrated with the significance of regional brain volume genes. Additionally, correlations between cell types and regional brain volume genes were identified. These can be used to provide new insights into where significant genes are in different cell types which can help focus research on genes of interest. Overall, this study demonstrates a multimodal approach for studying relationships amongst genes, cells, and brain traits. It also provides a framework for other researchers if they want to create their own multimodal dataset. Even with these benefits, there are still some limitations and caveats to this research. The lack of diversity and variety in the brains that the cells were taken from, and the large number of genes does hinder the effectiveness of the study. Despite the drawbacks of this study, this study still has the potential to contribute to the field of genomics. Hopefully this research can be applied in the effort of getting a better understanding of the brain and potentially lead to treatments and maybe even cures of harmful brain conditions.
RESOURCES.
All analyses were conducted on Vanderbilt University’s ACCRE cluster using Python 3.7.2 within a Jupyter Notebook environment.
ACKNOWLEDGMENTS.
Huge thanks to Nhung Hoang and Neda Sardaripour for their continuous support as well as my advisor Dr. Popp for guidance and feedback. I would also like to acknowledge Dr. Rubinov for allowing me to be a part of his lab as well as all the Rubinov Lab members for providing an engaging academic environment.
REFERENCES.
1.National Human Genome Research Institute, “Introduction to Genomics,” Accessed November 5, 2024. https://www.genome.gov/About-Genomics/Introduction-to-Genomics
- M. Giri, M. Zhang, Y. Liu, “Genes associated with Alzheimer’s disease: an overview and current status.” Clinical Interventions in Aging 11, 665-681 (2016)
- S. Yao, et. al. “A transcriptome-wide association study identifies susceptibility genes for Parkinson’s disease.” npj Parkinson’s Disease 7, 79 (2021).
- Brain Initiative Cell Census Network, “Teams” Accessed September 10,2024. https://www.biccn.org/teams
- X. Han, et. al. “Whole human-brain mapping of single cortical neurons for profiling morphological diversity and stereotypy.” Science Advances 9, eadf3771 (2023).
- K. Siletti et. al. “Transcriptomic diversity of cell types across the adult human brain.” Science 382, eadd7046 (2023).
- N. Hoang et. al. “Integration of estimated regional gene expression with neuroimaging and clinical phenotypes at biobank scale.” PLoS Biology 22, e3002782 (2024).
- Allen Institute, “Human whole-brain transcriptomic cell type atlas (Kimberly Siletti)” Accessed June 7,2024. https://alleninstitute.github.io/abc_atlas_access/descriptions/WHB_dataset.html
Posted by buchanle on Thursday, June 26, 2025 in May 2025.
Tags: Brain regions, Cells, Genes, Genomics, Neuroscience

