Analyzing Platform Motion Impacts on Floating Offshore Wind Turbines Using Blade Element Momentum Theory
ABSTRACT
Floating offshore wind turbines are a promising solution to harness high wind energy in deep waters where fixed-bottom turbines are not feasible. However, platform motion induced by waves, currents, and wind can significantly impact turbine performance, affecting both power generation and structural stability. This study investigates the effects of platform surge motion magnitude and offshore platform type on the aerodynamic performance of floating wind turbines using Blade Element Momentum (BEM) theory. Simulations were conducted for four platform types with different natural frequencies —VolturnUS, WindCrete, ActiveFloat, and OO-Star—under varying surge motion magnitudes (1–10 meters). Key performance metrics, including average power output, power amplitude, average thrust, and thrust amplitude, were analyzed. Results reveal that WindCrete achieves the highest power output but experiences significant variability in thrust and power amplitudes, making it more suited for high-energy environments. In contrast, platforms like VolturnUS and ActiveFloat demonstrated stable performance, balancing power output and thrust consistency, while OO-Star exhibited the least variability, indicating its suitability for environments prioritizing mechanical stability. This research highlights the trade-offs between power generation and stability across platform types, providing insights to optimize platform design and turbine efficiency.
INTRODUCTION.
As the global demand for renewable energy continues to rise, offshore wind turbines are emerging as a critical component in the transition toward clean and sustainable energy sources. Offshore wind energy offers unique advantages, including higher and more consistent wind speeds over deep waters, resulting in greater energy generation compared to onshore alternatives. Floating offshore wind turbines are transforming energy production by enabling deployment in deep-water locations [2], thereby conserving land space. BEM theory [1] is a widely used approach for modeling wind turbine aerodynamics, providing a balance between computational efficiency and accuracy [3]. BEM integrates two fundamental principles: Blade Element Theory and Momentum Theory, to predict aerodynamic forces and performance metrics. Blade Element Theory divides each turbine blade into small segments, known as blade elements, and calculates lift, drag, and aerodynamic forces for each section based on airfoil characteristics and local wind conditions. Momentum Theory models the wind turbine rotor as an actuator disk that extracts energy from the wind. It applies the principles of conservation of mass and momentum to analyze how wind speed decreases as energy is extracted by the rotor, providing estimates for axial thrust and the resulting pressure drop across the rotor.
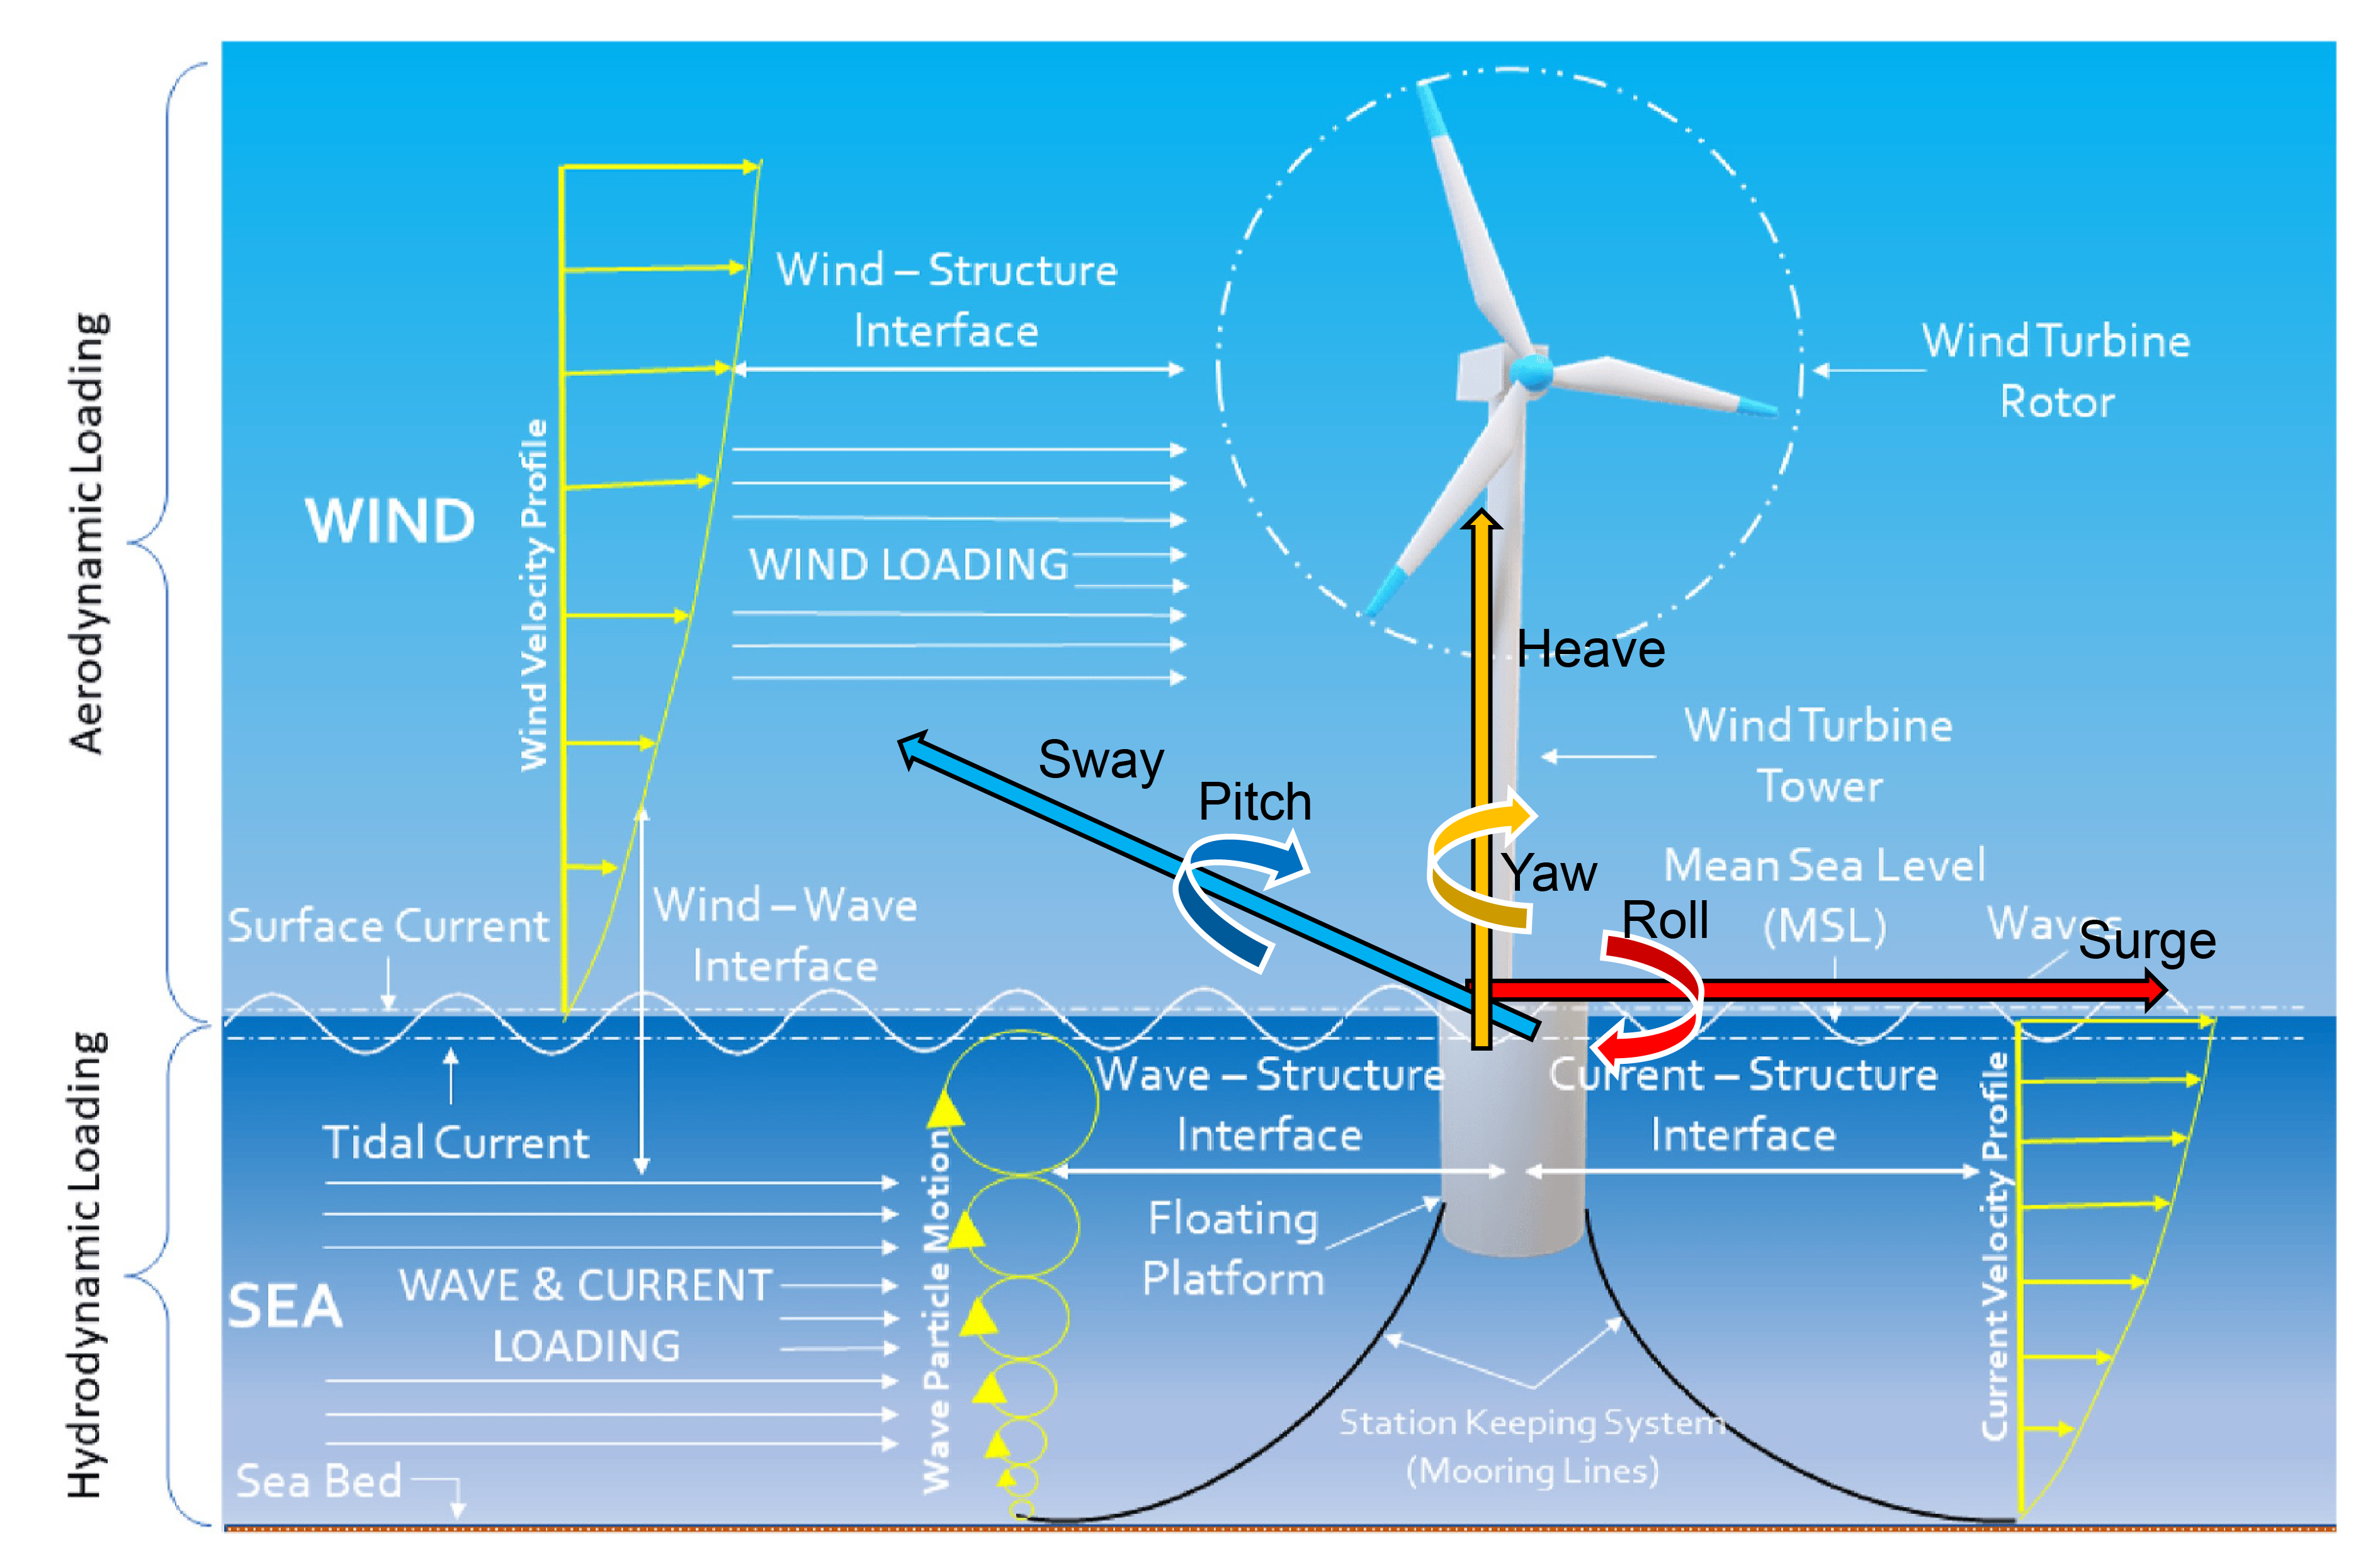
Figure 1 shows the schematic diagram of offshore wind turbine and different hydrodynamic forces acting on offshore turbine platform. The performance of offshore wind turbines is influenced by displacement in six degrees of freedom, which includes three translational motions—surge, sway, and heave—and three rotational motions—roll, pitch, and yaw. These six degrees of freedom result from the combined effects of environmental forces and system restoring loads acting on the floating wind turbine. Previous studies published by Journal of Wind Engineering and Industrial Aerodynamics highlighted the importance of pitch motion magnitudes on offshore wind turbine performance [4]. Large pitch motion magnitudes (e.g., 4°) significantly impact the aerodynamic performance of offshore wind turbines, leading to strong wake interactions and up to 24% reduction in predicted power and thrust compared to smaller pitch motions (1–2°). This study is the first of its kind to focus on the impact of an offshore platform’s natural frequency on turbine performance in response to wave surge motion.
Hypothesis.
If offshore floating wind turbines, with different natural motion frequencies (VolturnUS-0.00700 Hz, WindCrete-0.01221 Hz, ActiveFloat-0.00600 Hz, OO-Star-0.00540 Hz), are tested under simulated surge motion data conditions, then the platform with the lowest natural motion frequency will deliver the most stable performance and less mechanical stress, as indicated by smaller fluctuations in power and thrust. Conversely, platforms with higher frequencies may face larger swings under surge conditions. Natural motion frequency measured in Hertz (Hz) is defined as the inherent frequency at which the turbine structure naturally tends to oscillate.
Essential Components.
Independent Variable: Natural surge motion frequency of Floating Offshore Wind Turbine (FOWT) Platforms (WindCrete-0.01221 Hz, VolturnUS-0.00700 Hz, ActiveFloat-0.00600 Hz, OO-Star-0.00540 Hz) under surge-motion conditions.
Dependent Variables: Performance of Offshore Wind Turbines, measured by average power output (in Watts), average thrust output (in Newtons), power amplitude (in Watts), thrust amplitude (in Newton).
Constants: Turbine geometry (blade length – 117 meters, number of blades – 3, turbine height – 150 meters and density of air (1.23 kg/m³).
Comparison Group: OO-Star Turbine that has lowest frequency out of all four types of offshore wind turbines (0.00540 Hz frequency of the platform motion) but has the same constants referred to above.
MATERIALS AND METHODS.
Simulation Setup and Procedure.
This study utilized a Python-based BEM simulation to evaluate the impact of platform motion on offshore wind turbine performance. A custom Python program based on BEM theory was developed to calculate aerodynamic forces acting on turbine blades, specifically focusing on power output and axial thrust. Blade geometry data, including span, twist, chord lengths, and airfoil identifiers were imported from CSV files and converted into NumPy arrays to enable efficient numerical processing. Airfoil characteristics, such as lift coefficients, drag coefficients, and angles of attack, were loaded for 50 blade segments. Simulations were conducted using the PyCharm Integrated Development Environment (IDE). Four distinct floating platform types: VolturnUS, WindCrete, ActiveFloat, and OO-Star were tested with surge motion magnitudes ranging from 1 to 10 meters. Each turbine blade was segmented into 50 airfoil sections, consistent with Blade Element Theory, to enable detailed aerodynamic analysis. Individual power and thrust calculations for each blade segment were carried out using established equations.
\[dP=dQ\ \omega\tag{1}\]
Power contributions (dP) were computed as the product of differential torque (dQ) and rotor speed (ω).
The torque contribution ( per blade element was calculated using the formula
\[dQ=4\pi r^3\rho U₁ω1-AA’dr\tag{2}\]
Thrust (dT) was calculated using the formula:
\[dT=4\pi r\rho U_1^2\ A(1-A)dr\tag{3}\]
Where is the radial position of the blade element (distance from the hub), ‘ ‘ is Air density (kg/m³), ‘Local wind speed at the blade element, ‘ ‘ is Rotor speed (angular velocity, rad/s), ‘ ‘ is Axial induction factor (fractional decrease in wind velocity through the rotor), ’ is Tangential induction factor (adjusts for rotational effects of wake), ‘dr‘ is Differential element width along the blade. Power and thrust amplitude values were determined based on fluctuations around their respective average values. The Python simulation computed performance metrics including Average Power Output, Power Amplitude (fluctuations), Average Thrust, and Thrust Amplitude (fluctuations) by averaging instantaneous calculations across all 50 airfoil sections. All simulation outputs were systematically recorded in a Google Spreadsheet titled “BEM Data Collection” for subsequent statistical analysis and visualization, completing a comprehensive workflow from data preparation through result documentation.
Platform and Turbine Model Parameters.
The simulated wind turbine featured fixed geometric properties, including blade length, turbine height, and number of blades. These parameters were held constant across all tests to isolate the impact of platform motion. Environmental conditions, including wind speed (10 m/s) and air density (1.23 kg/m³ at sea level), were standardized throughout the simulations to ensure consistency in aerodynamic analysis.
Data Analysis and Visualization.
Key performance metrics for each platform type were compared using graphs to identify trends and evaluate platform performance across different motion magnitudes. Metrics such as power amplitude and thrust amplitude were analyzed to assess the variability in energy capture caused by platform motion.
Validation and Quality Control.
To ensure accuracy and reliability, duplicate simulations were performed for selected conditions. Results were cross-checked against theoretical expectations based on BEM principles. In addition, simulation outputs were reviewed for consistency, and any anomalies in the data were identified and analyzed.
RESULTS.
This study evaluates the performance of floating offshore wind turbines under varying platform surge motion magnitudes, focusing on four platform types with different natural frequencies: WindCrete (0.01221 Hz), VolturnUS (0.00700 Hz), ActiveFloat (0.00600 Hz), and OO-Star (0.00540 Hz). Key performance metrics analyzed include average power output, power amplitude (fluctuations), average thrust, and thrust amplitude (fluctuations).
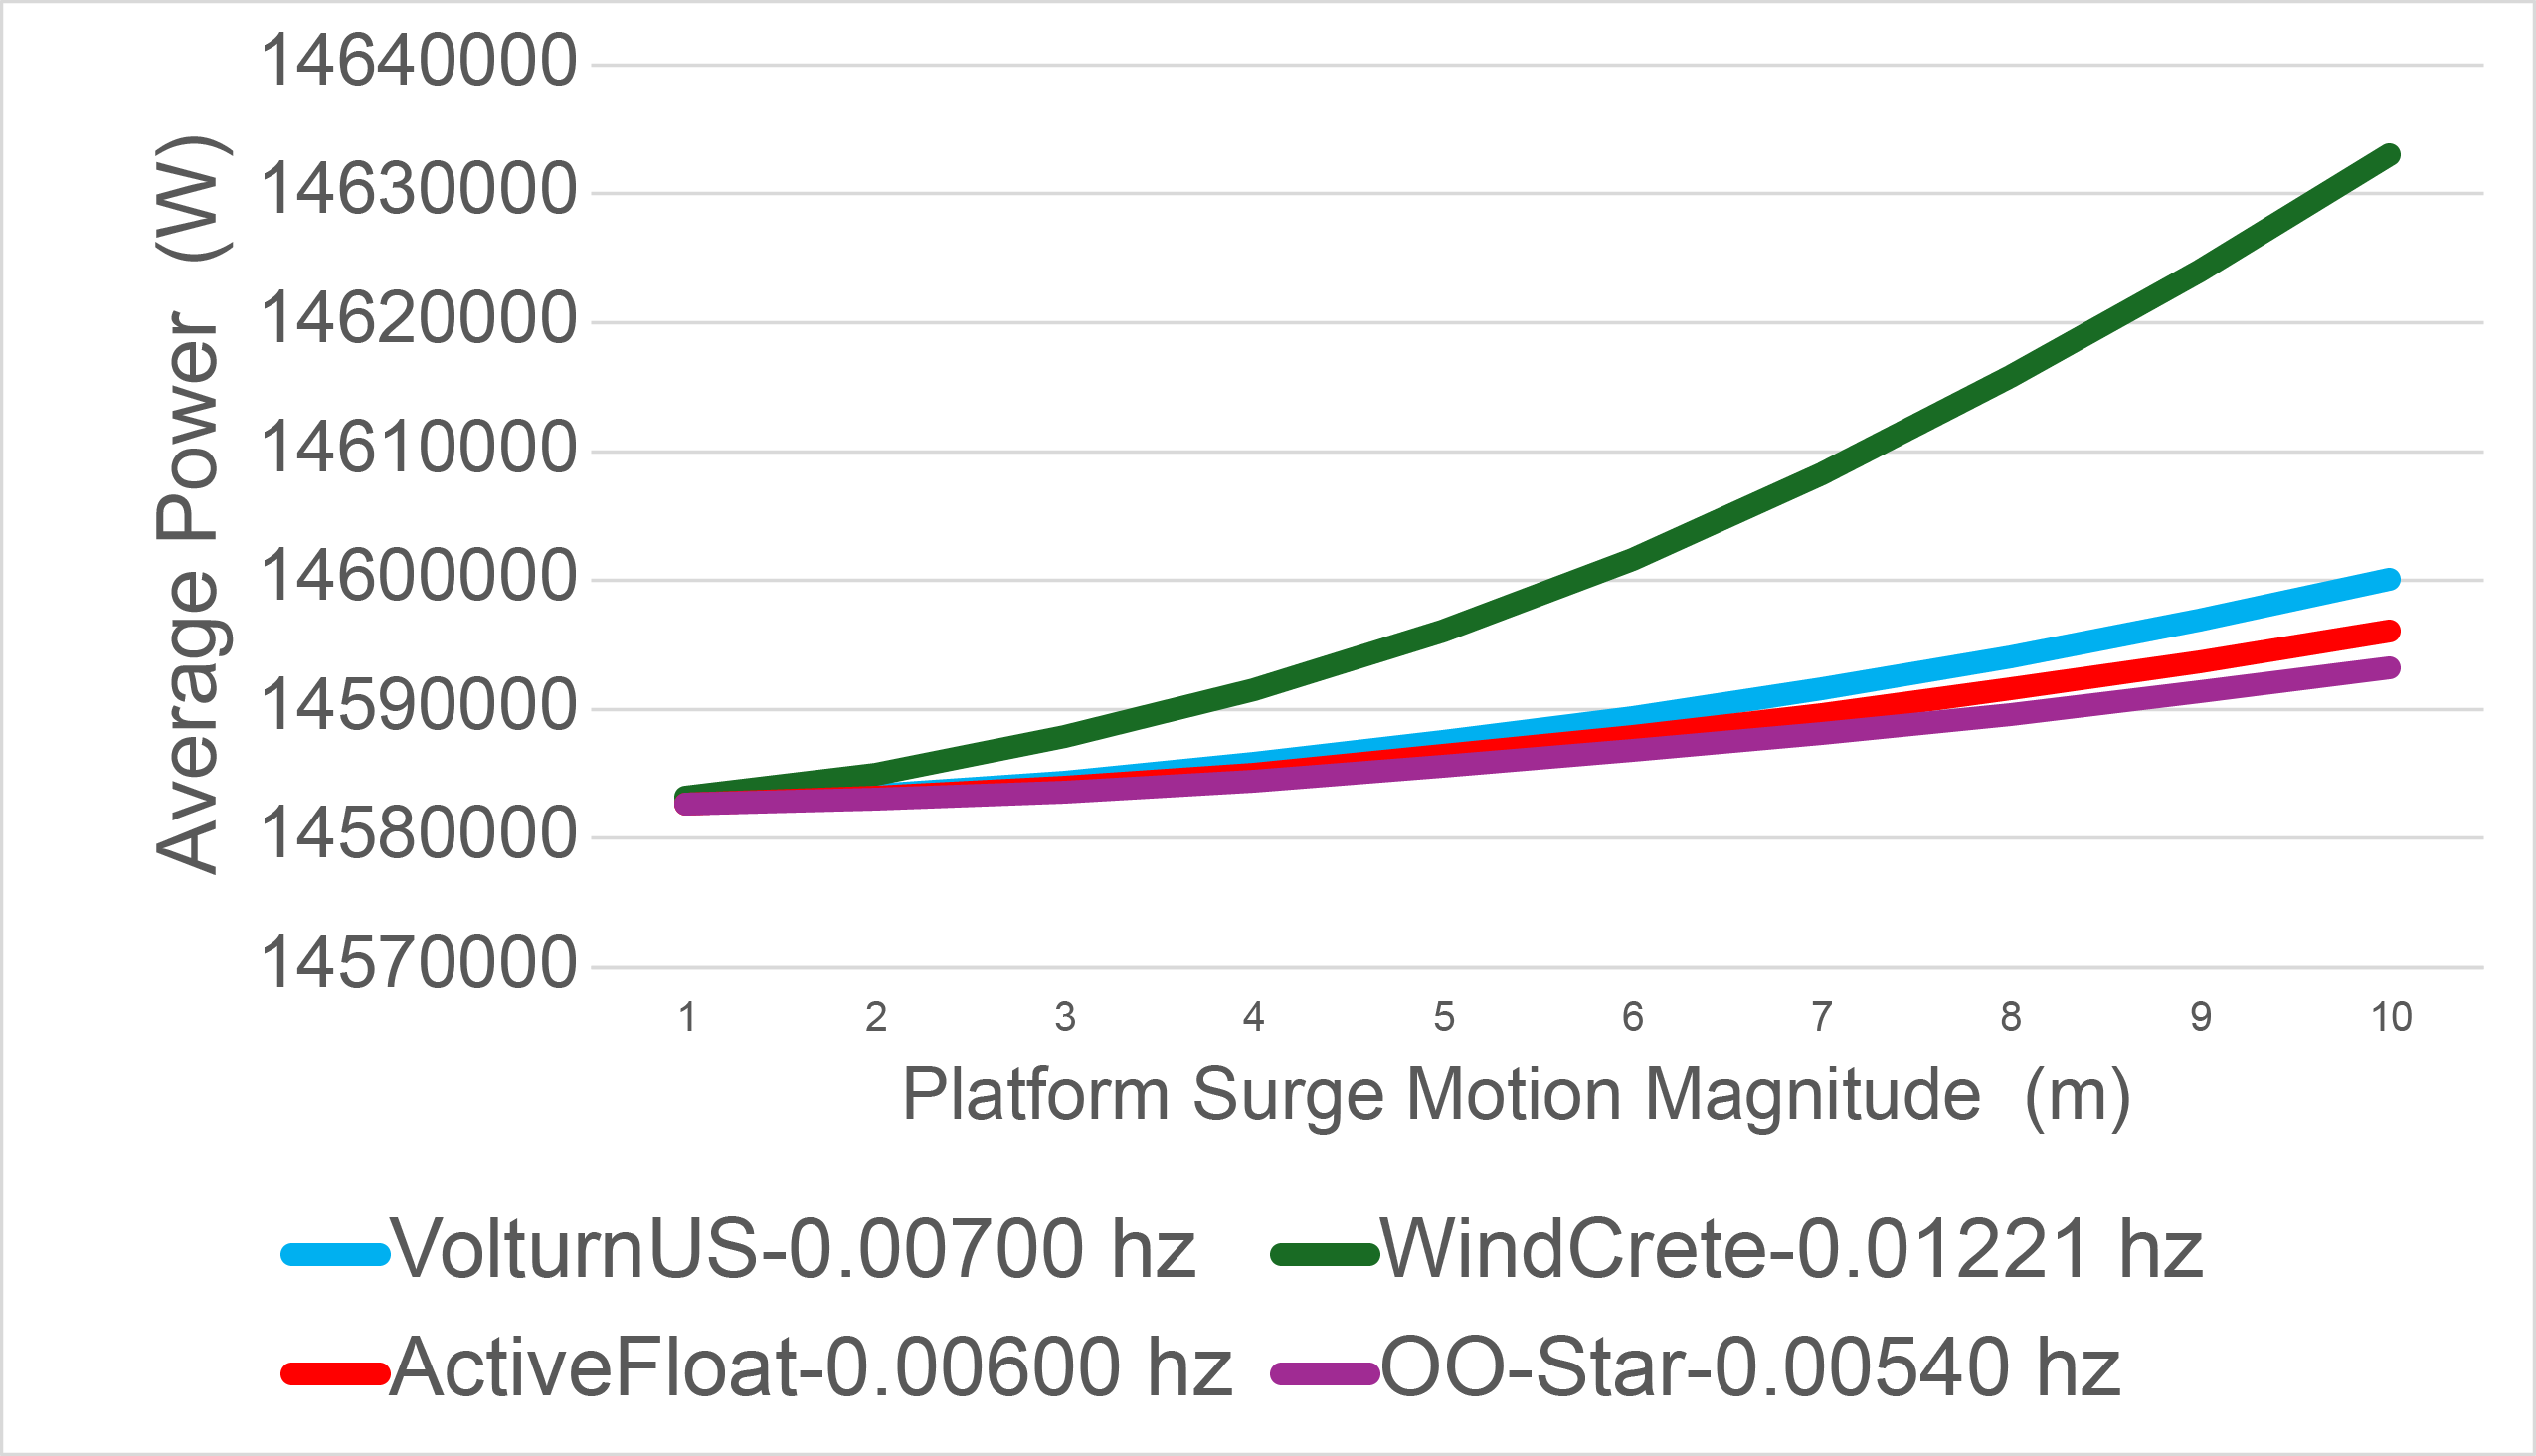
The metric goal was to maximize average power output. Among all platforms tested, WindCrete consistently generated the highest average power across all surge motion magnitudes (from 1 meter to 10 meters) under simulated conditions, significantly outperforming the other platforms (Figure 2). In contrast, VolturnUS, ActiveFloat, and OO-Star exhibited more stable but lower power outputs, indicating reduced energy generation compared to WindCrete.
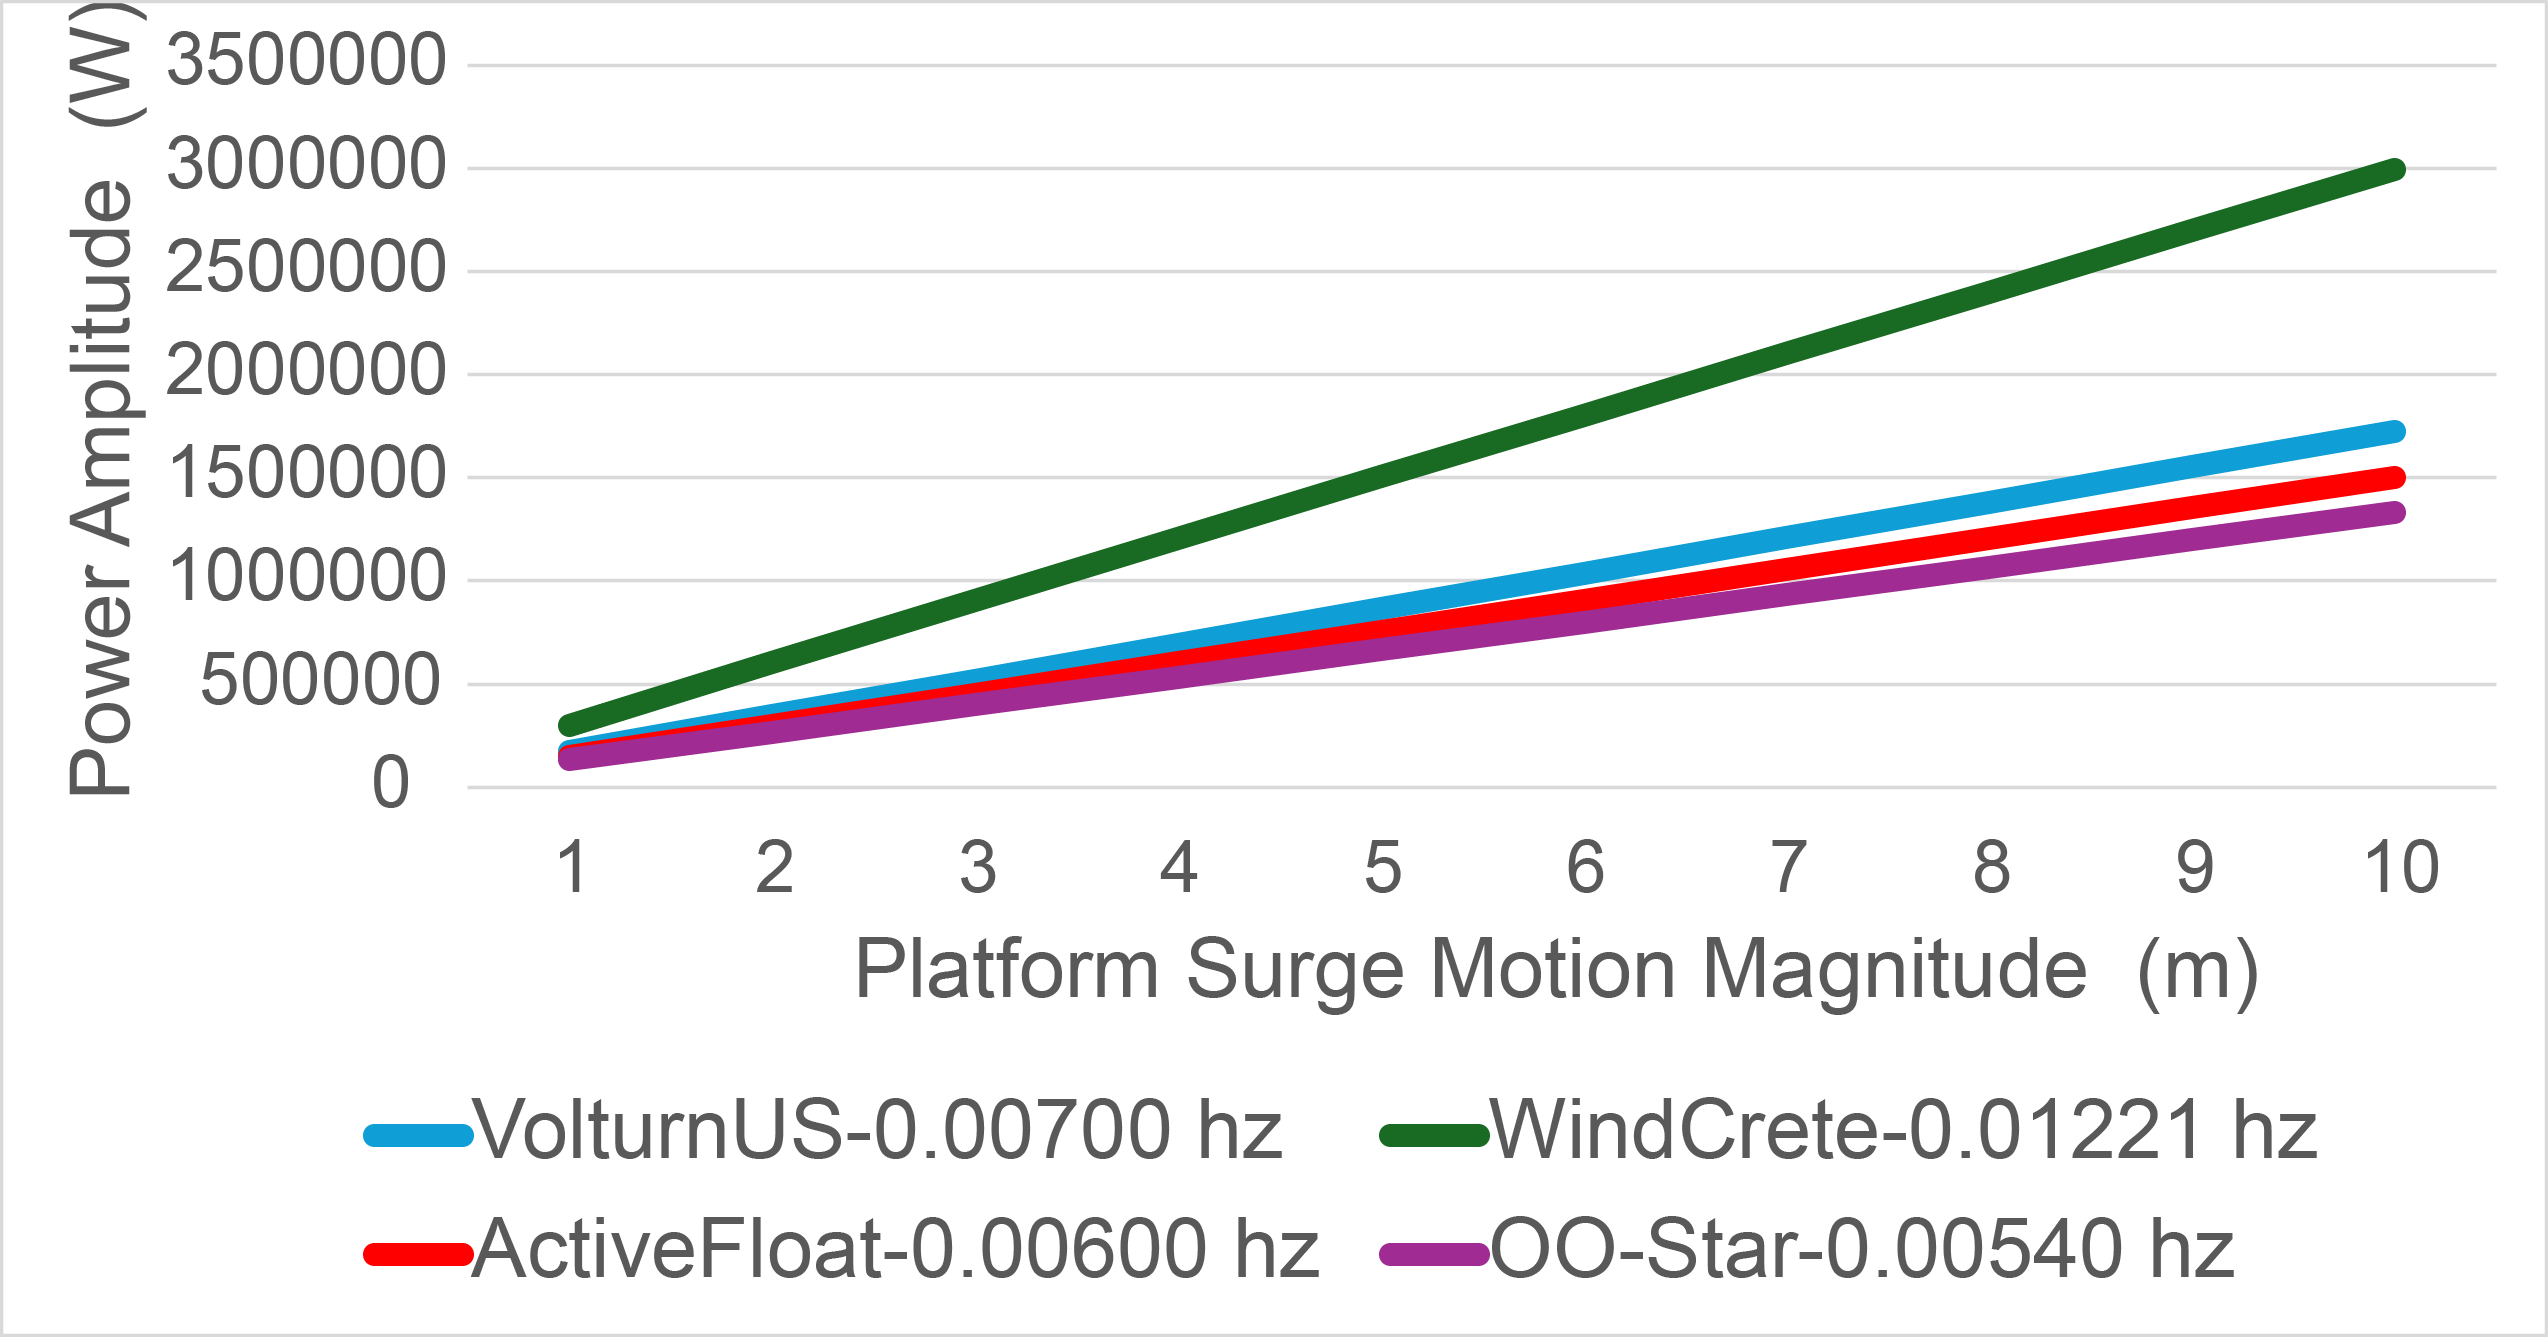
The metric goal was to minimize power fluctuations. Among all platforms, OO-Star demonstrated the lowest power fluctuation across all surge motion magnitudes (from 1 meter to 10 meters) under simulated conditions, indicating reduced mechanical stress and a more stable power output (Figure 3). VolturnUS and ActiveFloat exhibited slightly higher power fluctuations than OO-Star, while WindCrete experienced the highest fluctuations, reflecting significant variations in power output across different surge magnitudes.
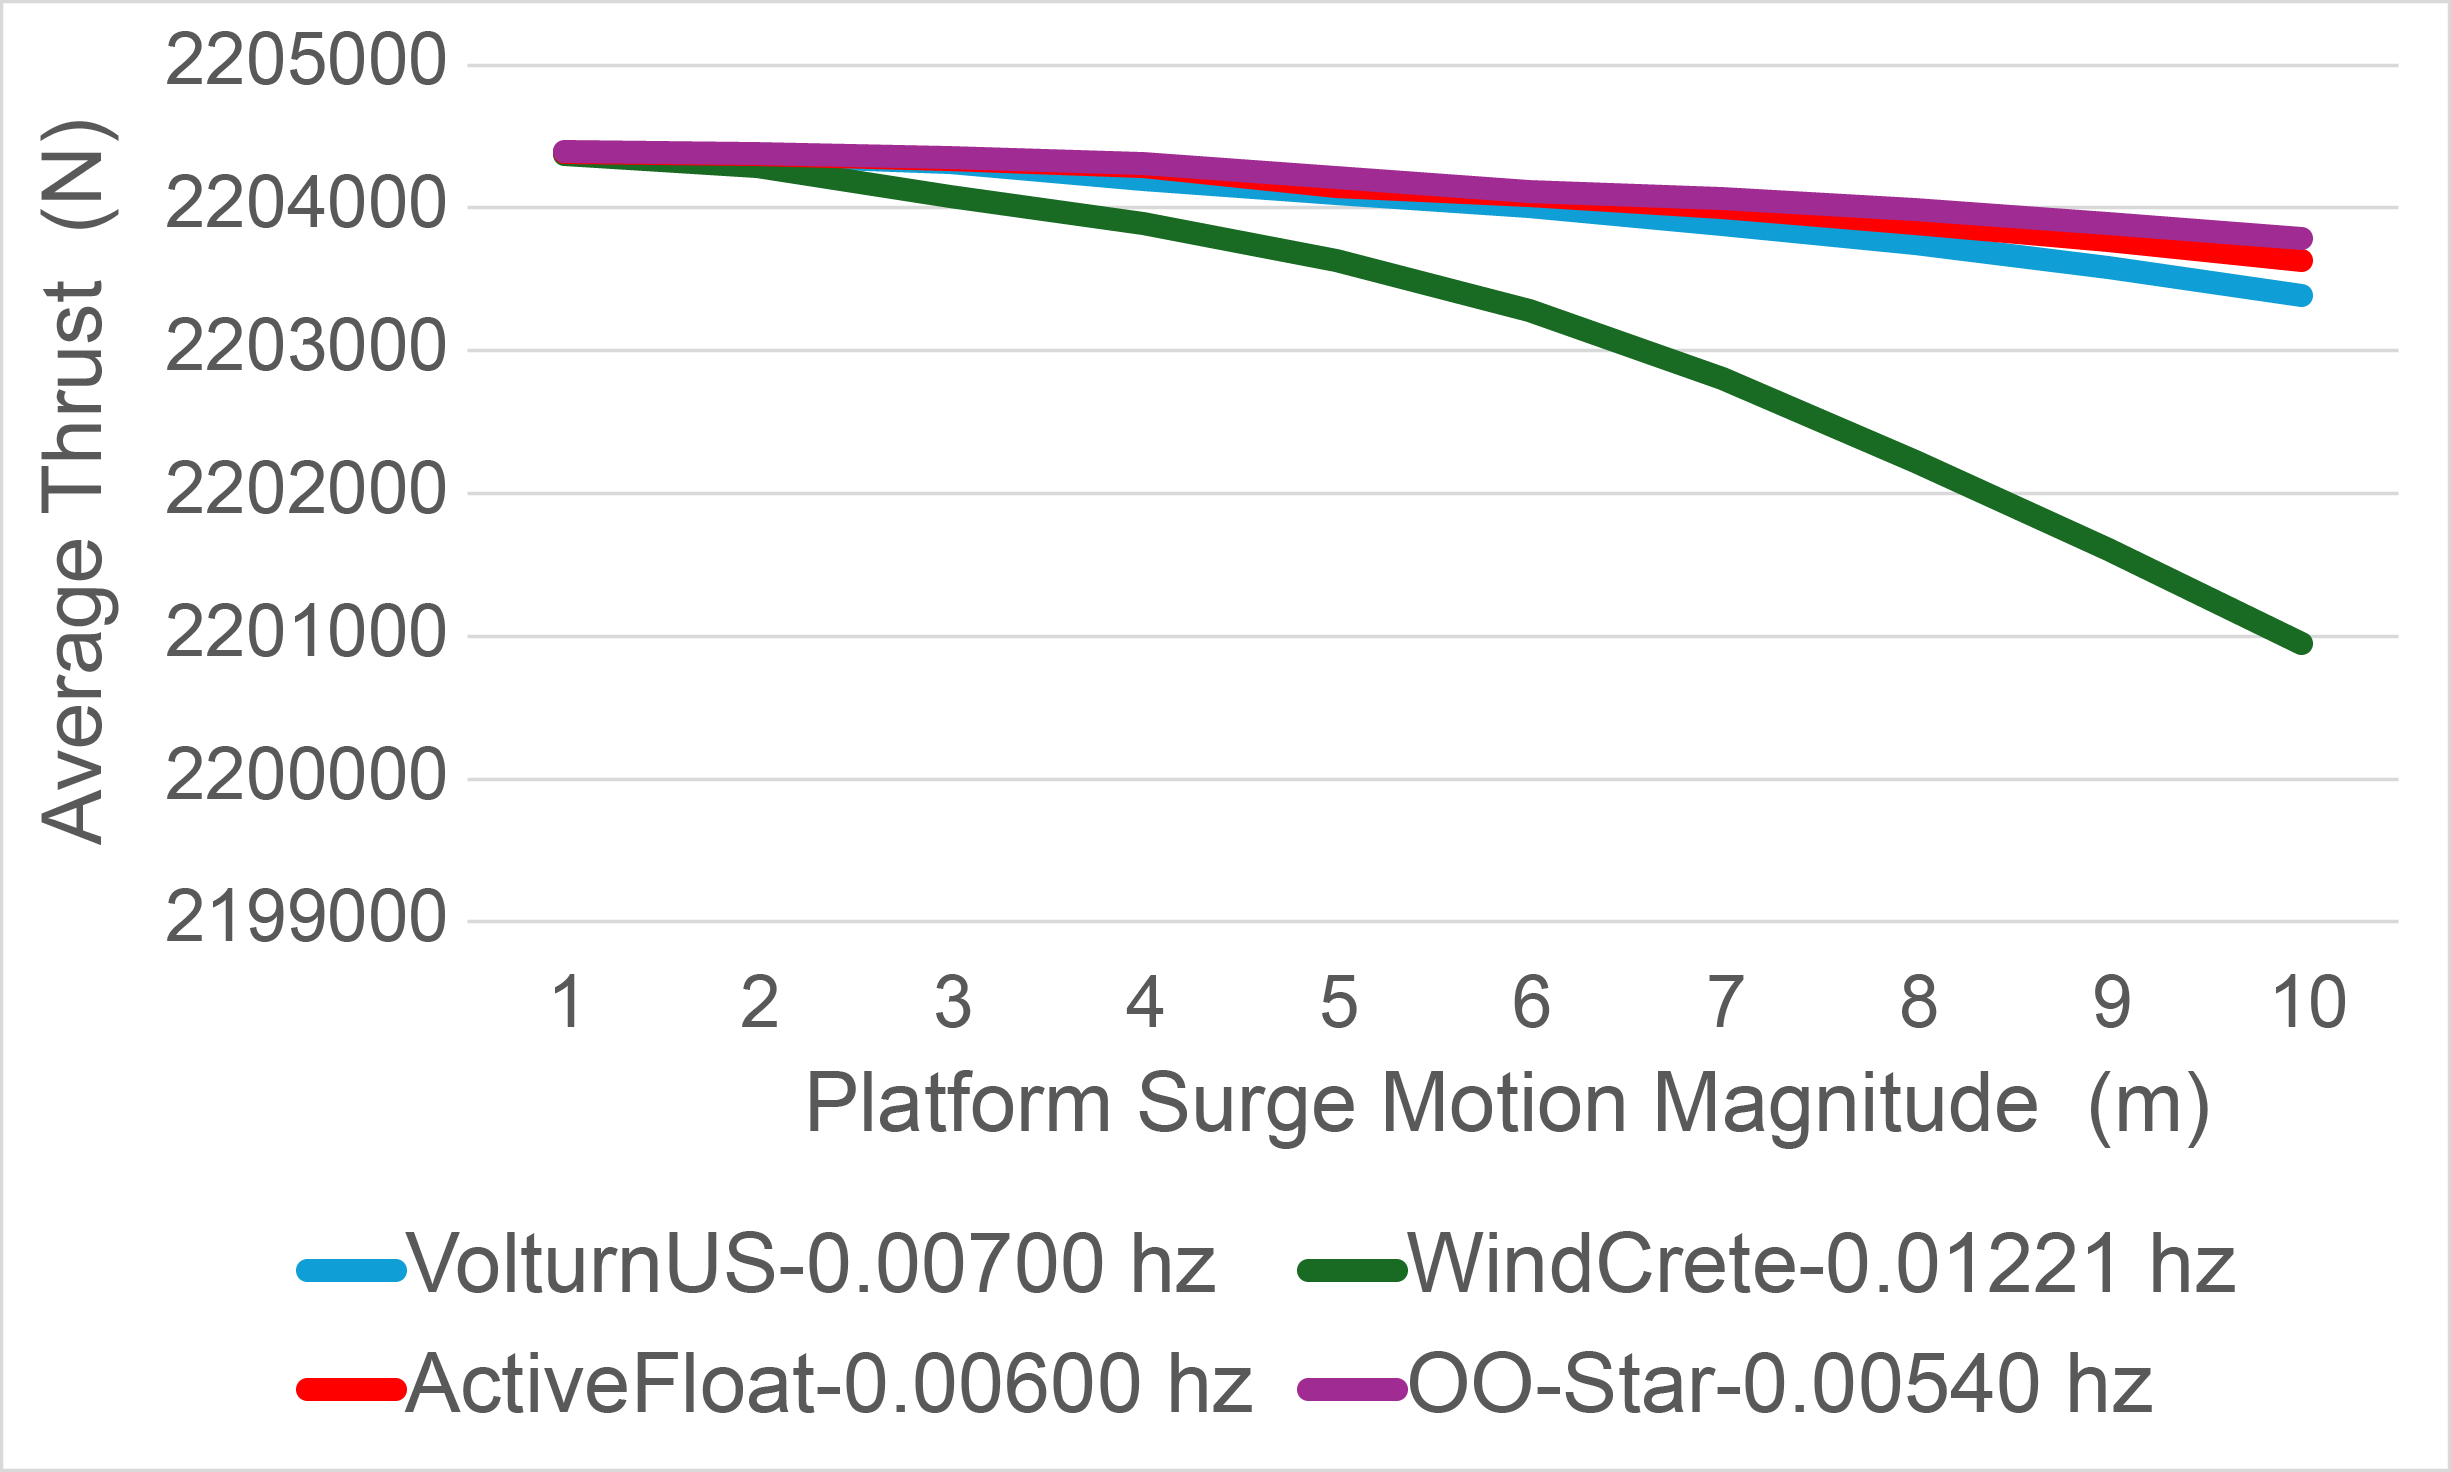
The metric goal was to maintain higher and more stable average thrust. Among all platforms, OO-Star exhibited the most stable average thrust (axial force), indicating less negative impact from platform surge motion magnitude (Figure 4). VolturnUS and ActiveFloat showed slightly lower average thrust compared to OO-Star, while WindCrete experienced the most significant drop in thrust across increasing surge motion magnitudes.
The metric goal was to minimize thrust fluctuations. Among all platforms, OO-Star exhibited the lowest amplitude of thrust (axial force) variation across all surge motion magnitudes, reducing stress on turbine components (Figure 5). VolturnUS and ActiveFloat showed slightly higher thrust fluctuations compared to OO-Star, while WindCrete experienced the largest variations (highest thrust amplitude), which could lead to greater fatigue loads.
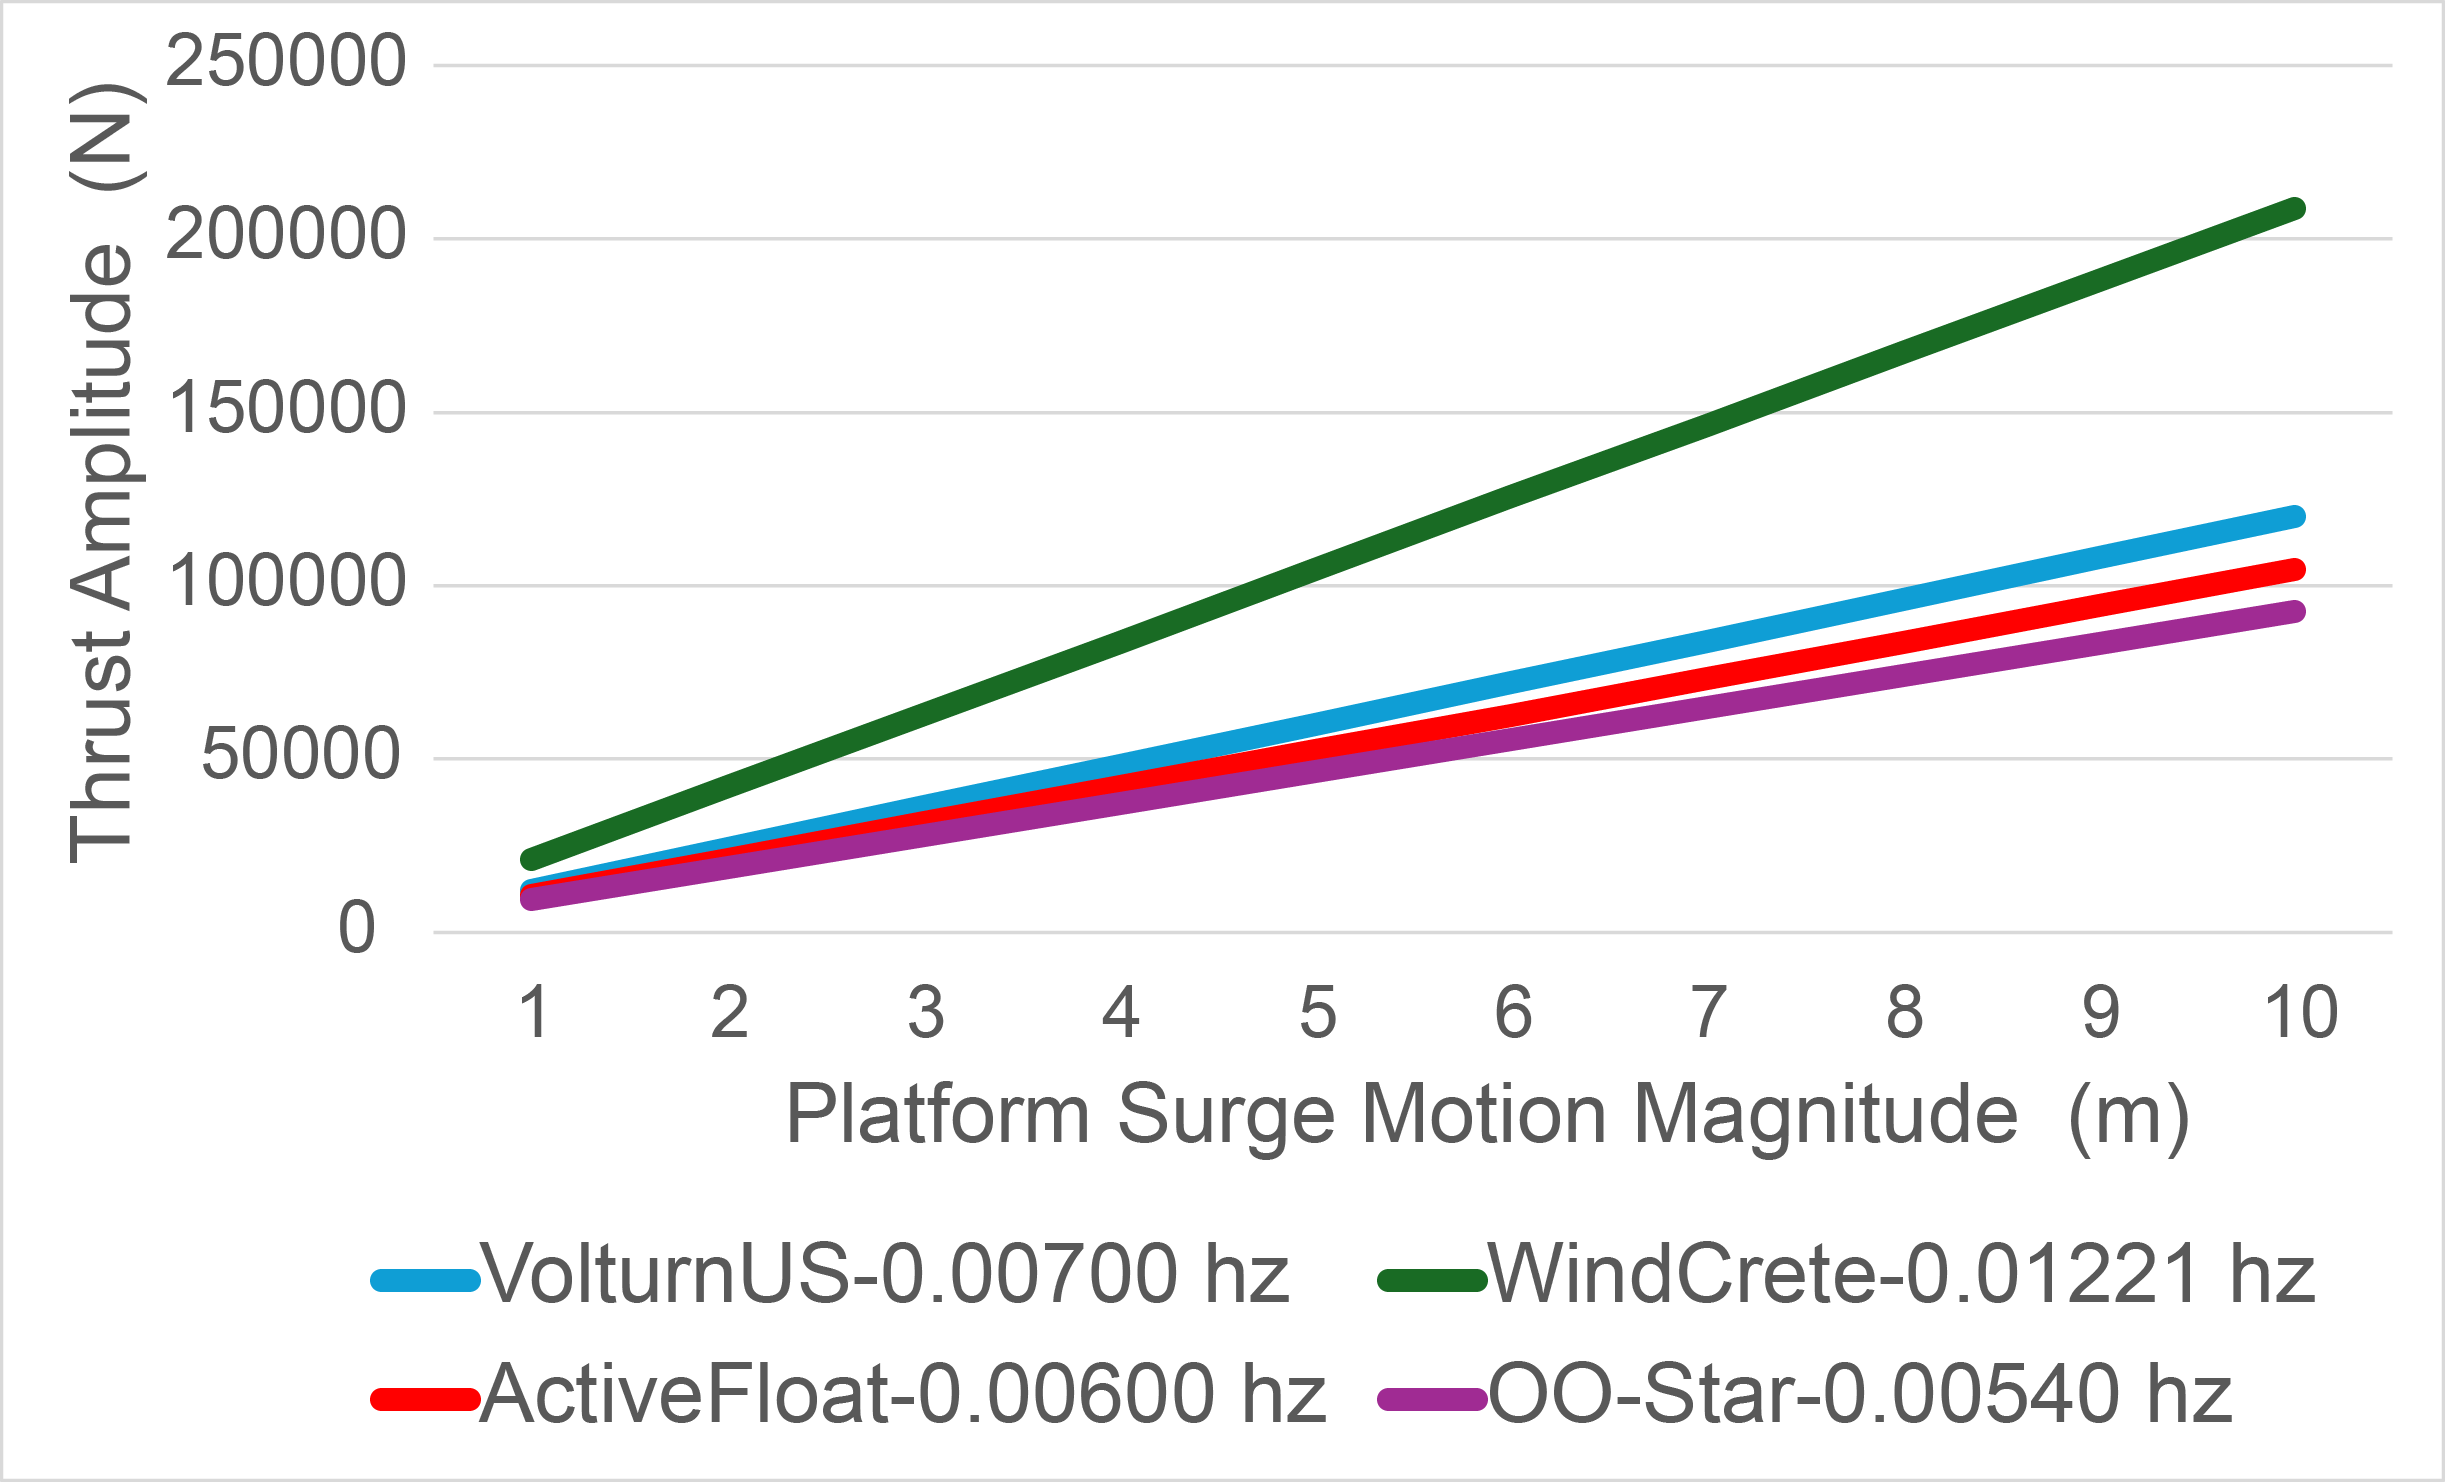
Table 1 compared the offshore wind turbine platform concepts: VolturnUS, WindCrete, ActiveFloat, and OO-Star, across four performance metrics, providing a concise summary of each design’s performance under increasing platform surge motion. “Rank 1” indicated the most favorable performance for each metric, whereas “Rank 4” represented the least favorable. WindCrete consistently achieved the highest power output (Figure 2); however, it also experienced the greatest fluctuations in both power and thrust (Figures 3 and 5) and exhibited the most significant decline in average thrust (Figure 4). In contrast, OO-Star demonstrated the lowest fluctuations in load (Figures 3 and 5) and maintained a steadier average thrust (Figure 4), though it produced lower overall power (Figure 2). VolturnUS and ActiveFloat typically showed moderate performance, balancing power gains with manageable load variations similar to those observed in OO-Star.
| Table 1. Summary of offshore wind turbine platform performance rankings | |||||
| Figure # | Description | Rank 1 | Rank 2 | Rank 3 | Rank 4 |
| 2 | Average Power | WindCrete | Volturn-US | Active-Float | OO-Star |
| 3 | Power Amplitude | OO-Star | Volturn-US | Active-Float | WindCrete |
| 4 | Average Thrust | OO-Star | Active-Float | Volturn-US | WindCrete |
| 5 | Thrust Amplitude | OO-Star | Active-Float | Volturn-US | WindCrete |
DISCUSSION.
The results support the hypothesis that platform stability, as measured by natural motion frequency, significantly affects turbine performance. WindCrete, characterized by the highest natural motion frequency, achieved the greatest power output, validating its efficiency in energy capture. However, the high variability in its power and thrust amplitudes suggests increased mechanical stress, potentially challenging long-term stability and operational reliability in high-motion environments. Platforms such as OO-Star, VolturnUS, and ActiveFloat demonstrated balanced performance with moderate increases in power and thrust amplitudes. Their consistent stability across varying motion magnitudes makes them suitable for environments with moderate wave activity.
According to the research paper “Cost Analysis and Design Optimization for Floating Offshore Wind Platforms” [5], cost estimates for semi-submersible turbine platforms are approximately 74% higher than those for spar-buoy platforms. In this study, WindCrete falls under the spar-buoy platform type, whereas OO-Star, VolturnUS, and ActiveFloat are classified as semi-submersible platforms. Comparing the total costs of turbine installation and operational expenses against revenue generated from electricity production can help determine the optimal offshore floating wind turbine platform. The installation of floating offshore platforms and wind turbines is a capital-intensive process, typically ranging from $20 million to $40 million USD. The BEM conceptual model used in this research serves as a robust tool for simulating power output under varying hydrodynamic conditions.
CONCLUSION.
This study confirms the hypothesis stated and demonstrates the critical relationship between platform motion and the aerodynamic performance of floating offshore wind turbines. WindCrete’s ability to maximize power output under increased motion magnitudes underscores its potential for high-energy environments. VolturnUS, ActiveFloat and OO-Star offer balanced performance for moderate conditions and their consistent stability highlights their suitability for environments prioritizing minimal mechanical stress.
This research focused on the impact of Surge motion only on offshore platforms. However floating offshore platforms experience six degrees of freedom of motion responses – Surge, Roll, Sway, Pitch, Heave, Yaw. Surge, Pitch and Heave are usually present at the same time [2]. Future research directions include consideration of these three forces and use of a complex computational model to simulate turbine performance and power output. These advancements will contribute to the development of efficient, stable, and sustainable offshore wind energy systems.
ACKNOWLEDGMENTS.
I extend my gratitude to my parents for their unwavering support and encouragement throughout this research. I would like to thank my research mentor, Jackson Hardin, at the University of Oxford, for his invaluable guidance and insights.
SUPPORTING INFORMATION.
The supporting information document includes:
- Python Computer Program created for Simulation of data to compute Turbine Performance (Turbine Power Output and Thrust)
- Computer Simulated data output for Turbine Performance used in analysis.
- Table S1. Computer Simulated data of Turbine Performance used in analysis – Average Power
- Table S2. Computer Simulated data of Turbine Performance used in analysis – Power Amplitude
- Table S3. Computer Simulated data of Turbine Performance used in analysis – Average Thrust
- Table S4. Computer Simulated data of Turbine Performance used in analysis – Thrust Amplitude
REFERENCES.
- T. M. Letcher, Wind Energy, vol. 2 of Comprehensive Renewable Energy (Elsevier, ed. 2, 2022), pp. 172-193.
- W. Musial, B. Ram, Large-Scale Offshore Wind Power in the United States (2010). https://www.nrel.gov/docs/fy10osti/49229.pdf
- M. M. Amiri, Aerodynamic Evaluation of Wind Turbines: BEM vs. FVW vs. CFD (2024). https://www. youtube.com/watch?v=HZdds40Ry5E
- T. Tran, D. Kim, The platform pitching motion of floating offshore wind turbine (2015). Journal of Wind Engineering and Industrial Aerodynamics 142, 65-81 (2015).
- L. Oberti, Cost Analysis and Design Optimization for Floating Offshore Wind Platforms (2022). https://webthesis.biblio.polito.it/22146/1/tesi.pdf
- National Renewable Energy Laboratory Data Files for Airfoil Available from:https://github.com/IEAWindSystems/IEA-15-240-RWT/tree/master/OpenFAST/IEA-15-240-RWT/Airfoils
Posted by buchanle on Wednesday, June 25, 2025 in May 2025.
Tags: Blade element momentum theory, Floating wind turbines, Offshore wind energy optimization, Platform motion

