The Effects of Vegetation and Depth on the Soil Geochemistry Above Titan Cave in Wyoming
ABSTRACT
The chemistry of soil contains important information about the climate. Different climate conditions, such as temperature and moisture content, alter the chemistry of the soil, giving it a unique signature. Water from rain dissolves and carries this climate signature into a cave where it is stored in stalagmites over hundreds of thousands of years. This study examines how soil chemistry changes under different conditions, focusing on vegetation at various soil depths above Titan Cave in northern Wyoming. Titan Cave developed in the Madison Limestone underneath a landscape characterized by sagebrush steppe with native grasses and intermittent groups of juniper trees. Soil core samples were taken from two sites, one surrounded by juniper trees and another characterized by native grasses. Samples were collected approximately every 8 centimeters. Exchangeable cations were leached and analyzed using an iCapQ quadrupole mass spectrometer. Additionally, soil temperature and water content were continuously logged in each vegetation type for one year. Soil gas samples were collected from both sites and analyzed for radiocarbon and stable carbon isotopes. The findings reveal that the juniper site exhibits greater chemical variation and lower water content than the grass site. This difference is likely attributable to the juniper trees’ absorption of water and nutrients and the deposition of organic matter into the soil, leading to reduced water content and increased chemical variability relative to the grass site. Understanding how vegetation affects soil chemistry today can help to improve the accuracy of paleoclimate analysis leading to more accurate reconstructions of past climate. This can lead to a better understanding of the past ecosystem around caves and ultimately allow us to create better climate models for the future.
INTRODUCTION.
In the current age, improving climate models is increasingly important, especially considering the global impact of climate change, such as shifts in precipitation patterns, extreme weather events, and ecosystem disruptions. Accurate climate models are essential for predicting these changes and implementing effective strategies to mitigate damage. One crucial method for improving climate models is the reconstruction of past climate conditions through natural archives, such as stalagmites.
Stalagmites have been shown to be reliable paleoclimate proxies due to their ability to contain detailed climate records over thousands of years [1]. Climate affects the soil chemistry, which is recorded in stalagmites [2]. As water flows through the ground, it dissolves trace elements from the soil and limestone. That water, containing the elements from the soil, percolates into the cave below where it also dissolves calcium carbonate as it travels over the cave rock. When the water drips into the cave, the calcium carbonate can precipitate back out of the water. This process of calcium carbonate precipitation slowly creates speleothems: stalactites on the cave ceiling and stalagmites that build up from the cave floor. During speleothem formation, the trace elements from the water are included in the calcium carbonate precipitate, changing the chemical composition of the stalagmite and contributing to a chemical record that includes information about the soil composition above the formation at that specific point in time. Long after that soil is gone, the record of its chemistry is preserved within the stalagmite. For example, the ratio of heavy 18O to light 16O in the stalagmite can reveal changes in past surface air temperature or rainfall sources [3]. Similarly, ratios of specific elements (Mg/Ca and Sr/Ca) can indicate the amount of rainfall [4]. Additionally, since the water leaches trace elements from the surrounding limestone as it enters the cave, the growth history of stalagmites can be dated using radioactive isotopes of uranium and thorium [4]. Researchers can, therefore, reconstruct the climate of the past by analyzing several aspects of the stalagmite’s chemistry to infer information about past rainfall, temperature, and soil chemistry.
While climate changes affect soil chemistry, other characteristics of the environment can also impact the specific chemistry of soil at a particular time and place. It has been shown that different vegetation types, for example, alter the chemistry of the soil [4]. Identifying how variables, such as vegetation, affect soil chemistry will allow for a better understanding of how to differentiate what parts of soil chemistry are caused by climate conditions and what is caused by other factors in the environment. This clarification will allow for a better understanding of the climate signature within a stalagmite, which can lead to more accurate data related to the climate of the past.
This research investigates the influence of depth and plant species on the soil geochemistry above Titan Cave in northern Wyoming. Understanding the chemical composition of the surface soil can give information about how the stalagmite chemical signature changes between the surface and the cave, which allows for a more accurate analysis of paleoclimate records. All samples were collected above Titan Cave located in the Bighorn River basin in northern Wyoming, overseen by the Bureau of Land Management (BLM). This environment was the optimal location not only because it is over a cave, but also because it is protected land not affected by human activity. The BLM is planning a controlled burn above the cave for November to manage the population of juniper trees. With this scheduled controlled burn, this research can be expanded by examining how fire affects soil geochemistry. This information could then be used with additional stalagmite chemical data to determine how to identify past fires in stalagmite geochemistry. A better understanding of past climates could be very useful for improving current climate models, leading to a possible improvement in long-term climate predictions.
It was hypothesized that the juniper site would have a higher chemical variation than the grass site. Because juniper trees have much more expansive and deep roots, it was expected that the nutrients being taken from the soil and plant biomass being deposited in the soil would create soil with higher variability compared to the short roots of the sparse grasses.
MATERIALS AND METHODS.
All soil samples were collected from two sites above Titan Cave using a bucket auger during the summer of 2023 (Fig. S1 and S2). The first site was in a grass-filled open area where six samples were collected at depths ranging between 0 and 54.6 cm (Fig. S1). The second site was situated within a group of juniper trees a short distance from the grass site. Eleven soil samples were collected from this site with depths between 0 and 102.9 cm. The depth of each site was dependent on the presence of large rocks and roots encountered during sampling. In the summer of 2023, temperature and water content sensors were placed at both sites and recorded data thrice daily for a year. The data points were then downloaded for analysis (Fig. S3).
To determine trace element concentration in the soil samples, a leachate solution was created and analyzed using a Thermo Finnigan iCapQ mass spectrometer. Based on the carbonate bedrock at Titan Cave, Na, Ca, and Mg were expected to be present at higher concentrations, and elements such as Si, P, S, Mn, Cu, and Zn were expected to be present at lower concentrations. Two dilutions, for the low-concentration ions and the high-concentration ions, were created. Standards were prepared using Inorganic Ventures (Christiansburg, VA) solutions. The standards and unknown solutions were mixed online with the internal standard (IV-71D). IV-STOCK-10 was run as an unknown during each analysis period.
Soil gas samples were collected from two depths at each site in October of 2023 and in June of 2024. The juniper site had gas sample sites at depths of 46 cm and 91.5 cm, while the grass site had gas sampling sites at 25 cm and 50 cm. Sampling sites were created in June of 2023 using the holes created for soil sampling. The soil gas wells were constructed by adding 5 cm of bentonite above and below a 5 cm layer of sand with the stainless-steel tubing capped with stainless steel mesh in the middle of the layer. The bentonite layers prevent the flow of gasses, while the sand allows the gas to flow freely, allowing for similar depths. Extra space between the two sites was backfilled with soil.
Radiocarbon samples were collected in 5 L Cali-5-bond bags using a handheld pump. The samples were then shipped to the University of Bern, Switzerland, for analysis. For stable carbon data, approximately 3 ml of soil gas was injected into a 12 ml helium-flushed rubber septum-capped Labco Exetainer vial onsite after purging the approximate well volume using a 50 ml luerlock syringe. Radiocarbon and stable carbon samples were analyzed as outlined by Druhan et al., 2021 [5].
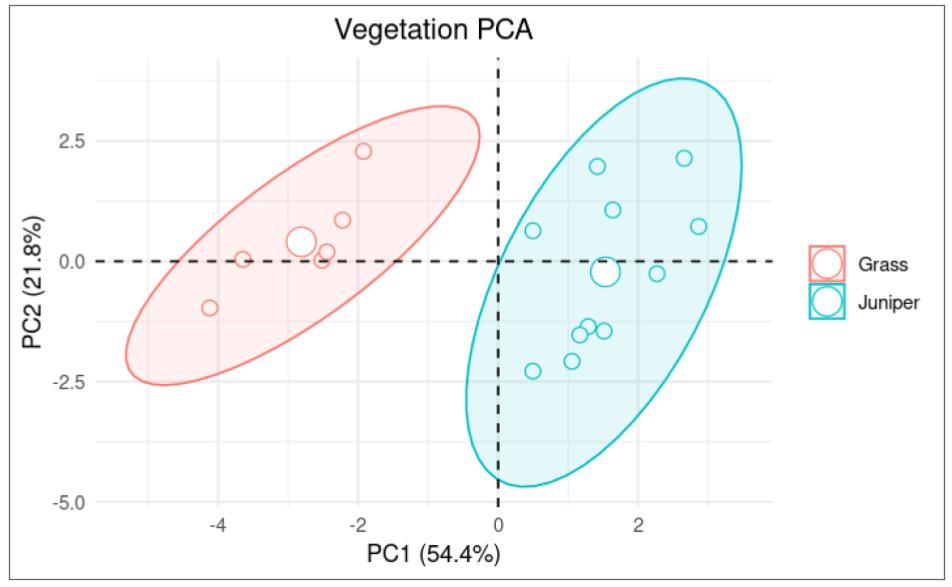
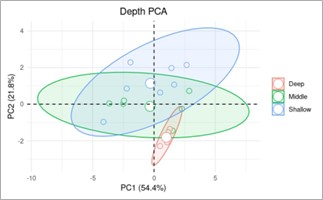
To better understand how variables such as vegetation and depth cause changes in the soil, two Principal Component Analysis (PCA) graphs were created using the PCA function in RStudio. The same data set was input for both graphs, each highlighting different data characteristics, with one identifying the vegetation type (Fig. 3) and the other identifying sample depth (Fig. 4). Due to the limited depth for the grass site, data points identified as deep in the second PCA all come from the juniper site.
RESULTS.
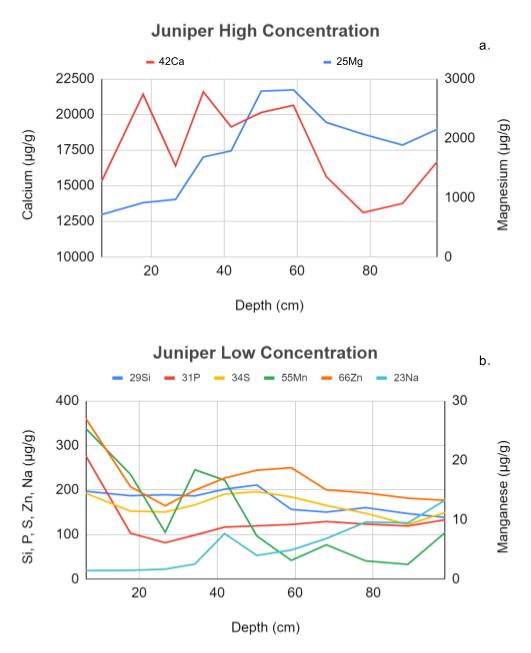
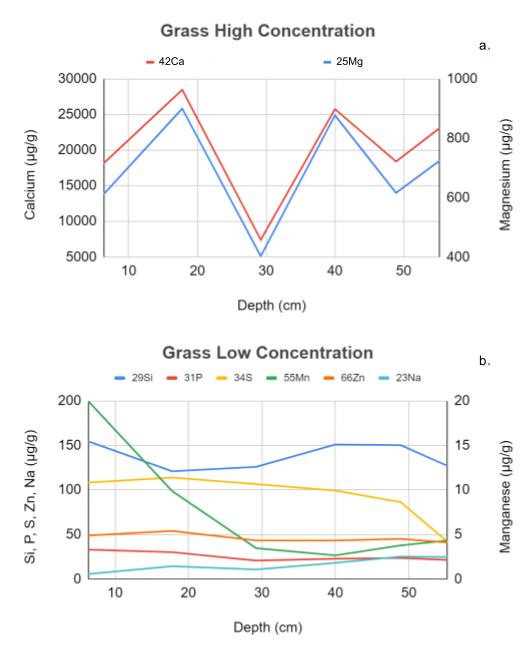
The trace element concentrations at the juniper collection site (Fig. 1) show interesting differences compared to the grass collection site (Fig. 2) as a function of soil depth. Concentrations of Mg and Ca, which are present in the soil at high concentrations, are shown in panel a (Fig. 1 and 2), while concentrations of Si, P, S, Mn, Zn, and Na, which are present in lower concentrations and must therefore be analyzed in separate mass spectrophotometry runs, are shown in panel b (Fig. 1 and 2). The data in these graphs was obtained from mass spectrometer concentration data converted from parts per million (ppm) to micrograms per gram of soil (µg/g). This figure shows that the juniper high-concentration samples (Fig. 1a) vary much more than those in the grass site (Fig. 2a) which stay at a consistent ratio for all depths. Similarly, the low concentration from the grass site (Fig. 2b) is very consistent with no large amounts of variation, unlike the juniper low concentration samples (Fig. 1b), which have many inconsistent dips and peaks in the graph, indicating much more variability in concentration with depth.


Seasonal changes in soil temperature and water content were plotted as a function of time over a year-long period (Fig. S4). Between the summer of 2023 and the summer of 2024, the soil temperature changed with the seasons in similar ways between sites, as expected, with the soil temperature at the grass site remaining slightly higher than the soil temperature at the juniper site. During warmer months, differences in water content of the soil at each site also showed similar results, with the grass site having slightly higher water content. At colder temperatures, however, the water content of the soil from the grass site was more variable than in the colder months and showed increases in water content relative to the soil from the juniper site.
Principal Component analyses (PCA) were used to further assess differences in soil chemistry at grass and juniper sites using cation concentration data. Two separate PCA plots show the patterns of variation in soil chemistry based on the vegetation (Fig. 3) and soil depth (Fig. 4). The PCA analysis reveals two principal components that together account for over 86% of the variability, with PC1 accounting for 54.4% of the variance and PC2 accounting for 21.8% of the variance. In the vegetation-based PCA plot, there is a clear separation between the soil samples from the grass site and the juniper site, with samples from the grass site tending to be in the negative range and the juniper site in the positive range of the PC1. The ellipse around the juniper sites is larger than around the grass sites, indicating more variability in the soil samples at the juniper site. The depth-based PCA plot shows variation in soil chemistry based on differences in the soil depth (categorized as shallow, middle, or deep). For samples that were negative for PC1, there was nearly a complete overlap in the ellipses for each soil depth, indicating no correlation with PC2 at the negative PC1 values. For samples with a positive PC2, however, there seems to be a correlation between soil depth and PC2. Specifically, PC2 values decrease as soil depth increases. It is important to note that no samples were in the deep category at the grass sample site.


To examine the availability of cations in the soil at varying depths, cation exchange capacity (CEC) was analyzed (Fig. S5). The CEC measures how many cations a soil can hold and is an indicator of the health of the soil. One noticeable difference between the two sites is that the grass site has much more variation than the juniper site between the depths of around 5 to 15 inches.
Gas data from October of 2023 and June of 2024 were also obtained (Table S6). The ratio of stable carbon isotopes (δ13C in ‰) has similar values for grass and juniper sites at both dates and depths. Values were around -18, with the data decreasing between depths for both sites in June and increasing between depths for both sites in October. Juniper 14C age in June of 2024 showed much younger samples with depth negatively correlated with age. As for the grass site, the age was much larger, and there was a positive correlation between age and depth at this site. Finally, CO2 concentration was much higher for the juniper site than the grass site, with both sites increasing with depth.
DISCUSSION.
Components of climate, such as moisture and temperature, alter the chemical composition of the soil. When the soil is above a cave, these chemical signatures within the soil can be carried to and recorded in speleothems. Those chemical signatures, stored for hundreds of thousands of years, can then be used to recreate the soil chemistry and thus infer information about past climate. Soil chemistry, however, is affected by other variables in the environment. Understanding the relationship between those variables and the chemistry of the soil is essential to accurately understand past climate. This study analyzed the impact of vegetation and sample depth on soil chemistry above a cave.
Surface soil data from both sites indicate that the juniper site has more chemical variation than the grass site. This can be seen in the graphs of the high-concentration elements where, at the juniper site (Fig. 4a), there does not appear to be any correlation between the calcium and magnesium levels, while in the grass site (Fig. 4b), calcium and magnesium follow a nearly identical concentration path as depth increases. Similarly, the graphs of low-concentration elements show that in samples from the juniper site (Fig. 4c) element concentrations are very inconsistent as depth increases with many dips and peaks, while the grass site (Fig. 4d) has very smooth and uniform lines revealing very consistent changes in concentration as depth increases. This indicates that the juniper site has more variation in different elements than the grass site.
The PCA graph in Figure 6 reinforces this conclusion because the parabola containing the grass points does not intersect with the juniper parabola at any point. This indicates that the two sites have significantly different chemistry at all depths, even though the grass and juniper sites were nearby.
Interestingly, the second PCA graph (Fig. 7), which presents data in three different depth ranges, might indicate a relationship between higher values of PC2 and shallower depths for the juniper site but not the grass site. Figures 6 and 7 use the same data, simply examining them from the perspective of the type of vegetation or soil depth, respectively. The parabolas that indicate the various soil depths in Figure 7 (shallow, medium, and deep) converge for negative values of PC1 and separate at more positive PC1 values. In Figure 6, the parabola that indicates grass data points shows that all the grass samples have negative PC1 values while all juniper samples have positive PC1 values. Relating this information to Figure 7 could indicate a relationship between smaller PC2 values and deeper soil samples for the juniper site but not the grass site. This could provide additional evidence that the chemistry of the juniper site varies much more than the grass site as depth increases because PC2 varies as depth increases for the juniper site but not the grass site.
Water content and temperature data presented in Figure 5 conform to expectations about grass and juniper plants, respectively. First, as the temperature changes over one year, both grass and juniper sites remain at similar values with the grass site having a slightly larger value than the juniper site at most times. Secondly, the water content of the juniper site is always lower than the water content of the grass site. These results meet expectations because since the sites are so close to each other, they should have almost identical temperatures. The slightly higher temperature in the grass site is likely due to the larger juniper trees providing shade, lowering the temperature of the juniper site. Additionally, the water content of the juniper site is expected to be lower than the water content of the grass because the large juniper trees take in much more water than the sparse native grasses.
The Cation Exchange Capacity (Fig. 8) shows that both grass and juniper sites have similar average values, with the largest variation in the grass site between 13-44 centimeters. This similarity in values is expected for both sites since they are near each other. One possible reason for the sudden drop in the grass site between 23 and 36 centimeters could be due to organic matter only influencing depths between the surface and 23 cm and clay only influencing the cation exchange capacity at values lower than 36cm.
This research could be improved by collecting data from a larger number of grass and juniper sites and increasing the depth of the grass site to match the depth of the juniper site. This would allow for a larger amount of data to increase the certainty of the conclusions. Similarly, increasing the depth of the grass site would allow for a more complete comparison between the juniper and grass sites.
Gas sample data (Table S6) provides logical evidence for differences between the two sites at both depths. The δ13C in ‰ shows similar values for all data at around -18. The reversed relationship for both sites between the two dates could be caused by the data being recorded at the end of the growing season in October 2023 and the start of the growing season in June 2024. While this could be the case, more research is necessary to test this claim. The reason the 14C age is so negative for the juniper site with younger samples at the lower depth is likely because the roots of the juniper are cycling young gas through the soil, causing the solid gas to look younger. Additionally, since the tree roots reach deeper in the soil than the shallow gas sample, then it is logical to discover that the deeper gas samples are younger than the shallower ones. Similarly, for the grass site, since the sparse grasses are not cycling very much younger-looking gas through the soil and the gas that is cycled is at a shallower depth, we see an older gas age that increases as depth increases. Finally, the reason the CO2 concentration is higher for the juniper site, with both sites increasing with the depth, is that the juniper trees are taking more CO2 than the grass site leading to having less than the juniper site. Similarly, since the juniper roots are deeper in the ground than the shallow sample, the increase in depth for both sites could be caused by the juniper roots losing CO2 at depths closer to the deep sample site.
FUTURE DIRECTIONS.
This research is part of a larger project examining the chemical signatures of fires in a karst environment. A controlled burn over Titan Cave, scheduled between fall 2024 and spring 2025, will allow for an investigation into how forest fires affect the geochemistry above the cave. My research contributes to this goal by gathering preliminary information on how fire affects the soil chemistry of different vegetation types as depth increases. The goal of the larger research project is to enhance our understanding of how surface fires chemically alter stalagmites. If successful, this data could provide crucial information on the chemical signal of a large fire in the chemistry of a stalagmite and could potentially identify major fires that occurred hundreds of thousands of years ago. Ultimately, this research could be used to improve reconstructions of past climate leading to more accurate climate data to train climate models.
Understanding the timing of past fires can be highly valuable for reconstructing historical climate conditions [3]. This knowledge can, in turn, enhance the accuracy of current climate models, leading to better predictions for weather, which is critical for our ability to make important decisions to combat the worsening effects of climate change.
ACKNOWLEDGMENTS.
Thank you to Dr. Oster, Bryce Belanger, Aida Zyba, and Dr. Stanton for assisting me every step of the way. None of this would have been possible if not for your generosity and kindness.
SUPORTING INFORMATION.
The supporting information document includes:
- Detailed Leachate Solution Methodology
- Figure S1: Map of sample site
- Figure S2: Soil Core Sample collection
- Figure S3: Temperature and moisture logger
- Figure S4: Temperature and moisture graph
- Figure S5: Cation exchange capacity graph
- Table S1: Carbon analysis data
REFERENCES
- C. L. Smith, A. Baker, I. J. Fairchild, S. Frisia, A. Bosato, Reconstructing hemispheric-scale climates from multiple stalagmite records. International Journal of Climatology 26, 1417-1424 (2006).
- Y. M. Huang, I. J. Fairchild, A. Borsato, S. Frisia, N. J. Cassidy, F. McDermott, C. J. Hawkesworth, Seasonal variations in Sr, Mg and P in modern speleothems. Chemical Geology 175, 429-448 (2001).
- F. Bian, K. Coleborn, I. Flemons, A, Baker, P. C. Treble, C. E. Hughes, A. Baker, M. S. Anderson, M. G. Tazer, W. Duan, C. J. Fogwill, I. J. Fairchild, Hydrological and geochemical responses of fire in a shallow cave system. Science of The Total Environment 662, 180-191 (2019).
- M. Campbell, L. McDonough, P. C. Treble, A. Baker, N. Kosarac, K. Coleborn, P. M. Wynn, A. K. Schmitt, A review of speleothems as archives for paleofire proxies, with Australian case studies. Reviews of Geophysics 61 (2023).
- J. L. Druhan, C. R. Lawrence, A. K. Covey, M. G. Giannetta, and J. L. Oster, A reactive transport approach to modeling cave seepage water chemistry i: Carbon isotope transformations, Geochimica et CosmochimicaActa 311, 374-400 (2021).
Posted by buchanle on Wednesday, June 25, 2025 in May 2025.
Tags: Cave, Paleoclimate, Soil, Vegetation

