ATP6/8 GC Content as a Potential Indicator of Endangerment Risk
ABSTRACT
ATP synthase correlates with the endangerment of species from a genetic standpoint. This is simply due to the fact that ATP synthase, especially the F0 subunit, produces ATP, which is vital for living things to produce energy by allowing proton transport through the membrane. To quantify the observational hypothesis, a program called R was used to calculate GC content, the amount of guanine and cytosine nucleotides divided by the total amount of nucleotides, of ATP synthase F0 subunit 6 (ATP6) and ATP synthase F0 subunit 8 (ATP8) to test it against the null hypothesis. This paper attempts to prove that there is a correlation between the GC Content of ATP synthases and the IUCN Red List categories, which labels species by how endangered they are. 11,978 samples were used, which consisted of samples from each ATP synthase genome and by animal group, which are the Ave class, Mammalia class, and the Pisces paraphyletic group. Results showed that the GC content of the ATP synthase genes used relates to the Vulnerable and Endangered categories. Therefore, it may be possible to be aware of the genetic risk of endangerment by looking at the GC content of ATP6 and ATP8.
INTRODUCTION.
ATP synthase synthesizes ATP by combining ADP and an inorganic phosphate [1]. ATP is used for energy in biologic processes including ion transport, chemical synthesis, phosphorylation, muscle contraction, and nerve impulse [2]. The ATP’s supramolecular assembly is known to affect metabolism, organellar structure, diseases, and aging [3]. Due to the crucial effects ATP synthase has, Uddin et al. compared the GC contents of ATP synthase F0 subunit 6 (ATP6) and ATP synthase F0 subunit 8 (ATP8) in fish, birds, and mammals. ATP synthase F0 subunits describe the part on ATP synthase that heavily affects ATP, or energy, production. GC content is a highly variable trait [4]. It is the percentage of guanine and cytosine relative to the overall length of the gene. It is used to measure the composition of nucleotides because it is more stable than adenine or thymine nucleotides [4]. Their research team found out that birds had the highest GC content in both ATP6 and ATP8, followed by fish, and then mammals [5].The percentages listed by IUCN Red List of Endangered species are: 12% of bird species, 22% of fish species (excluding the data deficient category), and 26% of mammals are endangered [6,7]. Therefore, it can be hypothesized that higher GC content, which is the amount of guanine and cytosine relative to the other nucleotides, in ATP6 and ATP8 correlates to the survivability and endangerment risk for the species.
A case study shows that humans have about 44.2% GC content in ATP6 (NC_012920.1), and 39.6% GC Content in ATP8 (NC_012920.1), with an average of 41.9%. This surpasses the mammal average of 39.41% and 34.19% respectively, with an average of 36.80% [5,8]. On the other hand, macaroni penguins (a vulnerable species) have a 40.1% GC content in ATP6 (NC_054275.1), 42.8% GC content in ATP8 (NC_054275.1), with an average of 41.45%. Not only is this value lower than the average bird’s GC content (approx. 45.10%) in both ATP6 (46.65%) and ATP8 (44.16%), but it is also lower than the average human [5,8].
Therefore, this further solidifies the possibility of this hypothesis being true. This is because it tends to be a downward decline in GC content the more vulnerable it is relative to other controlled groups.
MATERIALS AND METHODS.
Datasets Used.
The IUCN Red List Categories used will come from the IUCN database, and the data for the nucleotides of the ATP6 and ATP8 genes comes from the NCBI database [8,9].
Methodology.
Using R code, a total of 11978 samples are taken from each gene (ATP6 and ATP8) and each animal group (Aves, Pisces, and Mammalia). Incompatible data was removed to total (enter exact number of samples). Once the genes are concatenated with the species’ IUCN Red List category, the code calculated the mean, median, IQR (interquartile range), and 2SD (two standard deviations). Then, if the Anderson-Darling Normality test indicates there is a normal distribution, then an ANOVA test, which compares means, will be used to determine the probability. Otherwise, a Kruskal-Wallis test, which compares medians, will be conducted to determine whether the results are statistically significant.
RESULTS.
| Table 1. Properties of Each IUCN Red List Category Relative to GC Content of ATP6 and ATP8 | |||||
| N | μ | Median | IQR | SD | |
| CR | 141 | 44.3 | 45.1 | 4.72 | 3.58 |
| DD | 3950 | 43.0 | 44.4 | 3.98 | 2.76 |
| EN | 322 | 41.8 | 38.8 | 6.74 | 3.66 |
| EX | 36 | 44.8 | 45.4 | 2.94 | 4.84 |
| EW | 2 | 44.4 | 44.4 | 0.00 | 0.00 |
| LC | 5686 | 43.9 | 44.6 | 3.54 | 3.61 |
| lc | 3 | 47.0 | 47.0 | 0.00 | 0.00 |
| NT | 358 | 44.7 | 45.4 | 3.22 | 3.50 |
| VU | 1490 | 41.5 | 40.3 | 0.26 | 2.52 |
Based on Table 1, there is a trend seen where the more endangered category has a lower GC content. This tends to be the case especially when the endangered and vulnerable samples are compared with the data deficient and least concern samples in the table in the median. However, the mean tends to be the same. However, the median is more likely to affect the sample since it is likely not a normal distribution, though an Anderson-Darling test later will tell for sure.
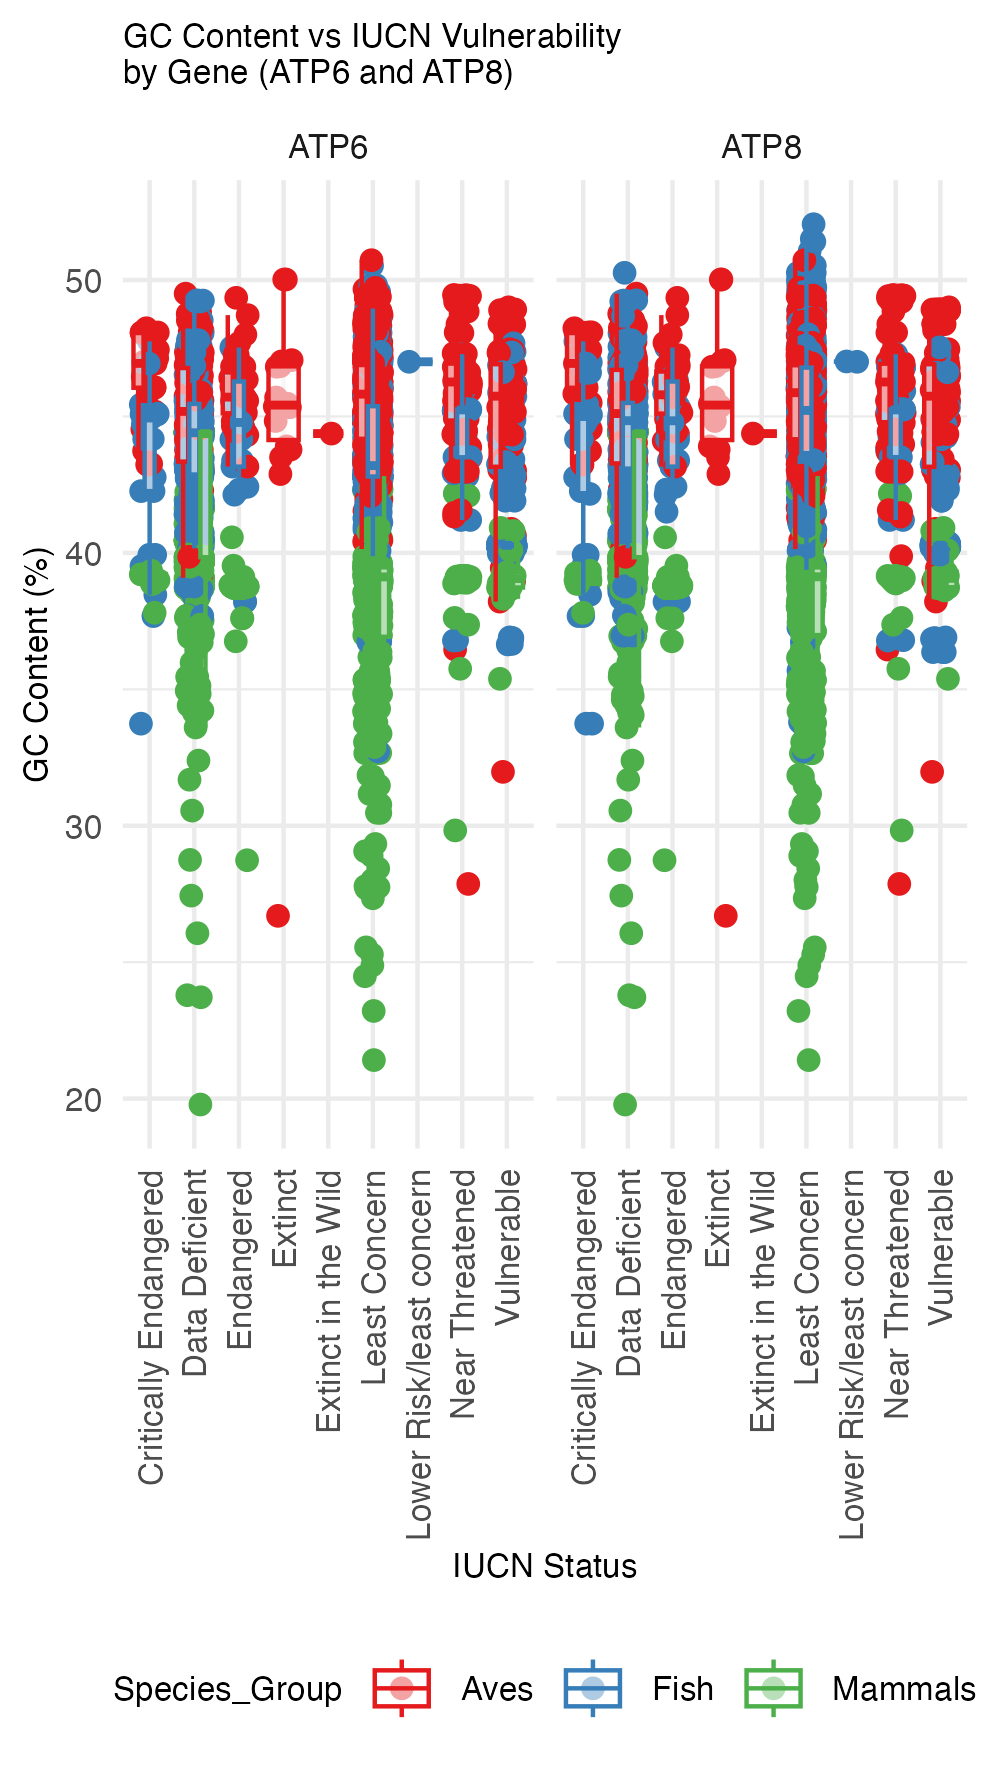
Across all categories in general, birds tend to have the highest GC content followed by fish and mammals according to Figure 1. The boxplots do not differ too much between the ATP6 and ATP8 samples. Therefore, it can be shown that one or the other may be enough to evaluate vulnerability using one gene’s GC content or the other.

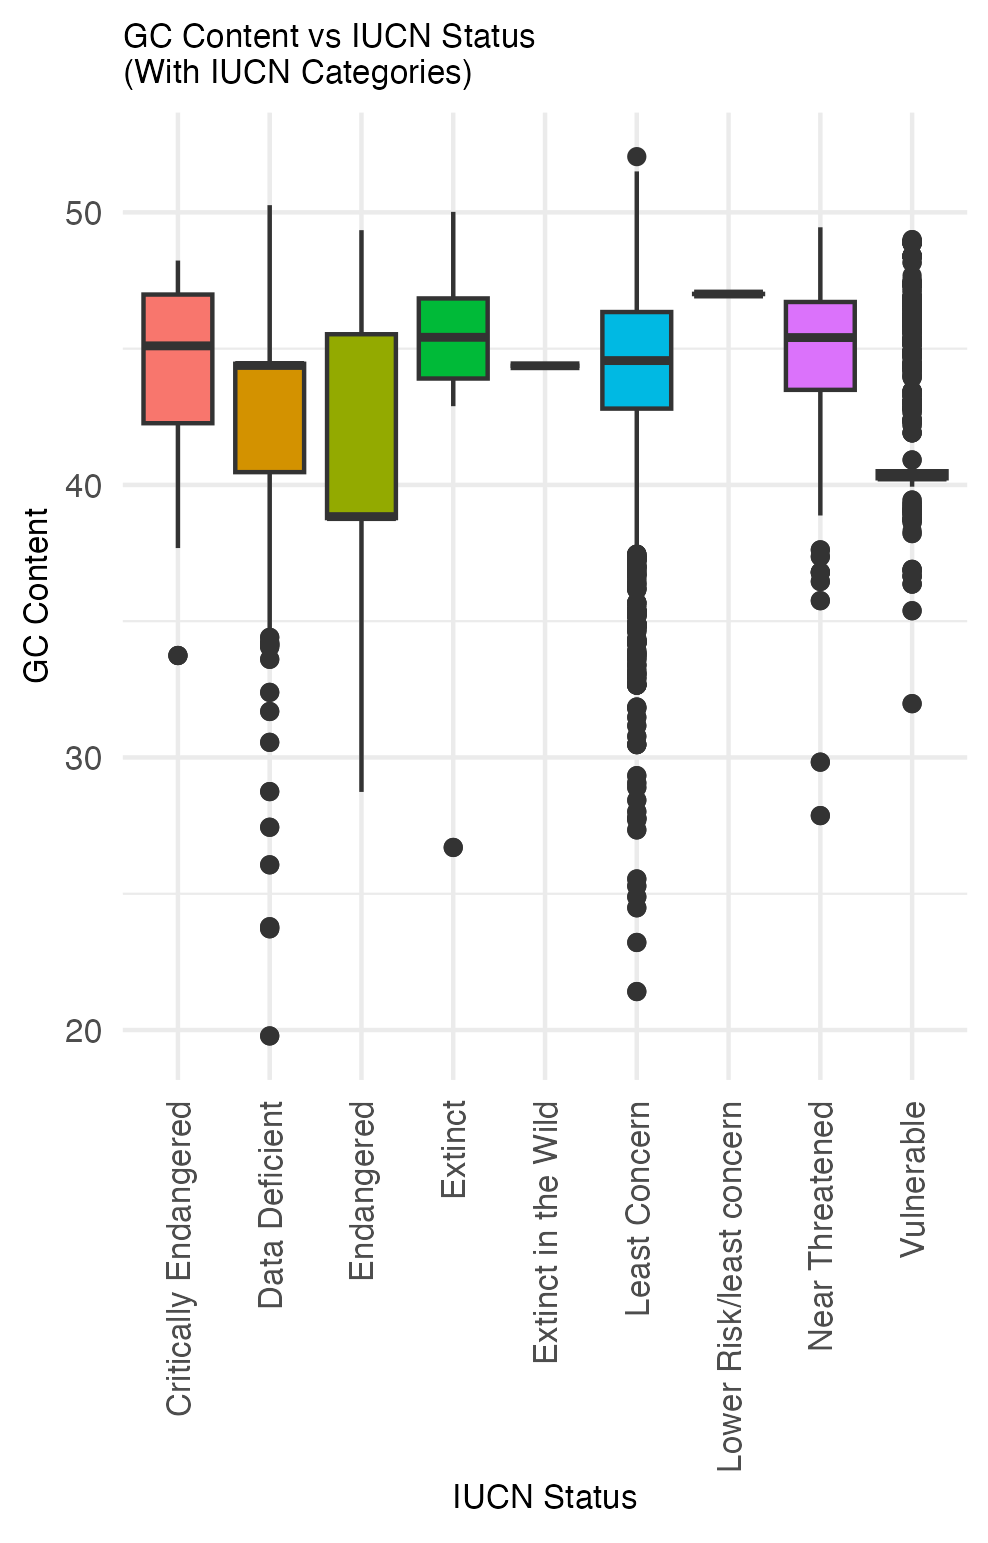
Based on Figure 2, at least 25% of data is concentrated around the median for the Vulnerable, Data Deficient, and Endangered IUCN categories (excluding those with small sample sizes).

The Anderson-Darling Normality Test showed that the Anderson-Darling statistic A = 144.55, was big. A high Anderson-Darling statistic results indicates that it is likely not from a distribution. In this case, the data is unlikely to be a normal distribution. This reflected in the p-value for the Anderson-Darling Normality Test, which showed that p < 2.2e-16. Therefore, the distribution is far from normal. Therefore, a Kruskal-Wallis Test was conducted.
The overall Kruskal-Wallis Test showed that χ²(8) = 1075.3, p < 2.2e-16. This means that after conducting the Kruskal-Wallis Test, the chi-squared value at df=8 is 1075.3, which reflects on the p-value of less than 2.2e-16, which is the lowest the program could calculate.
Out of the 36 possible combinations, the following pairs had combinations where p < 0.05 (see Table 2).
| Table 2. Statistically Significant Combinations | ||
| IUCN pair | Result | |
| CR | CE | 5.9e-11 |
| CE | EN | 3.8e-12 |
| CE | VU | 1.3e-14 |
| DD | EN | 1.2e-07 |
| DD | EX | 2.4e-06 |
| DD | LC | <2e-16 |
| DD | NT | <2e-16 |
| DD | VU | <2e-16 |
| EN | EX | 0.00012 |
| EN | LC | <2e-16 |
| EN | NT | <2e-16 |
| EN | VU | 0.00101 |
| EX | VU | 1.0e-10 |
| LC | NT | 0.00024 |
| LC | VU | <2e-16 |
| NT | VU | <2e-16 |
This means that out of 36 possible combinations possible by no overlap in IUCN combination pairs, 16 were statistically significant. Furthermore, relative to the most stable “Least Concern” population, the following categories are statistically significant (p < 0.05) to the initial hypothesis is important because it shows the data is significant enough to represent an accurate median. The results showed that the Data Deficient category had a median that is 0.2 lower than Least Concern (p < 2e-16), the Endangered category has a median that is 5.8 lower than Least Concern (p < 2e-16). Additionally, the Near Threatened has a median that is 0.8 higher than Least Concern (p = 0.00024), and the Vulnerable category has a median that is 4.3 lower than Least Concern (p < 2e-16).
DISCUSSION.
GC Content of ATP6 and ATP8 genes do relate to vulnerable and endangered species. Species that have under 42% GC content are considered concerning, under 40.5% is even more concerning, and under 39% is critical based on the data. Genomic awareness may help species survive better by coming up with ethical solutions to prevent the species from dying out from extreme environmental conditions. For instance, some ecosystems where the GC content of ATP-synthase is low may benefit from increased supply of the local plants there to prevent them from dying out due to a lack of energy available in the ecosystem.
Many species are endangered due to extreme environmental changes including anthropogenic destruction, soil erosion, deforestation, and overhunting. By utilizing the GC content of the ATP6 and ATP8 of a species, humanity can create restrictions regarding hunting species with low GC content in the ATP6 and ATP8 genes as well as set limits on farming and housing near these species’ ranges.
Furthermore, it could help to determine if the species currently labelled as Data Deficient in the IUCN is likely to be in the Least Concern, Vulnerable, or Endangered. Preliminary labels can be added based on current environmental data and compared to the typical GC content range for the species’ class to indicate whether it is more or less likely for a species to produce ATP from ATP synthase, which may lead to a higher risk of extinction due to the lack of ATP production.
In conclusion, the data in this research about the GC content of ATP6 and ATP8 genes graphed against the IUCN Red List category is useful for determining whether a species is at a higher genetic risk for being vulnerable to extreme changes and can be used as part of a preliminary indicator in determining if Data Deficient species are genetically at a higher risk of vulnerability than others.
ACKNOWLEDGMENTS.
I acknowledge Dr. Vardhini for helping me kickstart my research. I would also like to acknowledge my school and family for providing encouraging support.
REFERENCES.
1 Jonckheere A. I., Smeitink J. A. M., Rodenburg R. J. T., Mitochondrial ATP synthase: architecture, function and pathology. J. Inherit. Metab. Dis. 35, 211–225 (2011).
2 J. Dunn, M. H. Grider, Physiology, adenosine triphosphate (ATP), StatsPearls (2023); https://www.ncbi.nlm.nih.gov/books/NBK553175/ (accessed 16 Oct 2024).
3 H. Seelert, N. A. Dencher, ATP synthase superassemblies in animals and plants: Two or more are better. Biochim. Biophys. Acta Bioenerg. 1807, 1185–1197 (2011).
4 E.-Z. Hu, X.-R. Lan, Z.-L. Liu, J. Gao, D.-K. Niu, A positive correlation between GC content and growth temperature in prokaryotes. BMC Genomics 23, 110 (2022).
5 A. Uddin, T. H. Mazumder, P. A. Barbhuiya, S. Chakraborty, Similarities and dissimilarities of codon usage in mitochondrial ATP genes among fishes, aves, and mammals. IUBMB Life 72, 899–914 (2020).
6 IUCN, The IUCN Red List of Threatened Species (2024); https://www.iucnredlist.org/search?query=Fishes&searchType=species (accessed 16 Oct 2024).
7 IUCN, The IUCN Red List of Threatened Species (2024); https://www.iucnredlist.org/ (accessed 16 Oct 2024).
8 NCBI, Home – Nucleotide – NCBI (2024); https://www.ncbi.nlm.nih.gov/nuccore/ (accessed 16 Oct 2024).
Posted by buchanle on Tuesday, June 24, 2025 in May 2025.
Tags: ATPase, endangered, genetics, indicator, IUCN

