Quantifying Anti-Hemagglutinin Antibodies in Persons Living with Human Immunodeficiency Virus
ABSTRACT
The immune system defends against the influenza virus, a respiratory pathogen, mainly through the creation of antibodies and memory T cells. Human immunodeficiency virus (HIV) is an infection that targets CD4 T lymphocytes. To quantify and compare anti-hemagglutinin antibody production against the four influenza antigens utilized in the 2023-2024 flu vaccine, serum hemagglutination inhibition assays, from people living with (PLWH) and not living with HIV (CG), 0-, 7-, and 28-days post flu vaccination were performed. As HIV hinders the immune system, it was expected that PLWH undergoing antiretroviral therapy (ART) would have lower antibody titers compared to CG when vaccinated. Overall, there were no significant differences in antibody production between groups. When comparing responses between baseline and day 28 post-vaccination, both groups showed significant increases in antibody titers. When comparing fold changes between both groups, no significant differences were shown (H1N1: p=0.13, H3N2: p=0.39, B-Victoria: p=0.82, B-Yamagata: p=0.54). We conclude that PLWH on ART can mount antibody responses like CG after vaccination, contradicting the initial hypothesis, but demonstrating ART’s ability to control HIV infection allowing the immune system to mount responses against influenza.
INTRODUCTION.
Influenza virus causes a respiratory infection widely known as the “flu”, which affects an estimated 9.3 – 41 million people each year (2010-2023) in the United States (US) alone [1]. Influenza affects the respiratory system, causing symptoms such as fever, chills, and fatigue, though symptoms can vary from person to person [2]. The four strains included in the 2023-2024 vaccine were H1N1, H3N2, B-Victoria, and B-Yamagata. A protein on the surface of influenza, hemagglutinin, serves as the viral receptor binding to the sialic acid on the cell’s surface for infection [3]. Influenza typically recognizes the a-2,6 and a-2,3 sialic acid linkages for binding, which are expressed on respiratory epithelial cells and gut epithelial cells, respectively [4,5].
Antibodies are a defense mechanism used to help eliminate a virus infecting the body. To produce these antibodies, T cells, which include CD4 T cells, activate another type of immune cell called B cells. B cells secrete antibodies, which help eliminate viruses [6]. Prior immunity before infection can be established through the administration of vaccines. Vaccines stimulate the immune system to create memory cells containing information about a specific pathogen to prevent or contain a pathogen as much as possible [7]. When the vaccine is administered, a similar reaction occurs as when exposed to the live virus.
The process of fighting off infections is not consistent for all people. Some members of the community have a higher risk of complications when infected with influenza, such as people living with human immunodeficiency virus (HIV) [6]. Roughly 1.1 million people live with HIV in the US [8]. HIV infects and depletes CD4 T cells [8]. If the CD4 T cell response is hindered, then B cells do not receive the help needed to create antibodies or memory after vaccination, which is essential to protect against infection [9, 10].
This project aimed to compare vaccine responses between people living with HIV (PLWH) and people not living with HIV or control group (CG). We measured antibody titers before and after vaccination using a hemagglutination inhibition assay. PLWH had largely undetectable HIV viral loads as they were receiving antiretroviral therapy (ART) during this study. Antiretroviral therapy is a treatment for HIV that helps improve the patient’s CD4 T cell count [12]. This type of study is vital as it brings diversity to influenza research. Many health conditions affect susceptibility to infection; therefore, studying flu vaccine responses across diverse populations is essential.
MATERIALS AND METHODS.
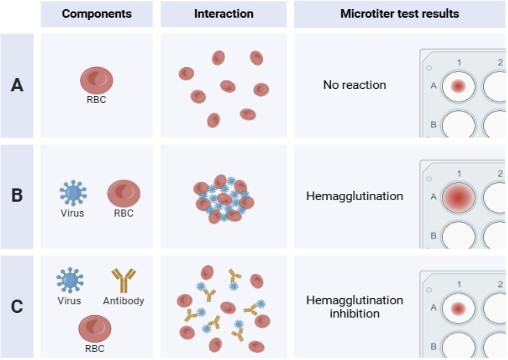
To test anti-hemagglutinin antibodies, a hemagglutination inhibition (HAI) assay was conducted. Hemagglutinin binds and cross-links red blood cells (RBCs), or hemagglutination. This assay measures the largest dilution of antibodies able to inhibit hemagglutination of RBCs. The antibodies are produced as an immune response when participants are given the flu vaccine. Differences in antibody titer before vaccination (visit 1), 7-days (visit 2) and 28-days (visit 3) post immunization were measured. The HAI protocol was replicated from a previous influenza study [13]. A liquid handling robot (Integra Biosciences) was used to make the two-fold serum dilutions (1:10, 1:20,1:40…1:2560).
Serum Collection and Processing.
Human–derived serum was collected and processed at Vanderbilt Medical Center in Nashville Tennessee. This research is supported by Internal Review Board protocol number 161647. Each research participant was seen for three visits: at day 0 (day of vaccination) and day 7 and 28 post vaccination. Blood samples were separated into serum, plasma, and peripheral blood mononuclear cells (PBMC). Only serum was used in this research. There was a total of 17 participants in both the PLWH group and the control group (CG). Only the participants in the PLWH group undergo ART treatment during the time of the blood sample collections. Prior to conducting the HAIs, there were a greater number of samples; however, some individuals had to be discarded from the study as not all participants had samples for the 3 visits.
Hemagglutination Inhibition Assay.
- Turkey RBCs and Treatment. Purified turkey RBCs (Lampire Biologics) were used in the HAI. Avian RBCs were used since they express a-2,3 and a-2,6 sialic acid, also expressed on the ciliated epithelium cells that influenza typically binds [14]. RBCs were washed to remove Elsevier’s solution. To do this, the RBCs were mixed in cold PBS then placed in a centrifuge at 1000 rpm at 4 ℃ for 10 minutes. This process was repeated three times and then the avian RBCs were resuspended in PBS.
- Serum treatment. Serum was treated with a receptor destroying enzyme (RDE) to inactivate non-antibody serum components that bind hemagglutinin. The treated serum was incubated for ~18 hours at 37 ℃ and then underwent heat inactivation for 45-60 minutes at 56 ℃.
- Serum Hemadsorption. The purpose of this process is to prevent unintentional binding of the turkey RBCs to any potential components in the solution. A solution with 0.05% turkey RBCs and serum, 1:10 in PBS, was made and centrifuged at 1000 rpm for 5 minutes, then the supernatant was removed. Separately, 600 uL of PBS was used to make a 1:10 dilution of serum, and the solution was used to resuspend the RBCs. The solution was then incubated at 4 ℃ for an hour, mixed gently every 15 minutes, then centrifuged for eight minutes at 2000 rpm. Finally, the adsorbed serum was removed.
- Preparation and Titration of Antigens. To make the dilutions, 50 uL of PBS was added in the V-bottom microtiter plate. Reference antigens are verified by making a 1:10 dilution of antigen in PBS in a tube, and 100 uL of the solution were placed into column one of the plates. The dilutions are made when 50 uL are transferred from the first column of the microtiter plate to each consecutive column until the tenth column is reached, and the last 50 uL taken is discarded. Lastly, 50 uL of the washed RBC solution is added to all wells and then sealed and incubated for 30-45 minutes at room temperature. Back titrations are made to reaffirm antigen dilutions 24 hours before the HAI was conducted. Then, a serial two-fold dilution is made in columns while maintaining an RBC control column for each antigen. Lastly 50 uL of RBCs are added to all wells and left to sit for 30 minutes.
To quantify antibodies, titers of the HAI are read by noting the last titer showing hemagglutination inhibition (Figure 1). An average of antibody titters between both groups and each visit was made. Serum dilutions were used to quantify antibody productions and measure the differences between visits or between the two groups. As the dilutions continue down the columns, each row becomes more diluted (1:10, 1:20, etc.), and this determines the quantity of the antibodies created by the participants. High titers indicate a “strong” antibody response.

RESULTS.
Demographics of the research participants are shown in Table 1, with 17 participants in each group. PLWH had twice the number of males than females, while the CG had three times the number of females compared to males. For race, white was predominant in the CG and an even distribution between black/African American and white was present in the PLWH group.
| Table 1. Participant demographics | |||
| Characteristic | PLWH | CG | |
| Total Number of Participants | 17 | 17 | |
| Average Age | 51.3 | 51.8 | |
| Sex | |||
| Females | 5 | 13 | |
| Males | 12 | 4 | |
| Race | |||
| Black/African American | 9 | 1 | |
| White | 8 | 15 | |
| Mixed | 0 | 1 | |
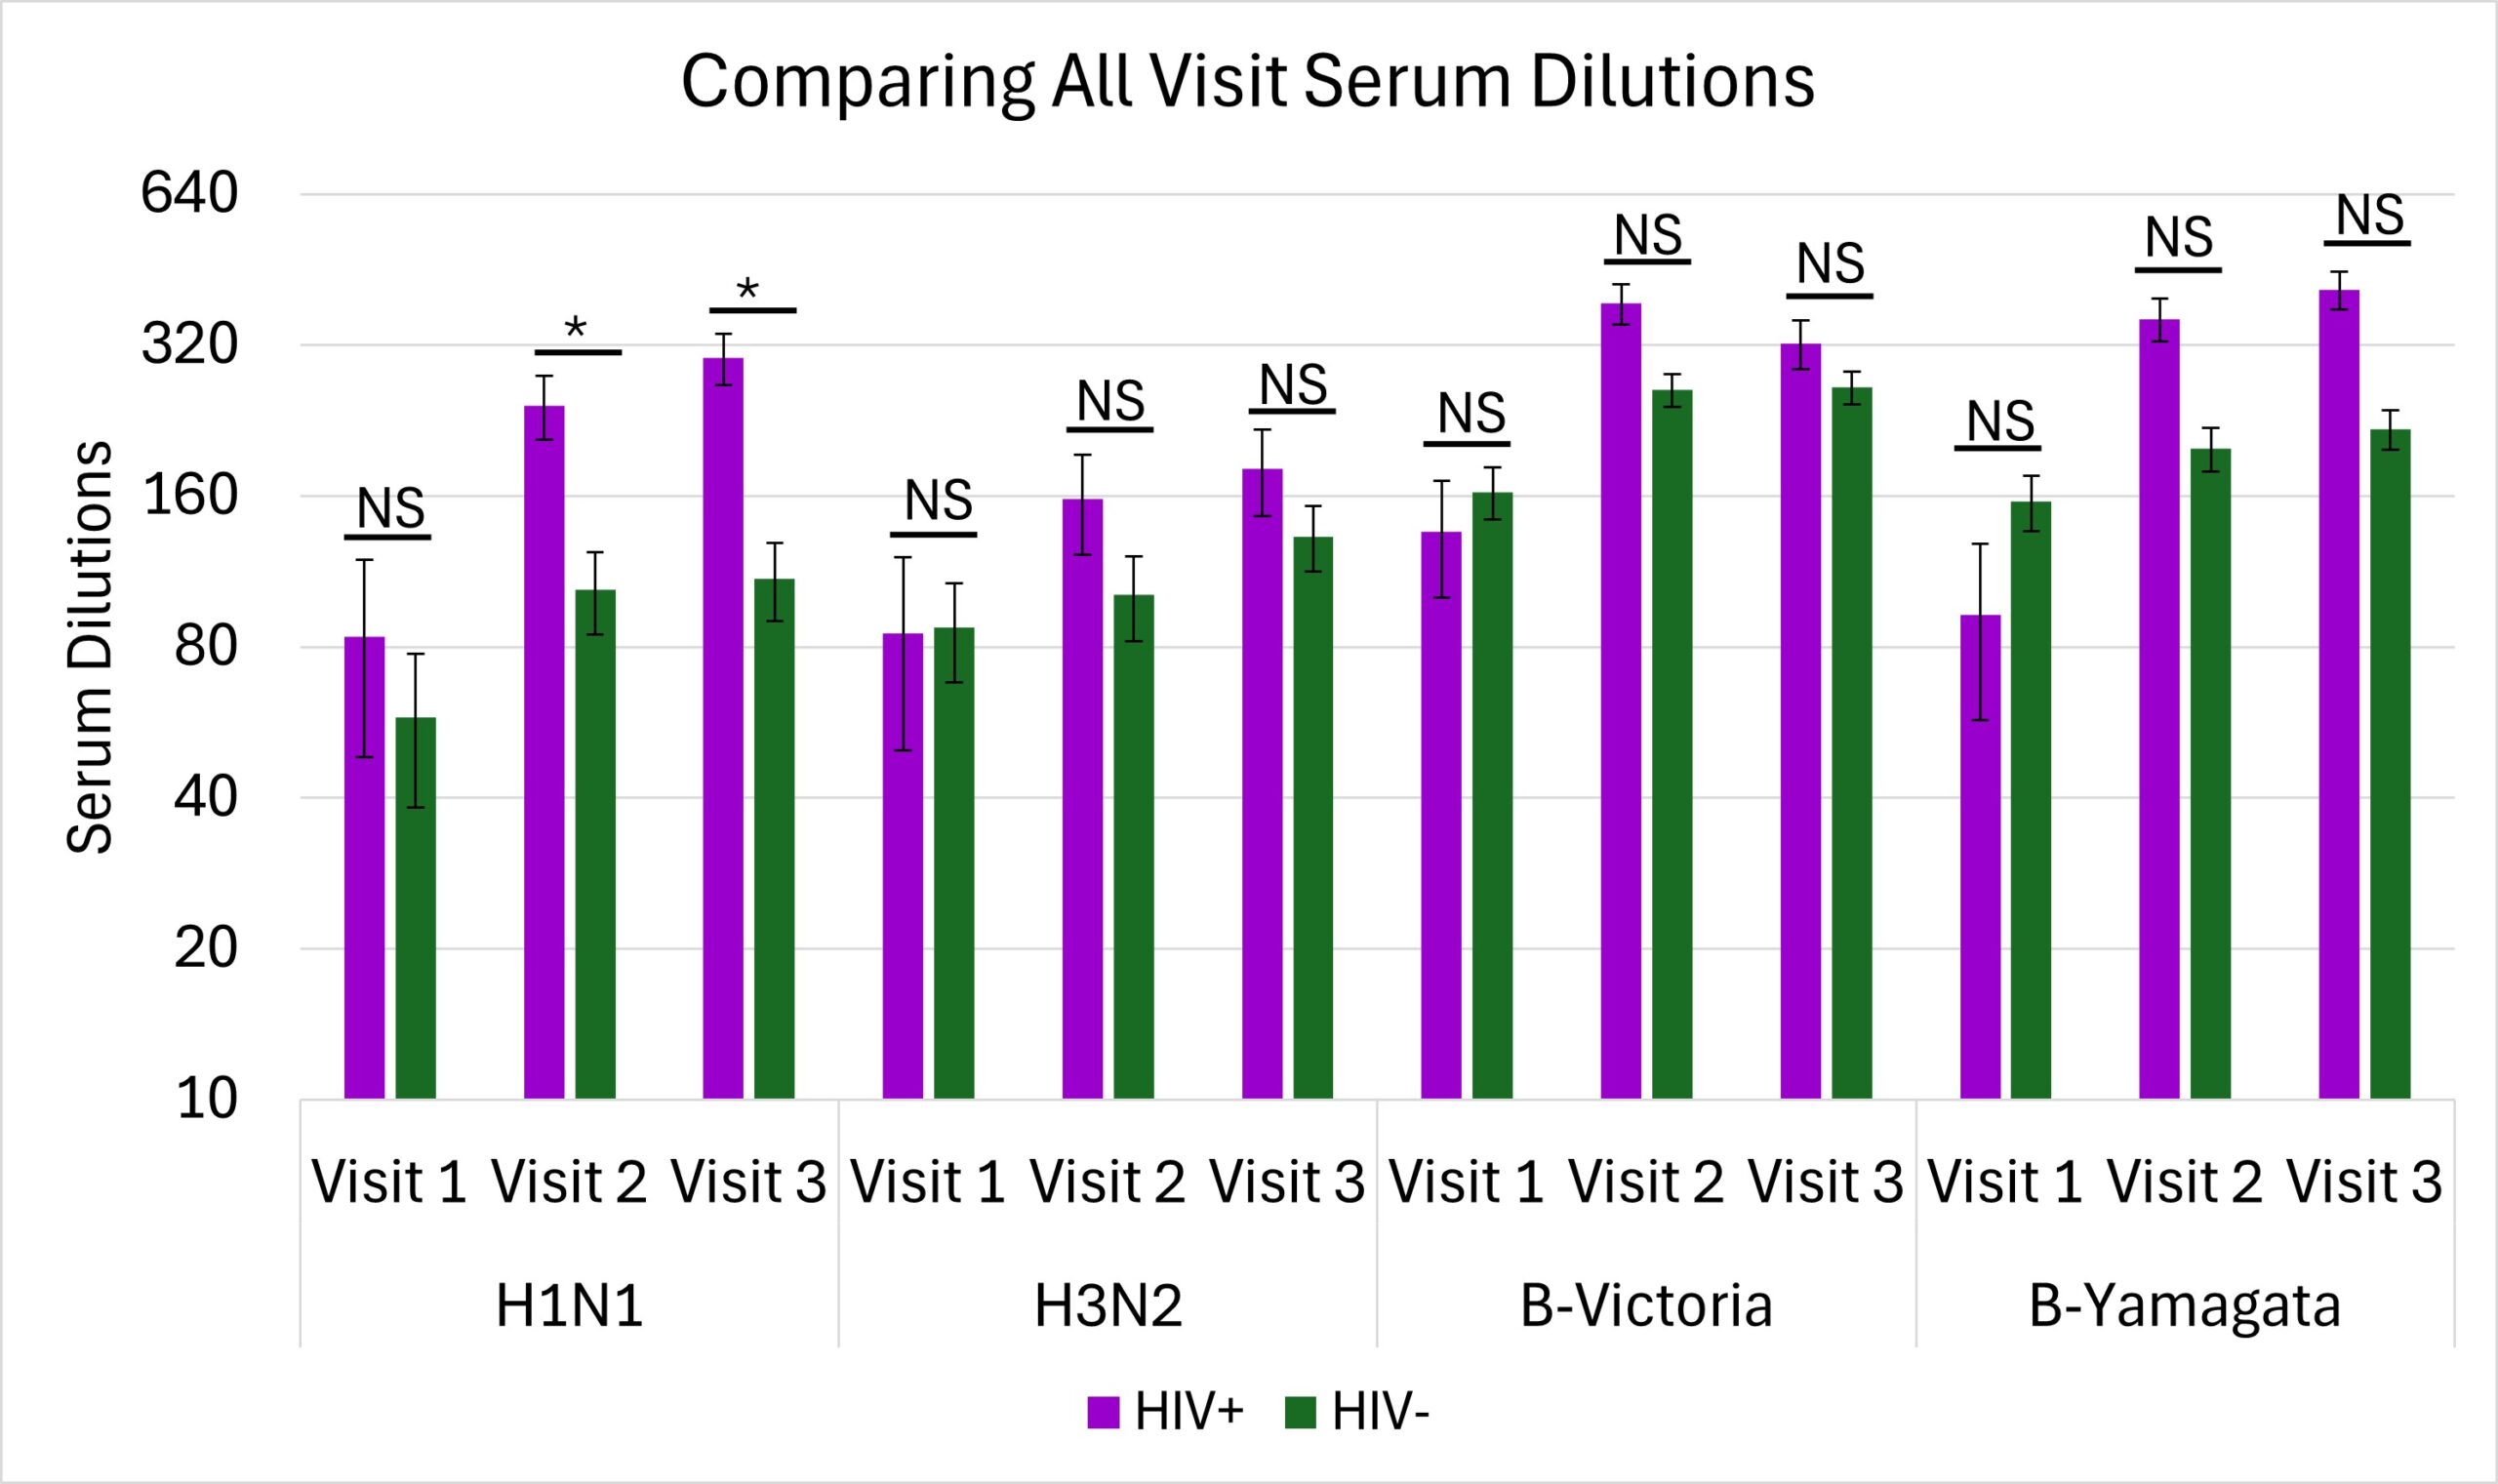
The only significant differences were seen during visit 2 (p=0.02) and visit 3 (p=0.03) in the H1N1 antigen where there were higher antibody productions for the PLWH group (Figure 2).

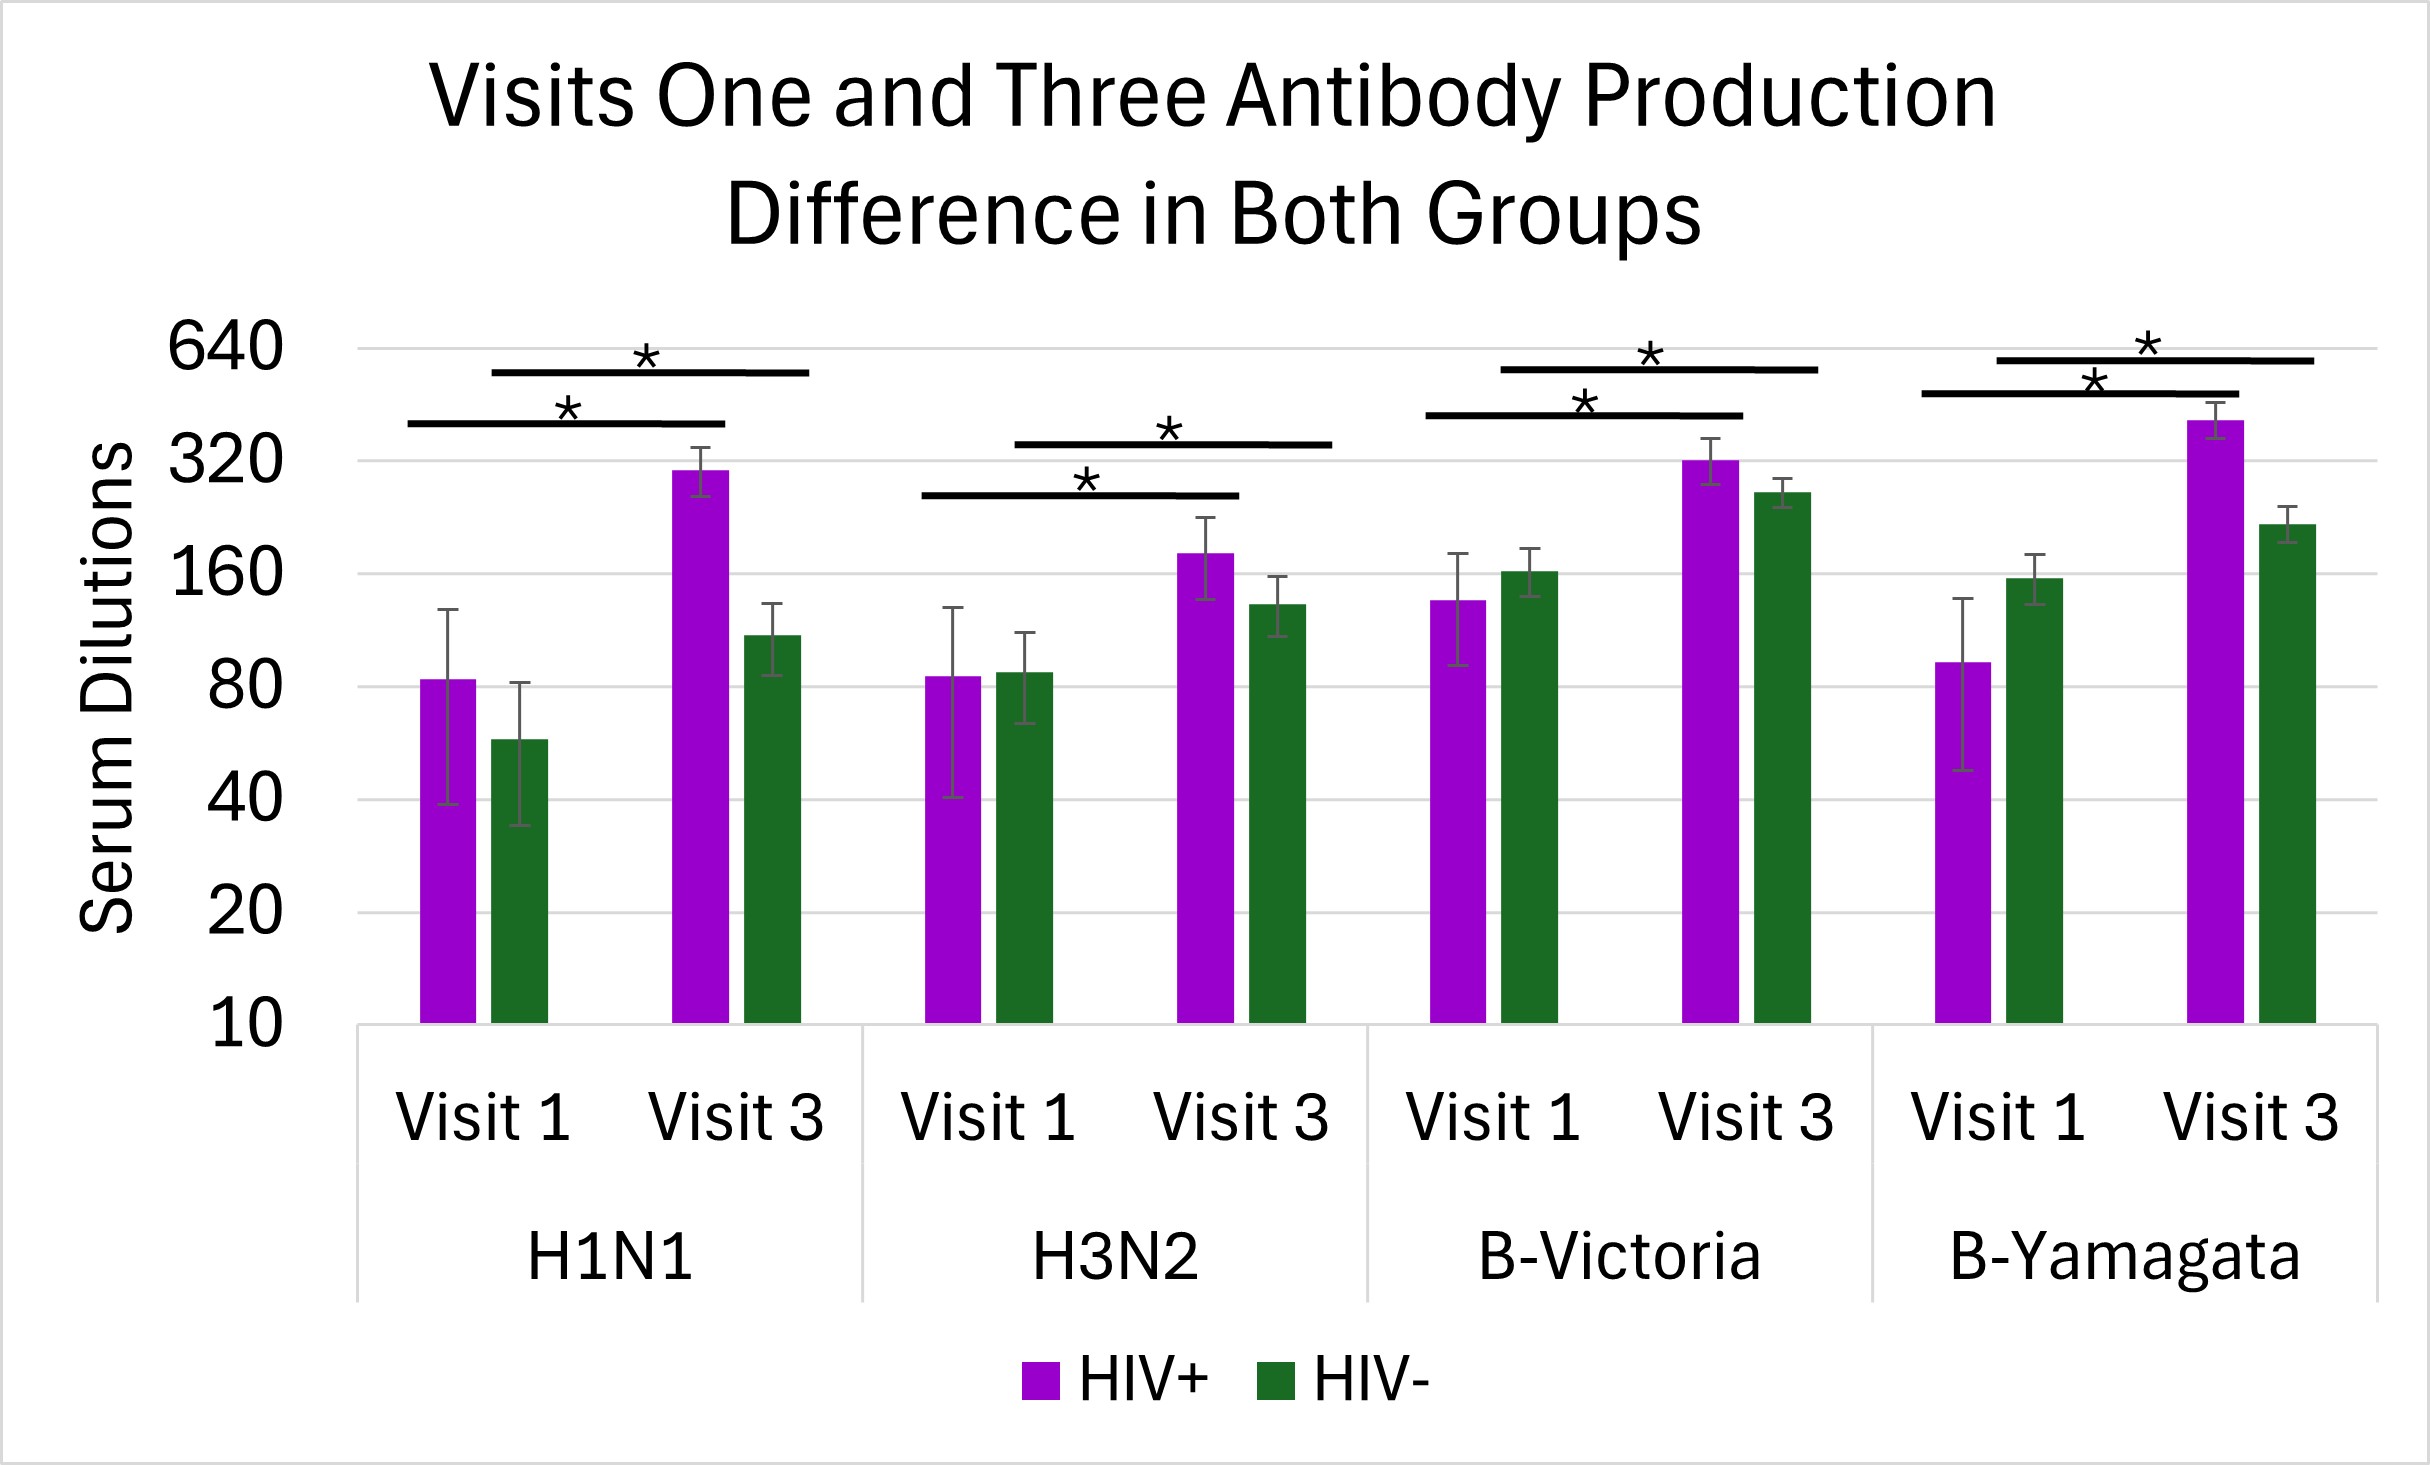
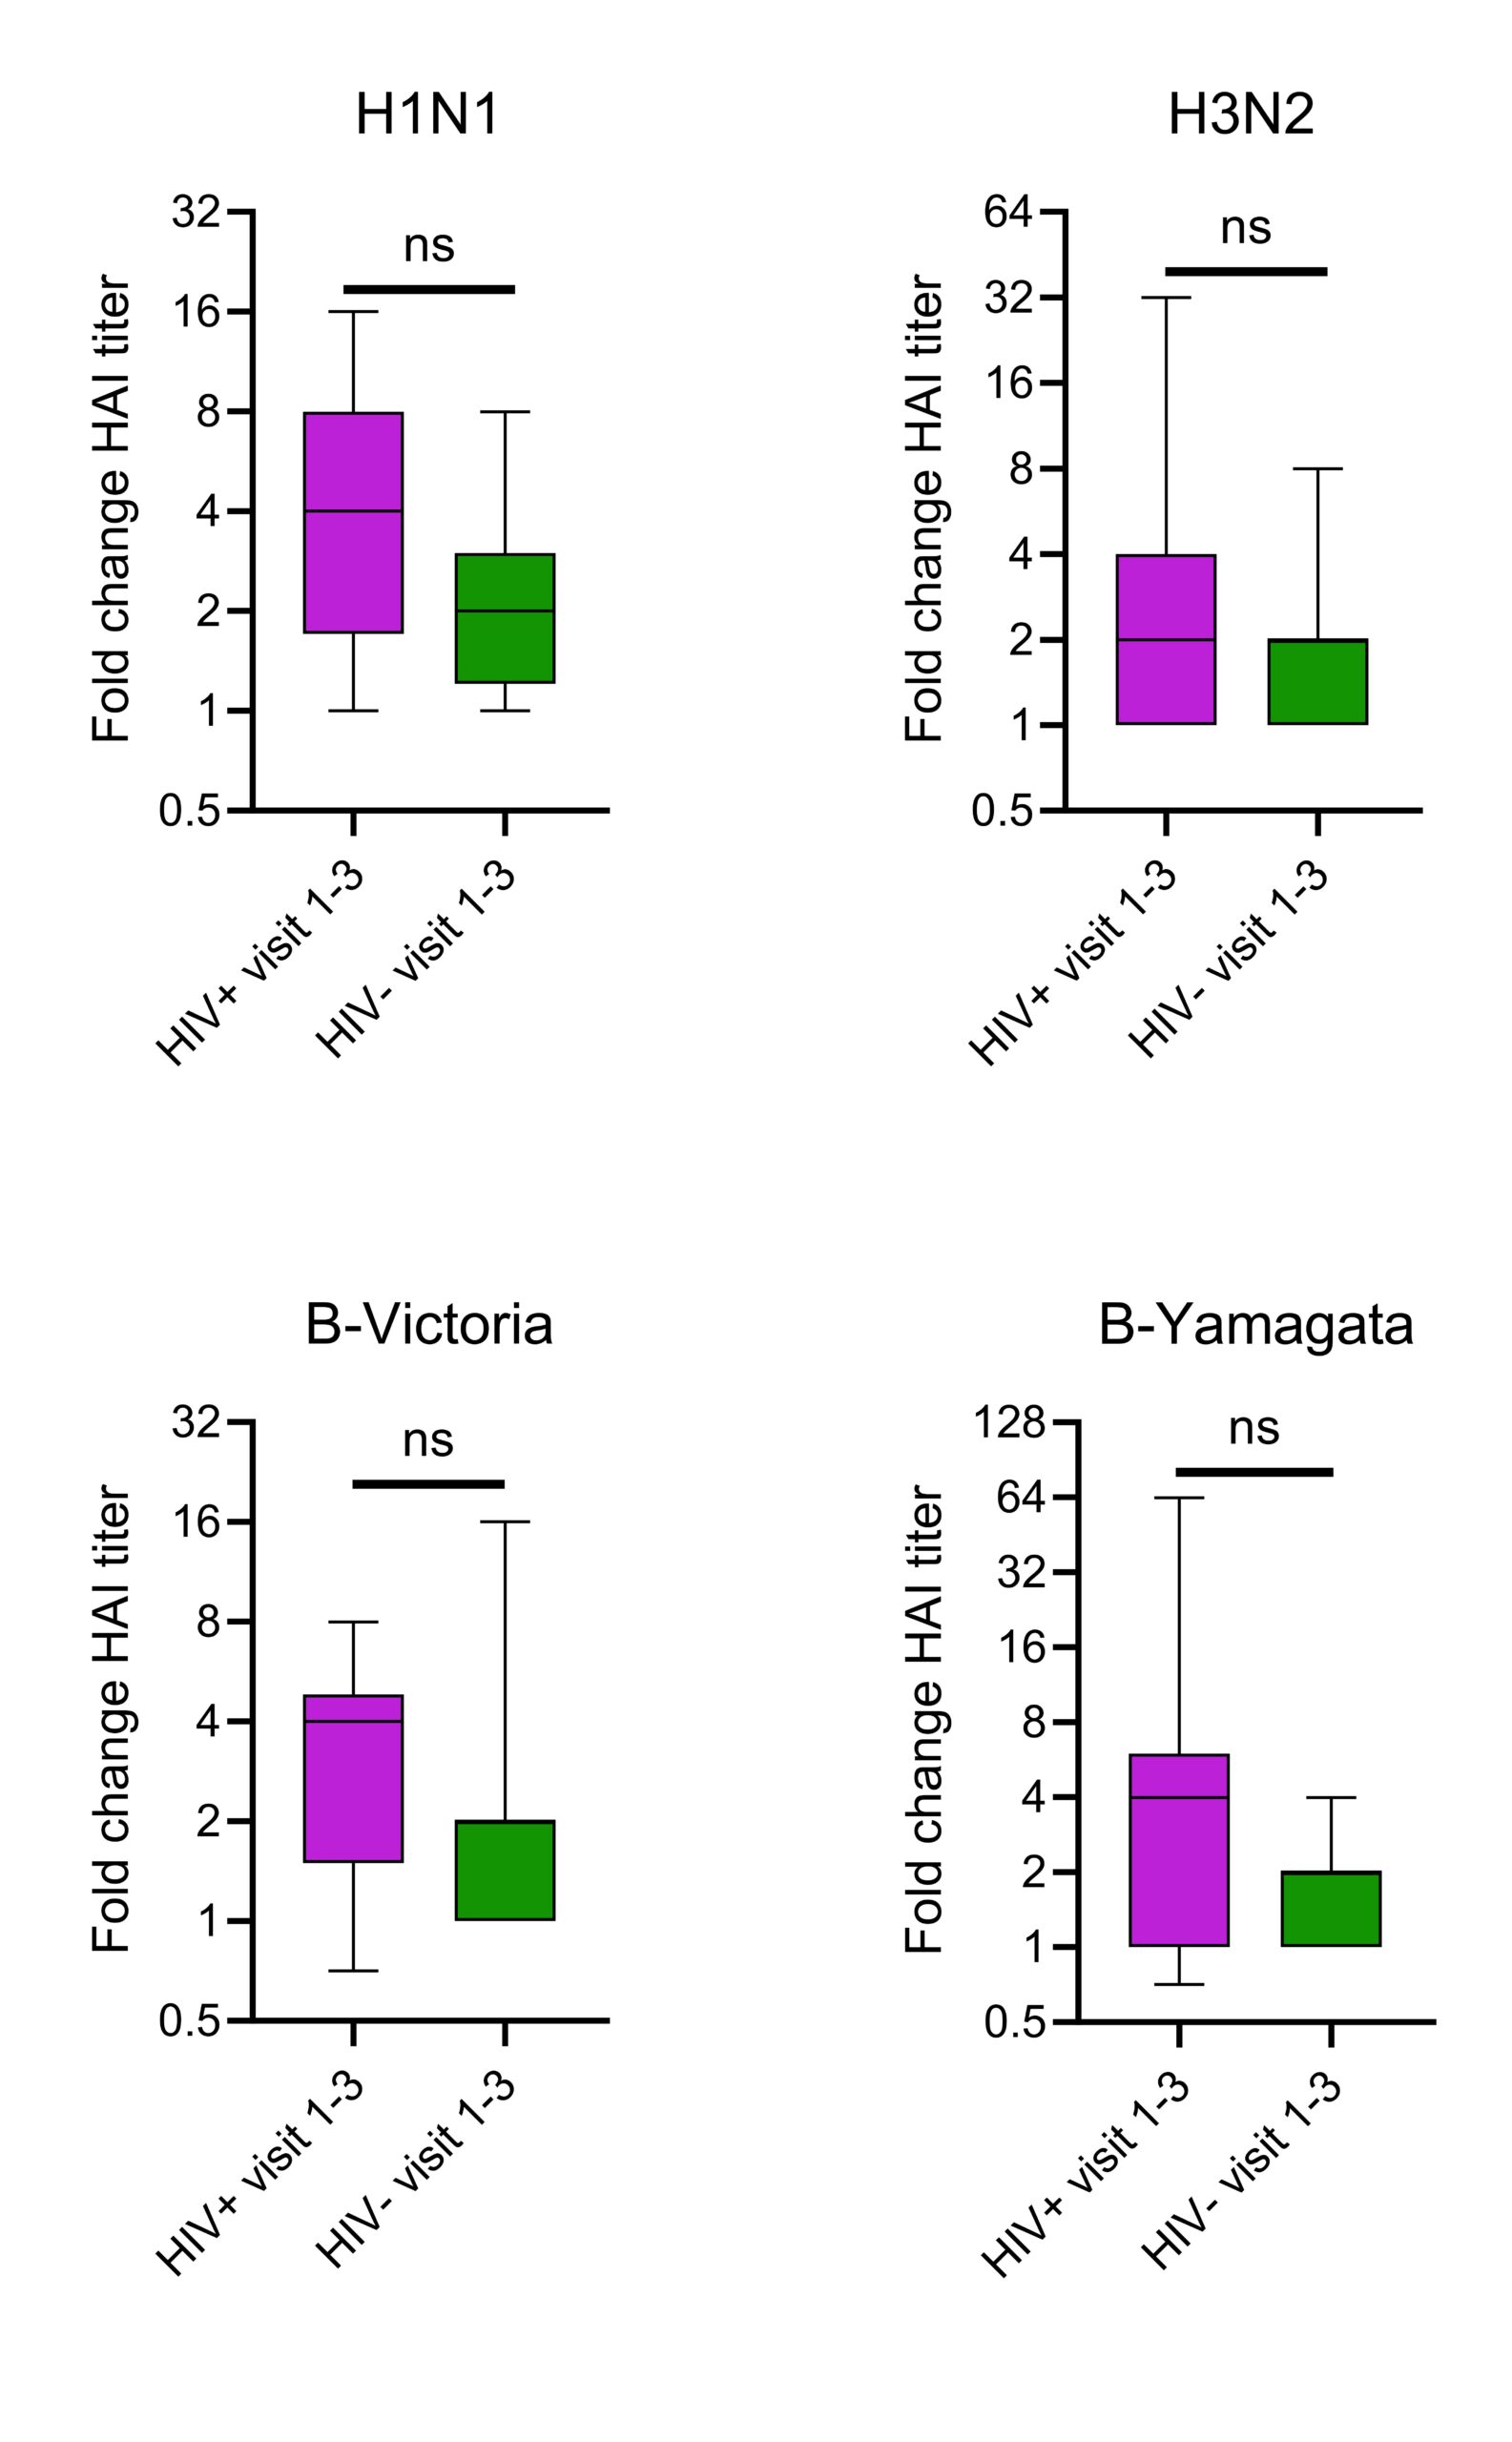
There were significant differences in average antibody production from visit 1 to 3 in the CG for H1N1 (p=0.008), H3N2 (p=0.04), B-Victoria (p=0.002), and B-Yamagata (p=0.009) shown in Figure 3. Similarly, there were also significant differences in average antibody production from visit 1 to 3 in the PLWH group for H1N1 (p=0.007), H3N2 (p=0.01), B-Victoria (p=0.002), and B-Yamagata (p=0.01) shown in Figure 3. Changes between visits 1and 3 for both groups were analyzed using a Kruskal Willis test. There were no significant differences between the changes in the CG and PLWH in any antigen; H1N1 (p=0.125), H3N2 (p=0.388), B-Victoria (p=0.0823), and B-Yamagata (p=0.0544) demonstrated in Figure 4. This shows that there was an effective immune response to the vaccine as both groups had similar overall antibody titers.


DISCUSSION.
The goal of this study was to compare the antibody response post-influenza vaccination of PLWH on ART to the CG. The initial hypothesis was that, despite ART, PLWH would have reduced responses to vaccination compared to CG. Most antibody titters to each antigen across visits and between participant groups were similar (Figure 2), suggesting PLWH maintains antibody titters to influenza antigens. As PLWH tend to have lower CD4 T cell numbers, it was interesting to observe their ability to mount antibody responses in response to vaccination. Significant increases in antibody production in both groups over time (Figures 3 & 4) were shown. The change of antibodies produced from visit 1 to visit 3 in both groups were similar (Figure 4). There were a variety of responses and changes between the two groups over the course of the four strains of influenza vaccines (Figure 4), but no additional outlier tests were performed. Overall similarities in antibody titers at each time point and increase in titers after vaccination, suggests that PLWH on ART maintain a normal ability to generate antibodies after vaccination. Quantity changes over time resulted as similar when comparing the PLWH and CG. This rejects the initial hypothesis that PLWH would have significantly lower antibody production than CG.
It is known that antiretroviral therapy (ART) is effective in restoring CD4 T cell numbers. However, people undergoing ART are still more prone to side effect diseases [11]. This is either the result of chronic HIV infection, or from long term ART. With HIV being a chronic condition impacting the immune system, the immune system of patients on ART were considered. Our data suggest ART is an effective method in enhancing the immune system of PLWH and when given the influenza vaccine an ideal response is created.
There are related published studies describing the impact of flu vaccination in PLWH and the immune responses to enhanced flu vaccines [15]. In one study, children living with HIV were vaccinated with an enhanced version of the flu vaccine. Overall findings showed these vaccines allowed for an ideal immune response to provide protection for the individual. This research is like the focus of our study, bringing inclusivity to the HIV+ population. The use of HAIs to quantify antibody production was like our study; however, they administered the MF59 adjuvanted vaccine to help with immune responses instead of the seasonal vaccine given in the US.
The findings of our study are consistent with the results of other studies evaluating HIV+ participants on ART, and this allowed for their viral loads to become undetectable [12]. There was an analysis of the health quality of PLWH on ART by taking their CD4 T cell count and comparing that count to one of a person not living with HIV. In this study, ART was an important factor as it assisted in improving antibody quantities and aligns with my research as the impact of ART is being studied.
As a next step, samples from both groups will be evaluated by flow cytometry. This will include analysis of T cell responses to influenza. It is possible that despite the ability of PLWH to make antibody responses, they still may show diminished T cell activation to influenza. Analyzing the immune responses of PLWH will teach our society what impacts having the flu vaccine can have on immune system responses.
ACKNOWLEDGMENTS.
I would like to thank the SSMV and my advisor, Dr. Angela Eeds, for the guidance given to me. Also, thanks to my mentor, Jared Oakes, my PI, Dr. Spyros Kalams, and the Kalams Lab for their instruction and allowing me to work alongside them.
REFERENCES.
- U.S Centers for Disease Control and Prevention, “Disease Burden of Flu,” Centers for Disease Control and Prevention, (2024); https://www.cdc.gov/flu-burden/php/about/index.html?
- A. Monto, et. al., “Clinical Signs and Symptoms Predicting Influenza Infection.” Arch Intern Med. 160, 3243-3247 (2000).
- U.S Centers for Disease Control and Prevention, “Antigenic characterization,” Centers for Disease Control and Prevention, (2024); https://www.cdc.gov/flu/php/viruses/antigenic.html?CDC_AAref_Val.
- J.M. Nicholls, et. al., “Sialic Acid Receptor Detection in the Human Respiratory Tract: Evidence for Widespread Distribution of Potential Binding Sites for Human and Avian Influenza Viruses – Respiratory Research.” Respiratory Research 8, 73 (2007).
- U. Kumlin, et. al., “Sialic acid tissue distribution and influenza virus tropism.” Influenza and Other Respiratory Viruses 2, 147-154 (2008).
- P. Dettmer, Immune: A Journey into the Mysterious System That Keeps You Alive (New York: Random House, 2021).
- Centers for Disease Control and Prevention, “Who is at Higher Risk of Flu Complications,” Centers for Disease Control and Prevention, https://www.cdc.gov/flu/highrisk/index.htm.
- A. Lansky, et. al., “Epidemiology of HIV in the United States,” JAIDS Journal of Acquired Immune Deficiency Syndromes 55, S64-S68 (2010).
- N. Pishesha, et.al., “A guide to antigen processing and presentation” Nature Reviews Immunology 22, 751-764 (2022).
- S. Moir, et.al, “Evidence for HIV-associated B cell exhaustion in a dysfunctional memory B cell compartment in HIV-infected viremic individuals.” Journal of Experimental Medicine 205, 1797-1805 (2008)
- G. Guaraldi, et. al, “Premature Age-Related Comorbidities Among HIV-Infected Persons Compared with the General Population.” Clinical Infectious Diseases 53, 1120-1126 (2011)
- M.T May, et. al, “Impact on life expectancy of HIV-1 positive individuals of CD4+ cell count and viral load response to antiretroviral therapy.” AIDS 28, 1193-1202 (2014)
- J. Currenti et al., “Tracking of activated CTFH cells following sequential influenza vaccinations reveals transcriptional profile of clonotypes driving a vaccine-induced immune response,” Frontiers in Immunology 14, 1133781 (2023)
- I.G. Ovsyannikova, et al., “Turkey versus Guinea pig red blood cells: Hemagglutination differences alter hemagglutination inhibition responses against influenza A/H1N1,” Viral Immunology 27, 1-5 (2014)
- P. Palma et al., “Safety and immunogenicity of a monovalent MF59®-adjuvanted A/H1N1 vaccine in HIV-infected children and young adults,” Biologicals 40, 134-139 (2012)
Posted by buchanle on Friday, June 20, 2025 in May 2025.
Tags: Antibodies, Hemagglutination, HIV, Influenza, Vaccine

